Observability: Monitoring
This guide demonstrates how to collect metrics from two Jmix applications with Prometheus, view them in Grafana on the ready-made "Jmix 3 Monitoring" dashboard, and use the dashboard to find out where a slow view spends its time.
Metrics are useful when they are collected continuously. The accumulated data shows how performance changes from one release to another, alerts report a problem before users do (see Alerting), and during an incident a metric leads to the trace of a slow request (see Finding a Slow View).
Requirements
Implementing this guide step by step requires the following:
-
Complete the Distributed Tracing Guide. It starts the Grafana OpenTelemetry LGTM stack and describes the two Petclinic applications used in this guide.
-
Get the completed sample project, which includes all the examples used in this guide.
-
The source repository is available as a ZIP archive.
-
Or clone it and switch to the
release_3branch:git clone https://github.com/jmix-framework/jmix-observability-tracing-sample cd jmix-observability-tracing-sample git checkout release_3
-
What We are Going to Build
In this guide, we add metrics to the Petclinic Backend and Portal applications from the tracing guide. Tracing has already enabled the Jmix observations for the UI and data access, and every observation produces a metric as well as a span. The remaining steps are to expose the metrics to Prometheus and to read them.
The final setup includes:
-
Prometheus Endpoint: both applications expose their metrics at
/actuator/prometheus. -
Jmix 3 Metrics: views, fragments, data loaders, UI actions, and data loading and saving, recorded with the Jmix 3 tag schema.
-
Prometheus Service: a Prometheus container scrapes both applications and is available in Grafana as a data source.
-
Jmix 3 Monitoring Dashboard: a Grafana dashboard with sections for views, data loaders, fragments, actions, data access, HTTP and the JVM.
-
Slow View Investigation: the path from the dashboard to the stages of a view, its data loaders and a trace.
How Jmix Metrics Work
Jmix creates Micrometer observations for its operations. The jmix.ui.views observation covers the lifecycle stages of views, jmix.ui.data covers data loaders, jmix.ui.fragments covers fragments, jmix.ui.actions covers action execution, and jmix.data.load and jmix.data.save cover loading and saving through DataManager. Spring Boot turns each observation into a timer, and the observation tags become the tags of the timer: view.id, lifecycle.name, loader.id, entity.name and others.
A timer records the number of operations, their total duration and the longest operation in the last few minutes. The dashboard calculates the rate and the average duration from the first two values and shows the third one as the maximum duration.
In the Prometheus format, dots in names are replaced with underscores, and the base unit is added to the timer name. The jmix.ui.views timer becomes the jmix_ui_views_seconds_count, jmix_ui_views_seconds_sum and jmix_ui_views_seconds_max series, and the view.id tag becomes the view_id label.
All Jmix metrics, their tags and settings are described on the Metrics page.
Setting Up Metrics
Adding the Prometheus Registry
Spring Boot exposes metrics at the /actuator/prometheus endpoint when the Micrometer Prometheus registry is on the classpath. Add it to the build.gradle of both applications:
// -----------------------------------------------------------
// METRICS
// -----------------------------------------------------------
// Exposes metrics in the Prometheus format at /actuator/prometheus.
implementation 'io.micrometer:micrometer-registry-prometheus'
The applications already expose all Actuator endpoints with management.endpoints.web.exposure.include=, and their security configurations permit anonymous access to /actuator/*. In this sample, Prometheus can read the endpoint without credentials. See Before Going to Production for production settings.
Configuring Metrics
The jmix.ui.ui-observation-enabled and jmix.core.data-observation-enabled properties are already enabled in the tracing configuration. Add the metrics configuration to application.properties of both applications:
###############################################################################
# Metrics Configuration
###############################################################################
# ----- Jmix UI metrics: Jmix 3 tag schema -----
jmix.ui.legacy-monitoring-enabled=false

# ----- Common tag that distinguishes applications on dashboards -----
management.metrics.tags.application=${spring.application.name}-
jmix.ui.legacy-monitoring-enabled=falsekeeps only the Jmix 3 tag schema. Projects upgraded to Jmix 3 from 2.x get this property with thetruevalue. While it is enabled, view and data loader metrics are recorded with the Jmix 2 tags, and fragment metrics are not recorded at all, see Legacy UI Metrics Schema. -
management.metrics.tags.applicationadds theapplicationtag with the application name to every metric. The dashboard selects applications by this tag.
Running Prometheus
The Prometheus inside the LGTM container receives metrics over OTLP and does not read the /actuator/prometheus endpoint. The sample project therefore runs a separate Prometheus service:
prometheus:
  image: prom/prometheus:v3.5.0
  volumes:
    - ./prometheus/prometheus.yml:/etc/prometheus/prometheus.yml:ro
  extra_hosts:
    - "host.docker.internal:host-gateway"
  ports:
    - "9090:9090"
The scrape configuration lists both applications:
# Scrapes /actuator/prometheus of both applications.
# The first target of each job is the application running in Docker (Compose 'app' profile),
# the second one is the application started on the host, for example from Jmix Studio.
global:
  scrape_interval: 15s

scrape_configs:
  - job_name: petclinic
    metrics_path: /actuator/prometheus
    static_configs:
      - targets: ['petclinic:8080', 'host.docker.internal:8080']

  - job_name: petclinic-portal
    metrics_path: /actuator/prometheus
    static_configs:
      - targets: ['petclinic-portal:8081', 'host.docker.internal:8081']
Each job has two targets. The first one is the application started in Docker with the Compose app profile, the second one is the application started on the host, for example from Jmix Studio. Only one of them responds at a time; Prometheus marks the other one as down, and this does not affect the dashboard.
Grafana gets the new Prometheus as a data source from a provisioning file that the lgtm service mounts:
volumes:
- ./grafana/prometheus-actuator-datasource.yaml:/otel-lgtm/grafana/conf/provisioning/datasources/prometheus-actuator.yaml:ro# Grafana data source for the Prometheus service that scrapes /actuator/prometheus.
# The data source named Prometheus inside the LGTM container stores the metrics received over OTLP.
apiVersion: 1
datasources:
- name: Prometheus Actuator
type: prometheus
uid: prometheus-actuator
url: http://prometheus:9090
editable: true
jsonData:
timeInterval: 15sAfter the start, Grafana has two Prometheus data sources: Prometheus with the metrics received over OTLP, and Prometheus Actuator with the metrics read from /actuator/prometheus. The dashboard in this guide uses the second one.
Verifying the Metrics Setup
-
Start the Docker services from the sample project root:
docker compose -f docker/docker-compose.yaml up -d -
Start both applications from Jmix Studio, or build the JAR files and start all services with the Compose
appprofile, as described in the tracing guide. -
Open the Petclinic Portal at http://localhost:8081, log in and open the pet and visit lists and their detail views several times.
-
Open the Prometheus targets page at http://localhost:9090/targets. The targets of the running applications have the
UPstate. -
Open Grafana at http://localhost:3000 (username:
admin, password:admin), go to Drilldown → Metrics, select thePrometheus Actuatordata source and typejmix_uiin the search field.
The Jmix UI metrics appear: jmix_ui_views_*, jmix_ui_data_*, jmix_ui_fragments_* and jmix_ui_actions_*.
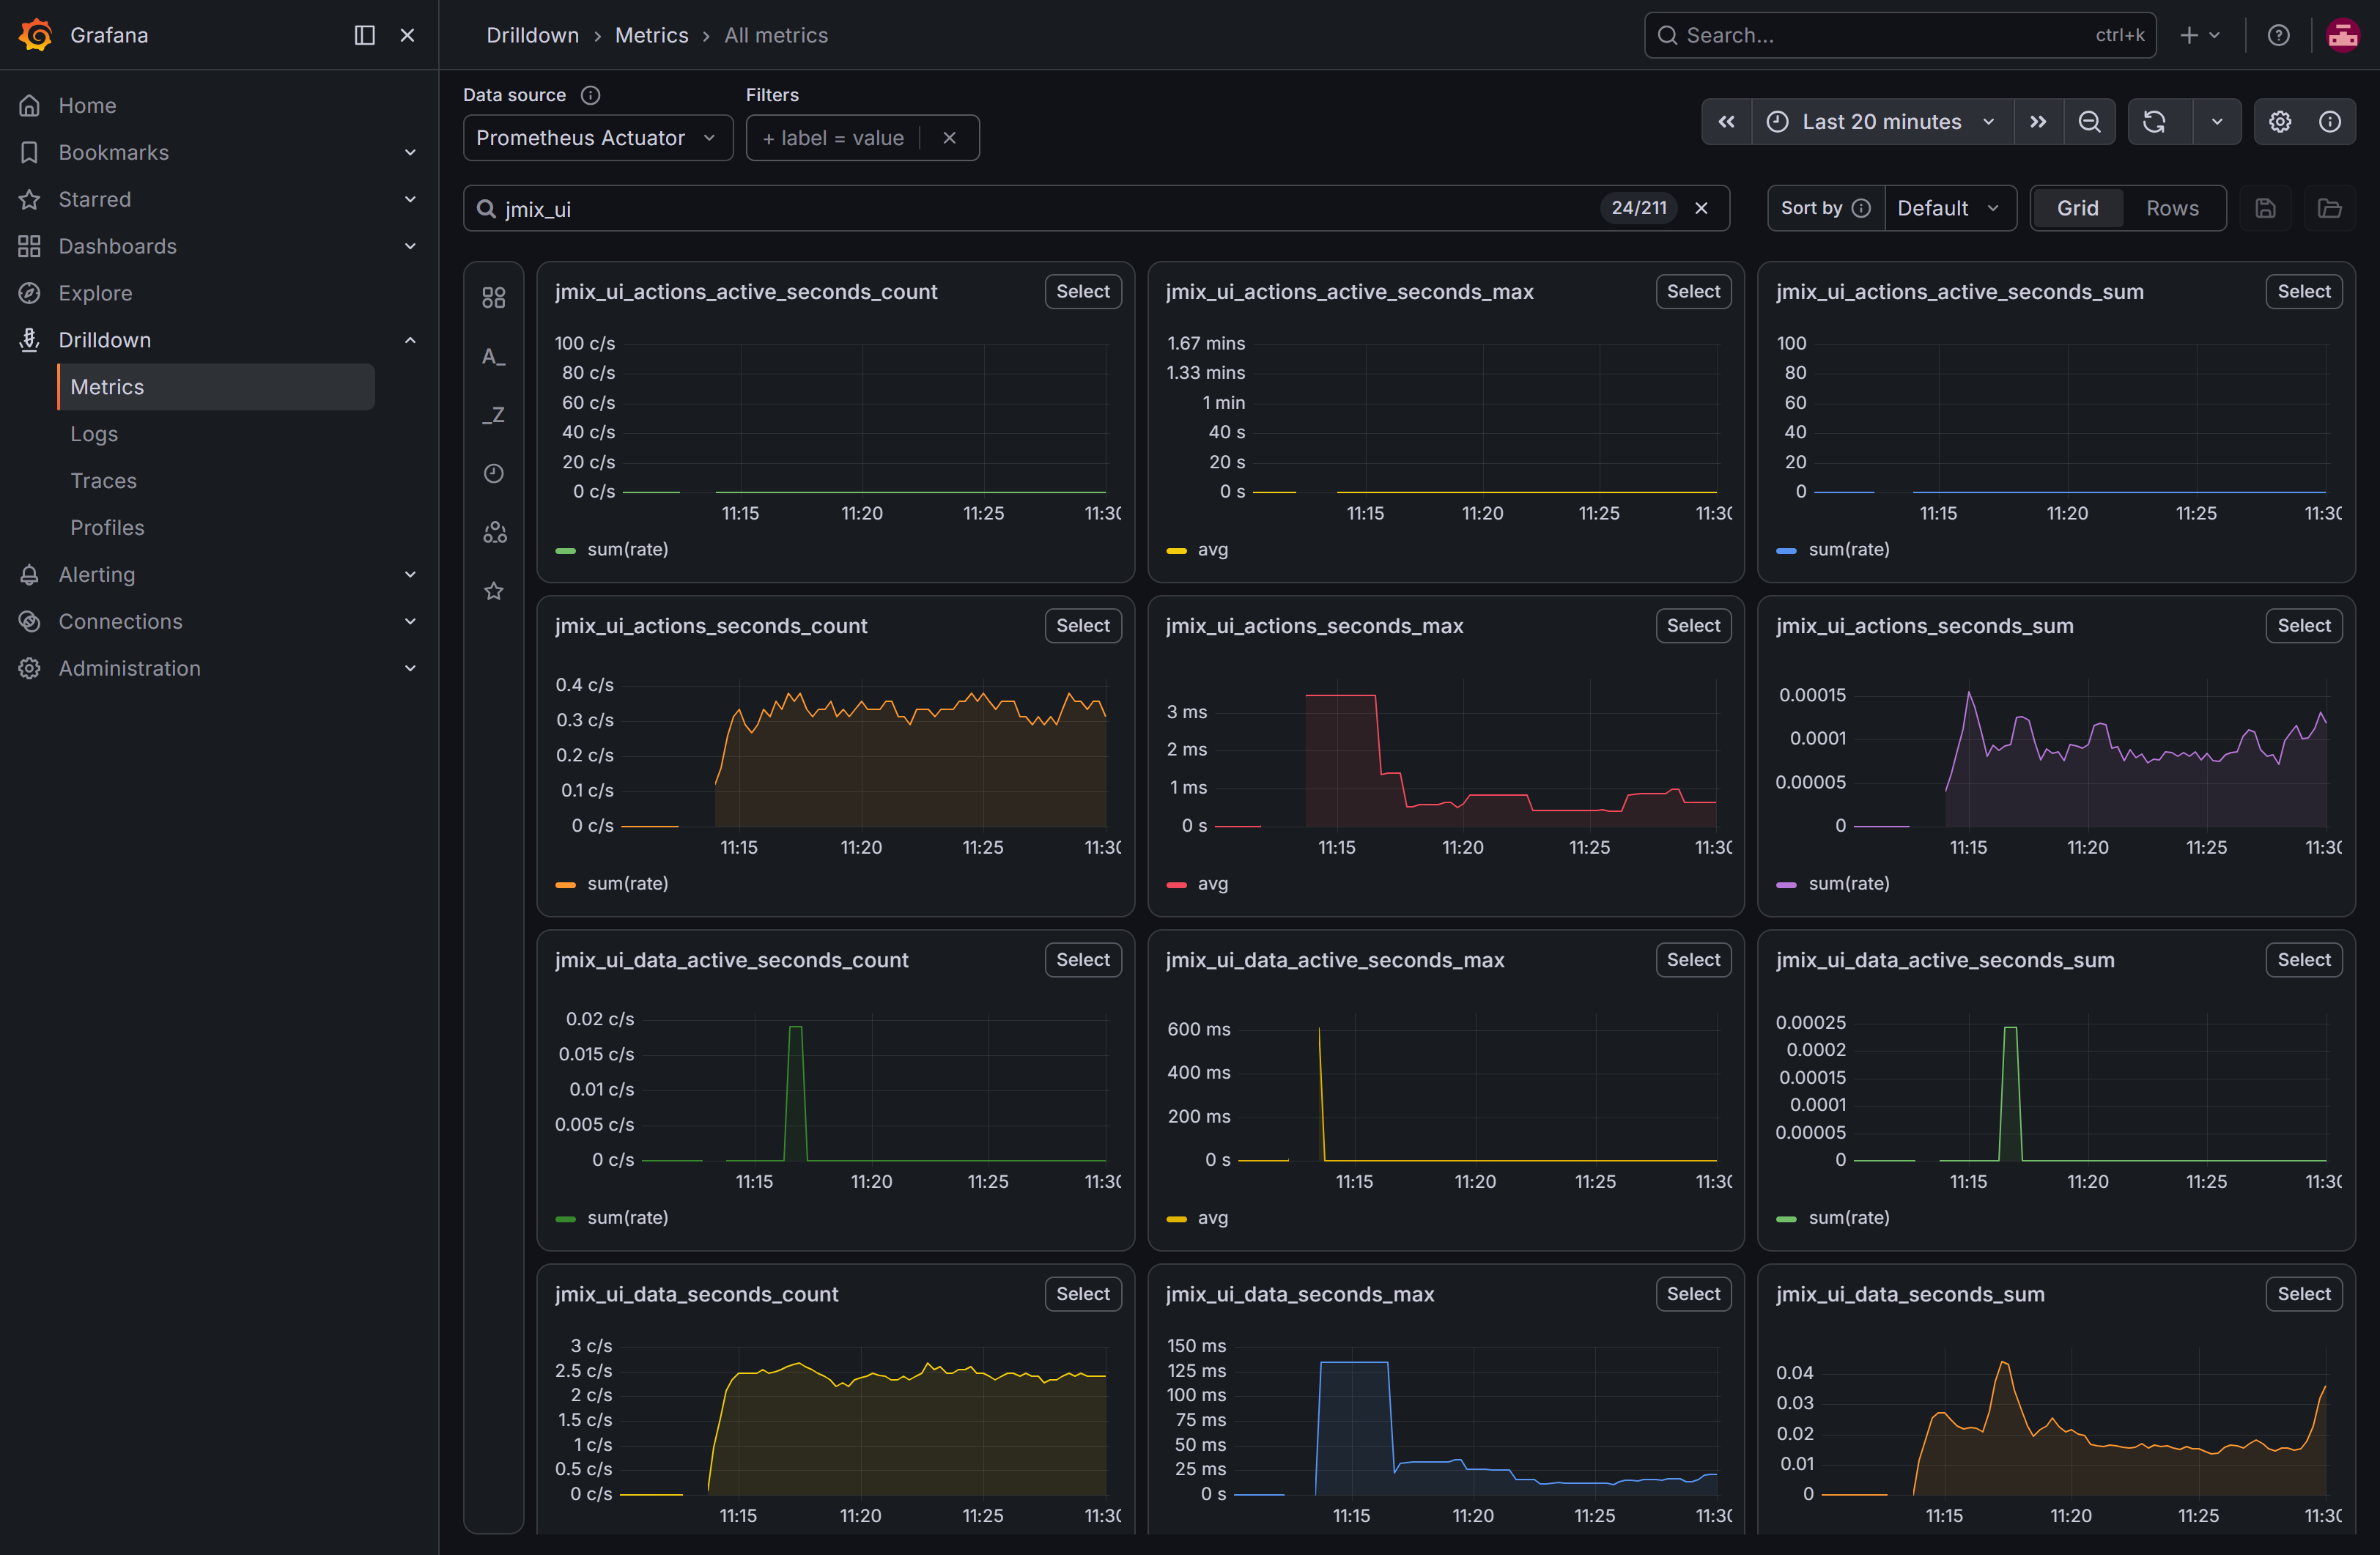
The active series belong to the operations that are running at the moment. They are shown in the Operations in progress section of the dashboard.
Importing the Jmix 3 Monitoring Dashboard
The standard Jmix dashboards are published in the jmix-grafana-dashboards repository. The "Jmix 3 Monitoring" dashboard reads the metrics that Prometheus collects from /actuator/prometheus and selects applications by the application tag.
-
Download
Jmix 3 Monitoring.jsonfrom the repository. -
In Grafana, open Dashboards → New → Import.
-
Upload the file, select
Prometheus Actuatorin the Prometheus field and click Import.
The top row of the dashboard selects the data source, application, instance, views, data loaders and entities. The dashboard refreshes every 30 seconds.
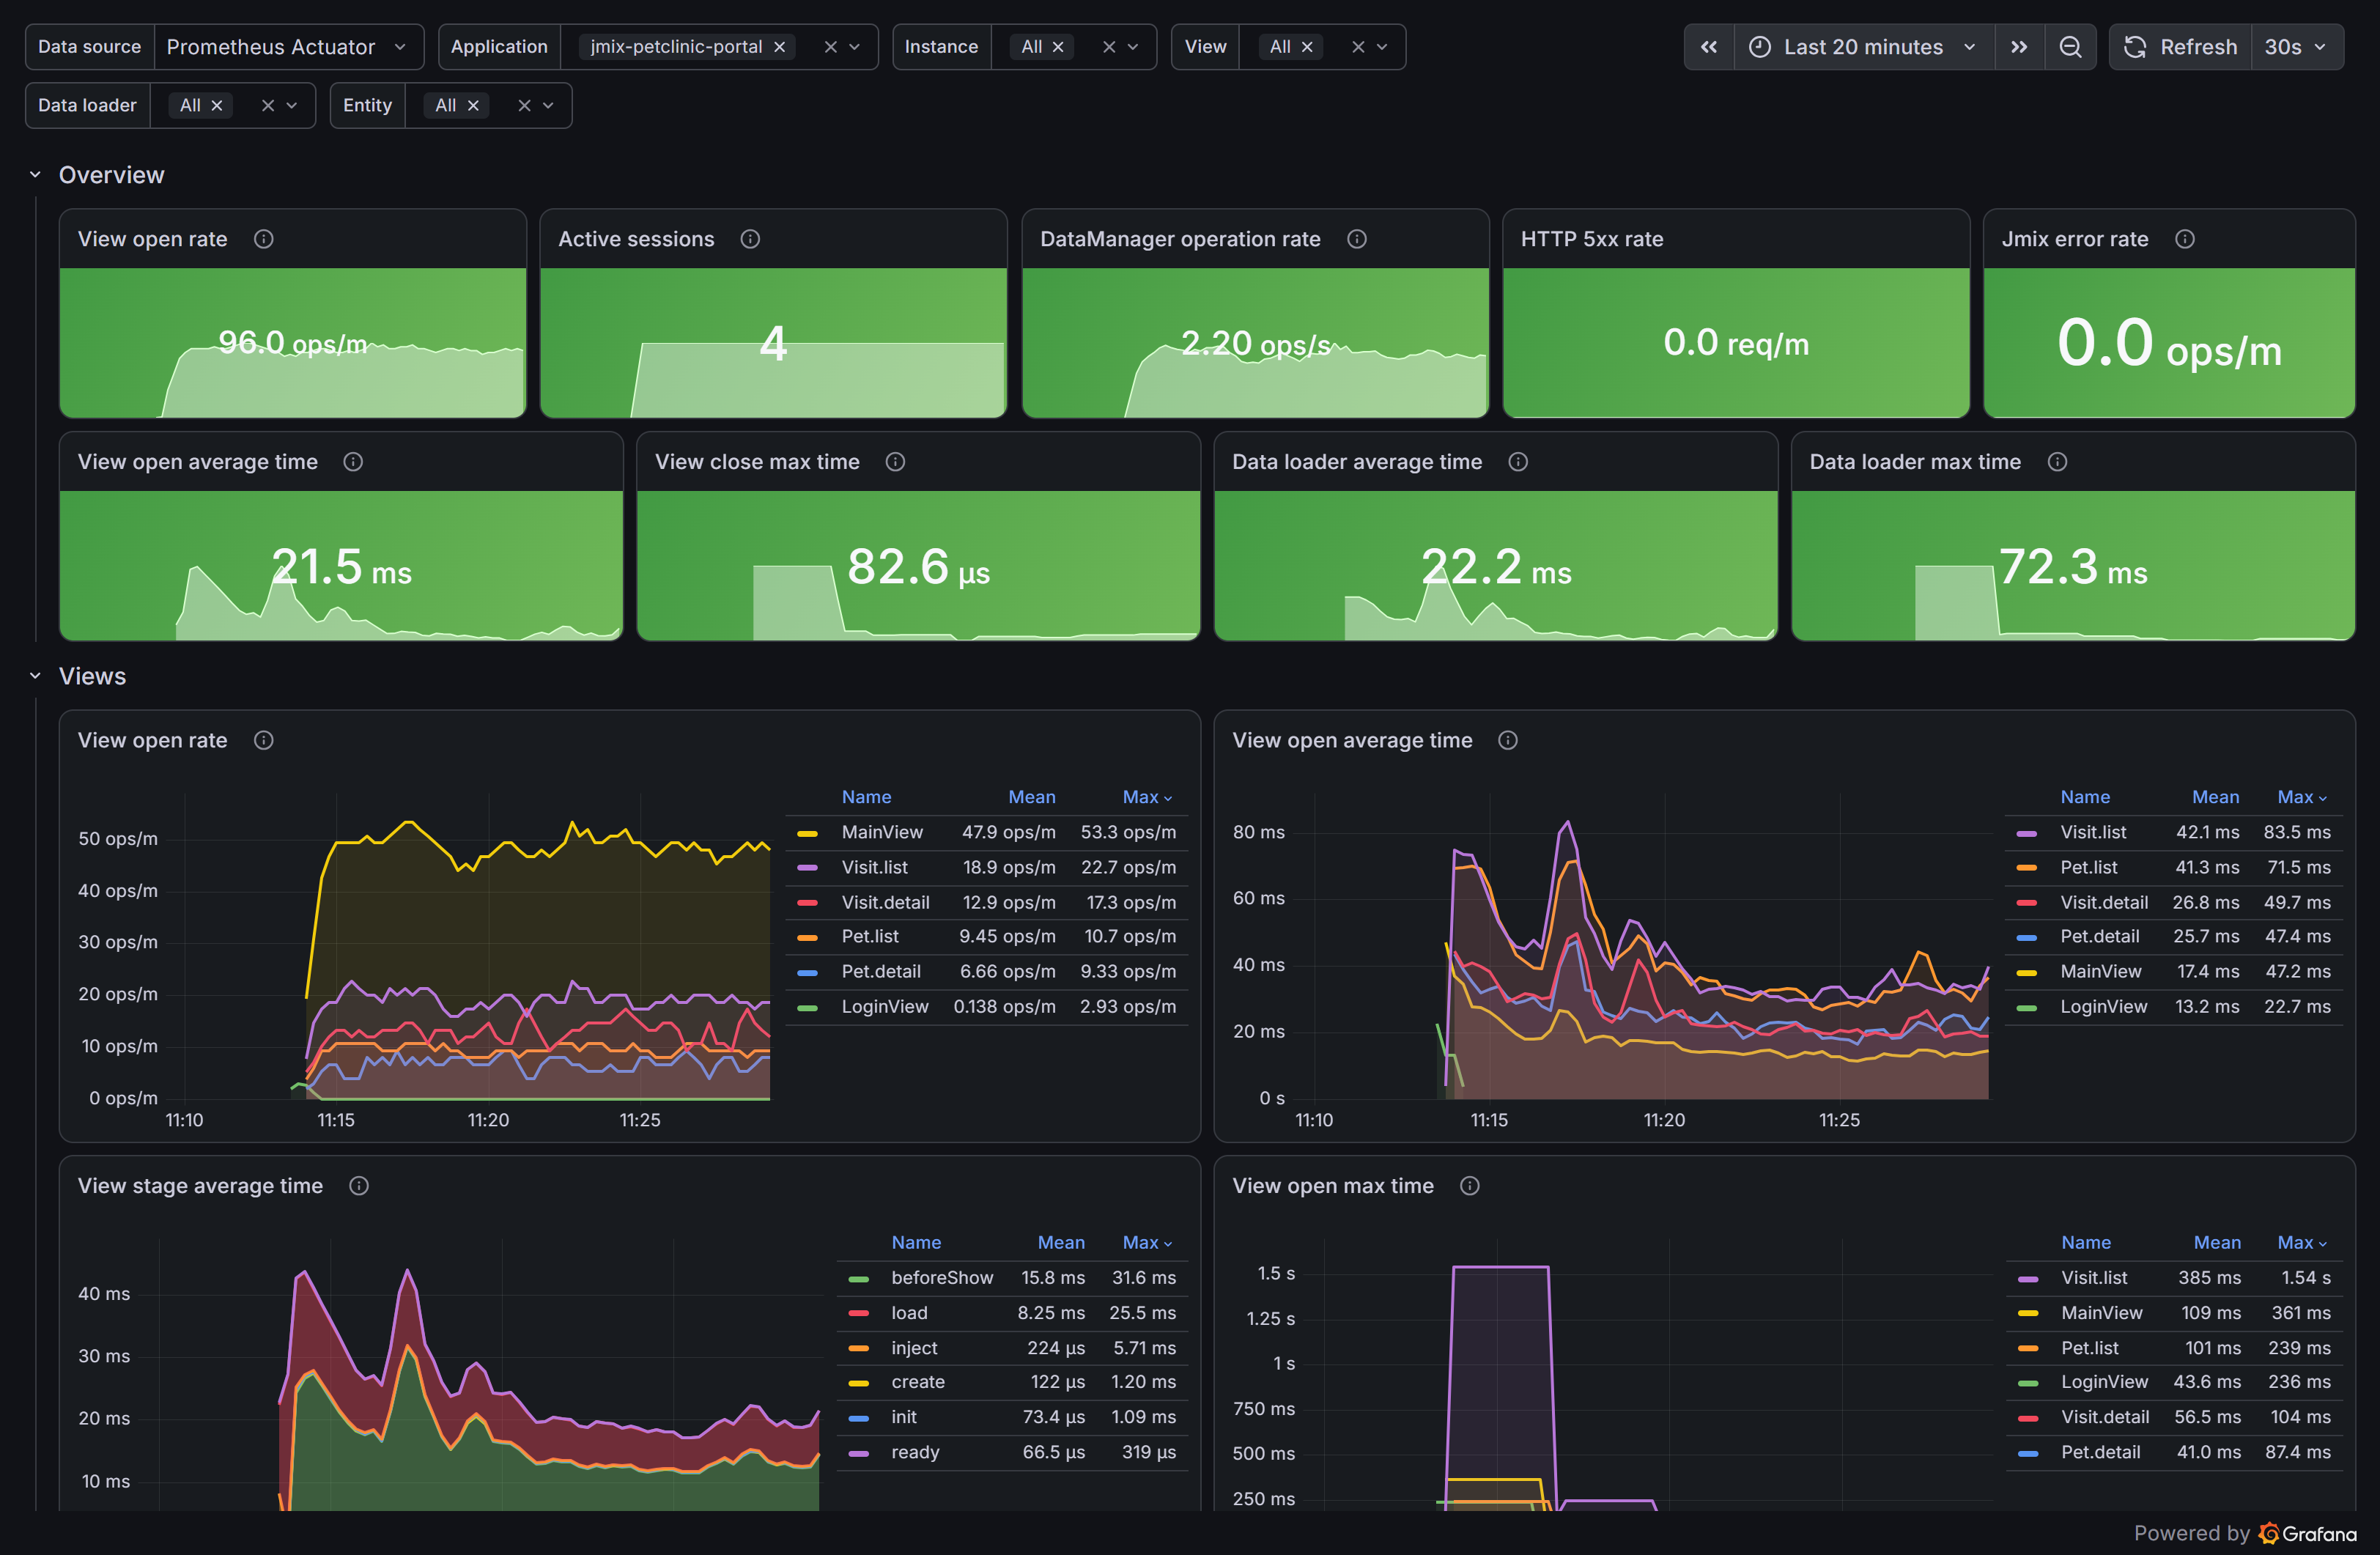
The dashboard sections from top to bottom:
- Overview
-
The current values: view opening rate, active HTTP sessions,
DataManageroperation rate, HTTP 5xx responses, Jmix operations that ended with an error, average view opening time, maximum view closing time, average and maximum data loader time. - Views
-
Opening rate, average and maximum opening time by view, average and maximum time of the lifecycle stages, the views with the highest average opening time, and the closing time.
- Data loaders
-
Average and maximum loading time by loader, loading rate, the loaders with the highest average time, and the time of the loader stages.
- Fragments, Actions
-
Time of the fragment lifecycle stages, rate and time of UI action execution.
- Data access
-
Rate, average and maximum time of loading through
DataManagerby entity, of saving, and the database connection pool. - HTTP and JVM
-
HTTP requests by outcome, CPU usage, heap memory, the share of time spent in garbage collection pauses, threads by state.
- Operations in progress
-
Operations that have started and not finished yet: their number and the duration of the longest one.
Durations are shown as average and maximum values. The maximum is the longest single operation in the last few minutes; it shows rare slow operations that the average hides. The dashboard does not need histograms. The sections are described in detail on the Metrics page.
Finding a Slow View
The following steps use the dashboard to find out where the visit list spends its time. The numbers below come from the Portal dashboard after twenty minutes of work: two browser sessions repeatedly opened the pet and visit lists and their detail views.
-
In the Views section of the dashboard, View open max time shows
Visit.listwith 1.54 s in the first minutes after the application start, while View open average time shows about 40 ms for this view. The maximum is the longest single opening in the last few minutes, so one slow opening stays on the maximum graph for several minutes, while the average hardly changes. -
Select
Visit.listin the View filter at the top of the dashboard. The Views and Data loaders sections now show only this view. -
View stage max time shows that the 1.54 s were spent in the
beforeShowstage; the other stages took a few milliseconds. In Jmix, the data loaders of a view are triggered in thebeforeShowstage by default.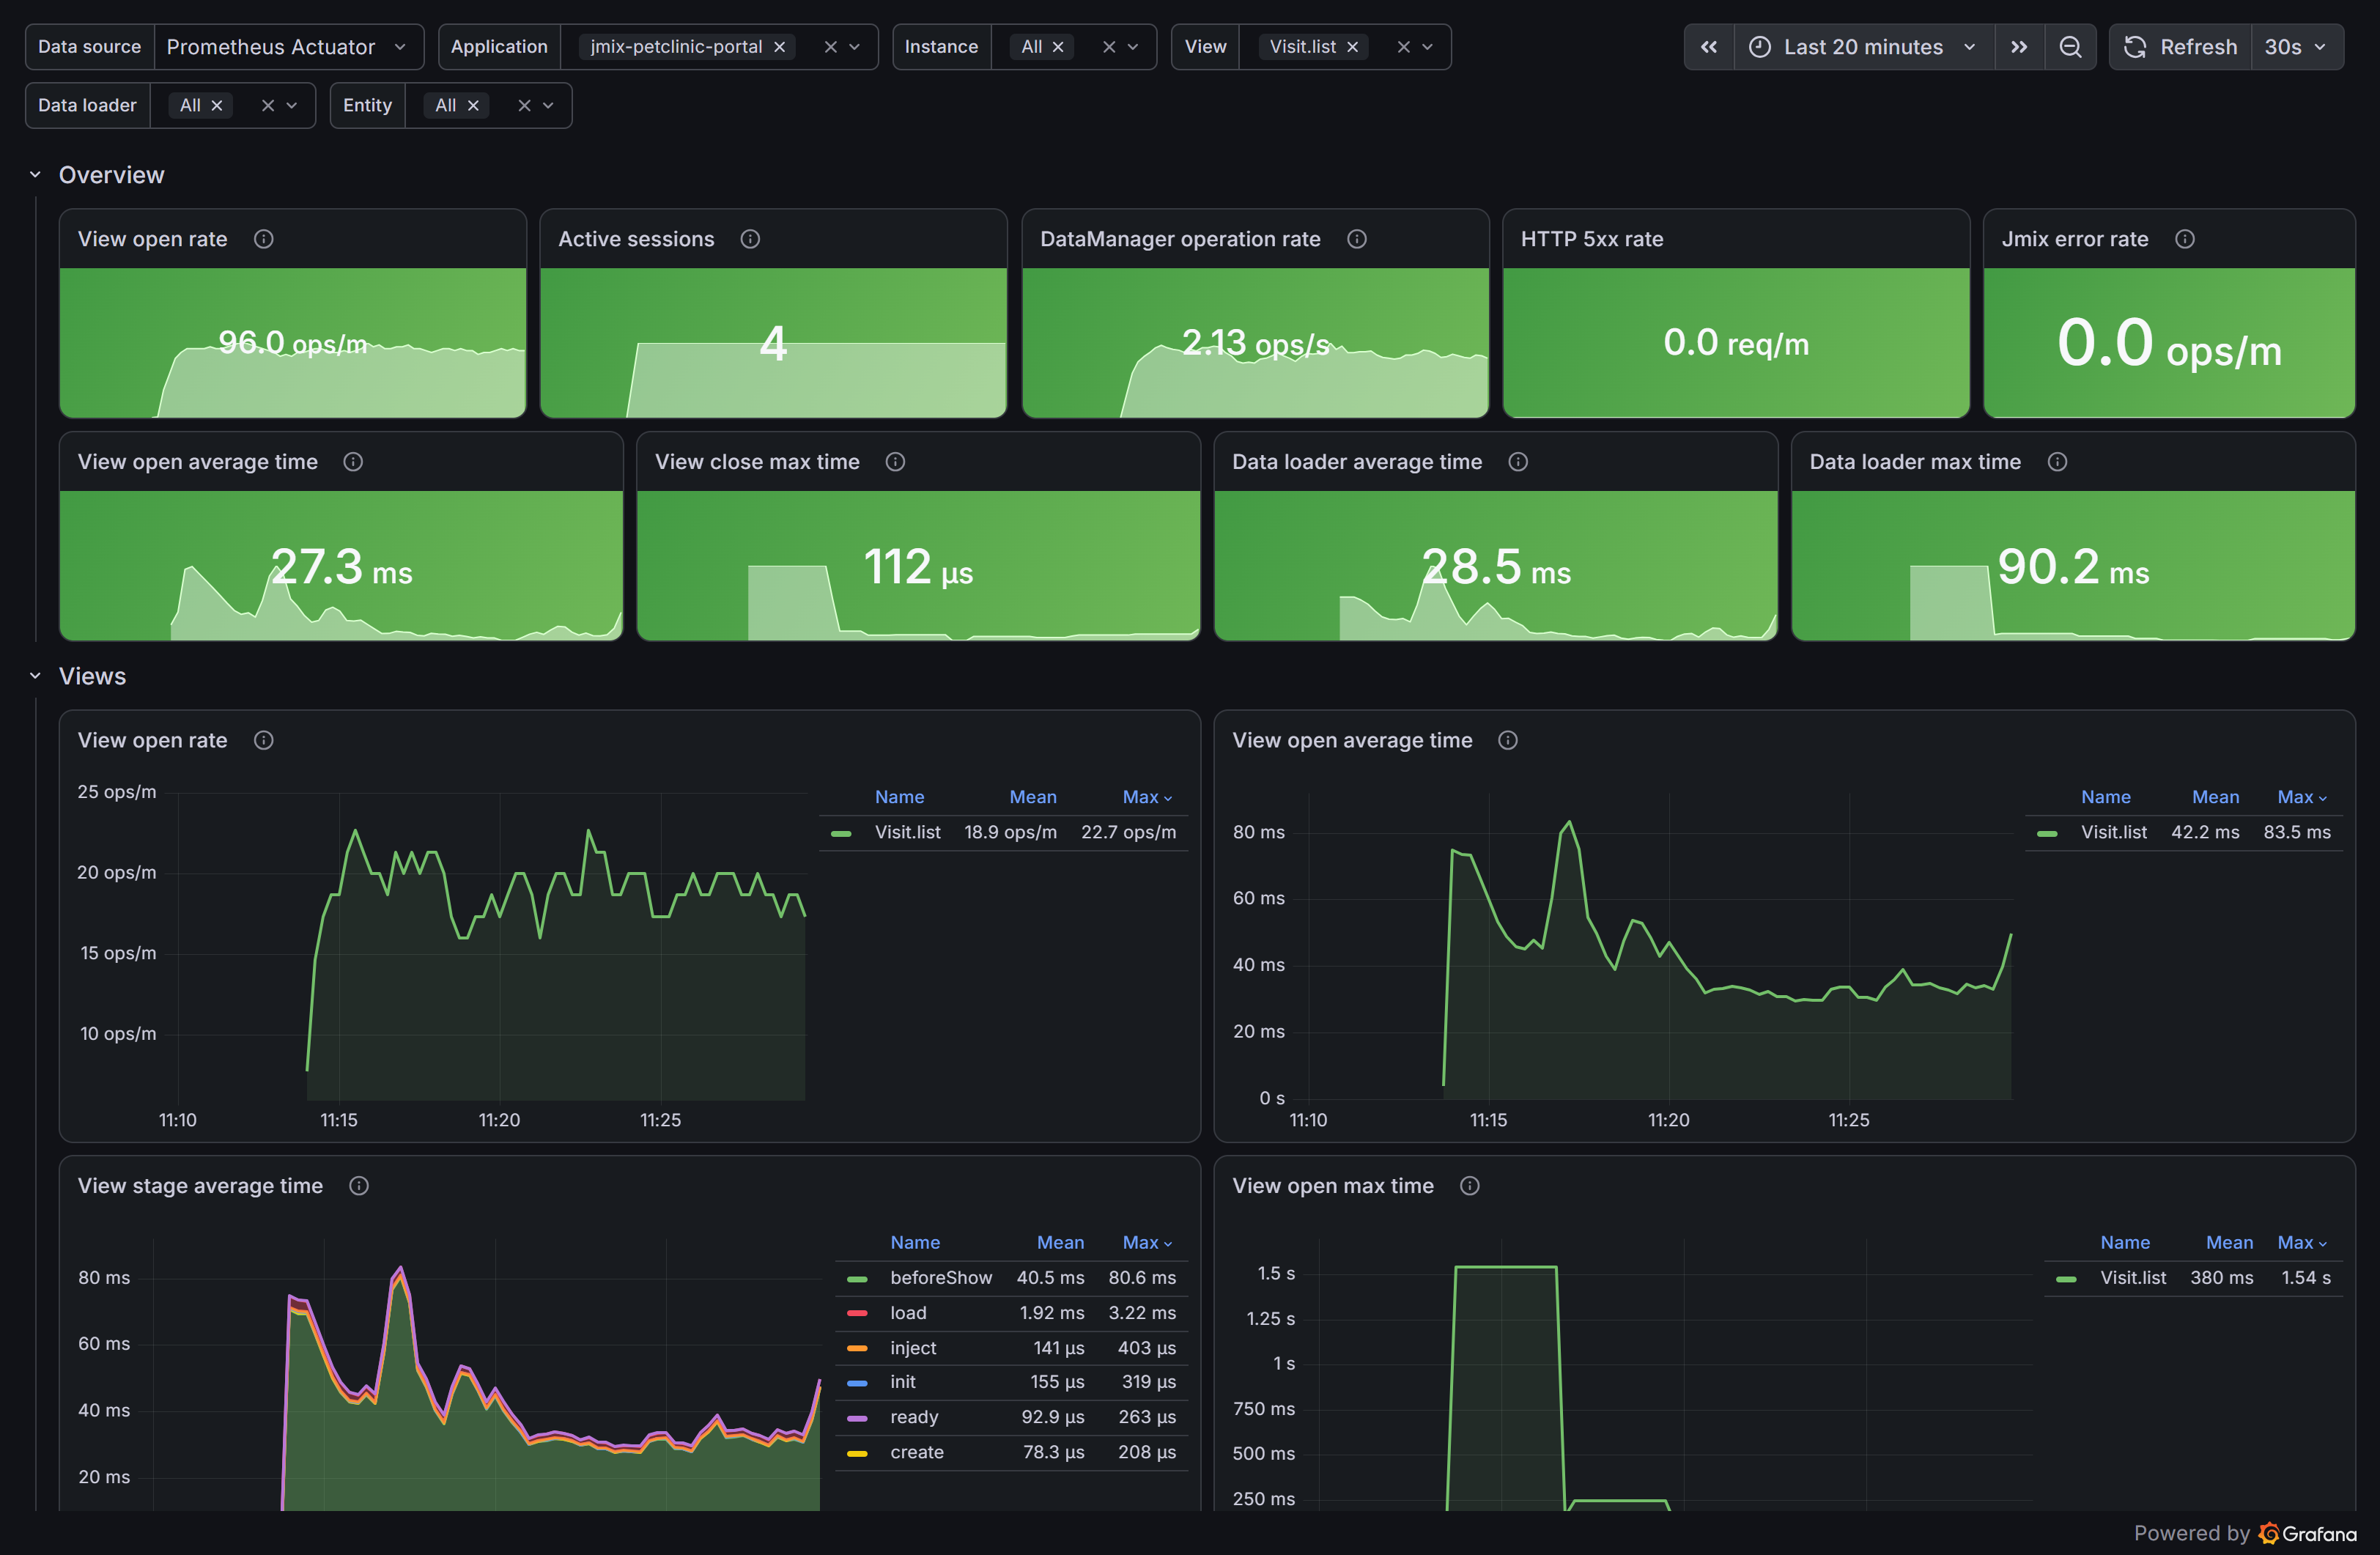 Figure 3. Jmix 3 Monitoring filtered by the Visit.list view: the Views section
-
In the Data loaders section, Data loader max time shows the
visitsDlloader with 1.36 s at the same time, and Data loader stage max time shows that this is theloadstage, the loading itself. ThepreLoadandpostLoadstages, thePreLoadEventandPostLoadEventhandlers of the view, took less than a millisecond. On average,visitsDlloads in about 30 ms.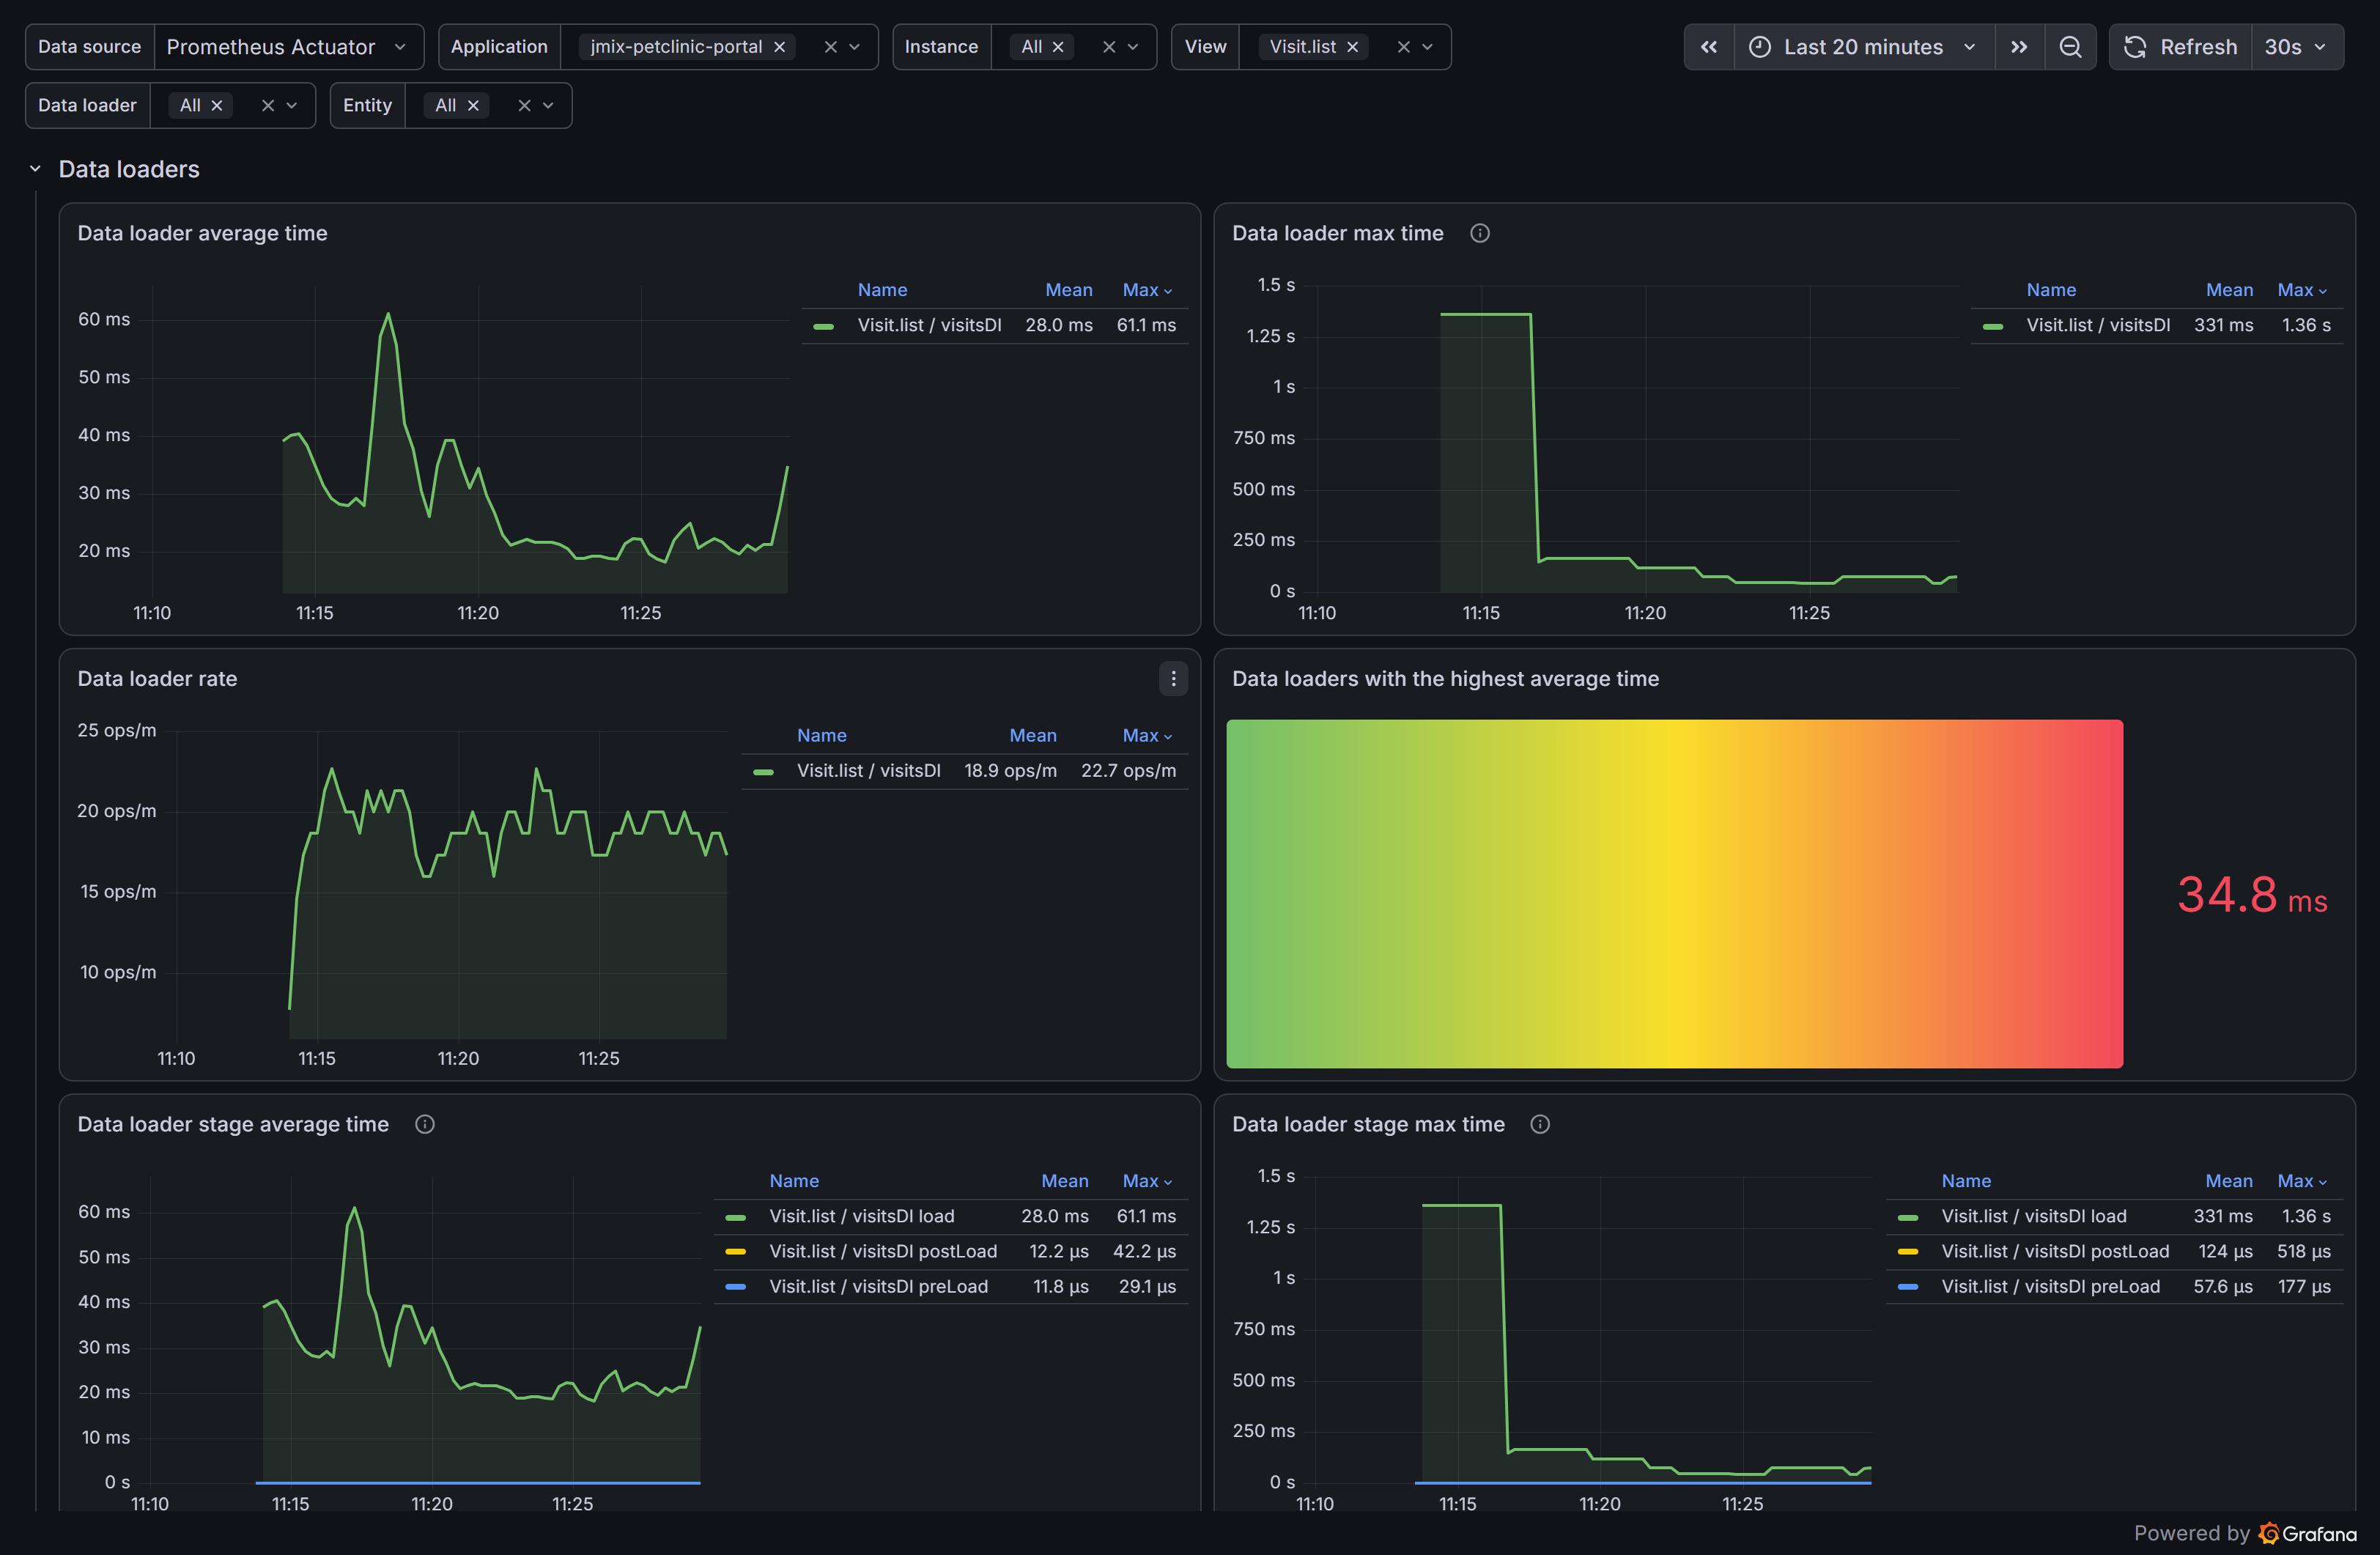 Figure 4. Jmix 3 Monitoring filtered by the Visit.list view: the Data loaders section
The dashboard narrowed the slow opening down to the loading of visits.
Metrics show where the time is spent, but not why. To see what a particular opening of the view consisted of, find its trace. In Explore, select the Tempo data source and run a TraceQL query:
{ name = "view lifecycle" && span.view.id = "Visit.list" && span.lifecycle.name = "beforeShow" && duration > 1s }The trace shows the spans of the data loader, the REST request to the Backend and the entity loading in the Backend, as described in the tracing guide. The stage time that is not covered by child spans is the work of the view itself, for example creating components for each record.
In the trace found for this example, the visitsDl loader took 1.36 s, and the REST request to the Backend took 1.05 s of it. The Backend handled the request in 362 ms, including 123 ms of loading visits. This was the first opening of the view after the start of the Portal: the same request also loaded the user after login. Later openings of the view load visits in about 30 ms, so the maximum shows the start-up of the application rather than a problem of the view.
Alerting
To get notified about a problem without watching the dashboard, create a Grafana alert rule from a dashboard query. For example, an alert fires when the average time of the load stage of any data loader exceeds 500 ms for five minutes:
sum by (application, loader_id) (rate(jmix_ui_data_seconds_sum{lifecycle_name="load"}[5m]))
  /
sum by (application, loader_id) (rate(jmix_ui_data_seconds_count{lifecycle_name="load"}[5m]))
  > 0.5
Rules are created in Alerting → Alert rules → New alert rule: specify the Prometheus Actuator data source, the query, the condition and the pending period, and then a contact point, such as email or a messenger. See the Grafana Alerting documentation.
Before Going to Production
The settings in this guide are intended for local use. For continuous operation in production:
-
Expose only the endpoints you need, for example
management.endpoints.web.exposure.include=health,prometheus, and restrict access to/actuator/**: allow it from the Prometheus network address or require credentials that Prometheus sends. -
Set the metrics retention period in Prometheus with the
--storage.tsdb.retention.timeparameter. -
If the operations in progress are not needed, disable the long task timers of observations with
management.metrics.observations.ignored-meters=long-task-timer.
Other settings for continuous operation are collected in the Observability in Production section.
Troubleshooting
A Prometheus Target Is Down
The error of a target is shown on the http://localhost:9090/targets page.
-
server returned HTTP status 404: the application does not have the Prometheus registry, or theprometheusendpoint is not exposed. -
received unsupported Content-Type "text/html": the security configuration redirects the request to the login page. Permit access to/actuator/**. -
connection refused: the application is not running at this address. For one target of each job, this is expected, see Running Prometheus.
The Application Filter Is Empty
The metrics do not have the application tag. Set management.metrics.tags.application.
Summary
In this guide, we exposed the metrics of the Petclinic Backend and Portal at /actuator/prometheus, ran a Prometheus service that scrapes both applications, and imported the "Jmix 3 Monitoring" dashboard. The Jmix observations enabled for tracing provided the view, data loader, fragment, action and data access metrics without additional code, and the application tag separated the two applications on the dashboard.
The dashboard showed which view opens slowest, which lifecycle stage and data loader take its time, and the trace of a slow opening showed the operations inside that stage.
Further Information
-
Observability: an overview of signals and Jmix features
-
Metrics: all Jmix metrics, their tags, configuration with Spring Boot
-
Performance Diagnostics: investigating slow views, data access, memory and locks