Reference
In this section, we will explore the details of Jmix Maps. We will look at how layers help organize data on a map and explore the sources that provide visual content. We will also explain the concept of geo-object and its practical uses in Jmix Maps.
What is a map?
Jmix Map is a component that displays geographical maps from various sources. It supports multiple layers, which allow effective data structuring and enable the implementation of distinct logic for each layer.
There are two key concepts to understand when working with a map: layers and data sources.
Layer
Layer is a way to organize data on a map.
Layers can be raster or vector. Raster layers consist of raster images, which are a grid of pixels, while vector layers consist of vector geometries.
Raster layers represent the base map. Vector layers are objects on the map that consist of one or more items but are manipulated as a single unit. For example, a vector layer may contain polygons describing districts or geographic points representing locations of customers or shops.
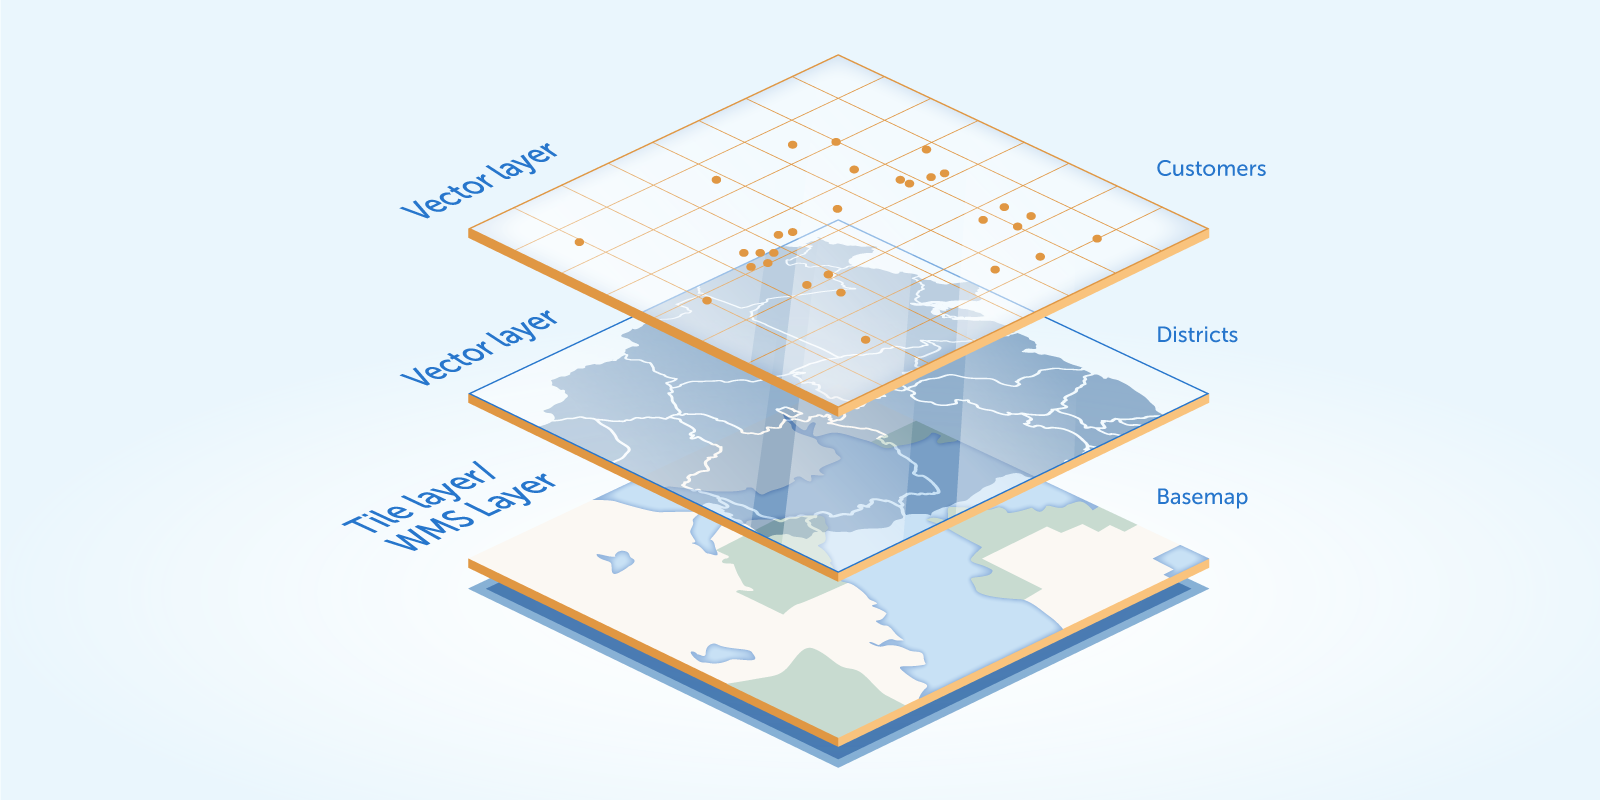
The add-on supports the following types of layers:
-
Tile layer is used to display tiles provided by XYZ tiles services.
-
Image layer is used to work with a static image or a WMS (Web Map Service) image.
-
Vector layer contains geo-objects (entities with geometry attributes).
Layers serve as a sort of wrapper because the displayed data depends on the Source being used.
Data Source
Data source refers to a service where the image comes from. This image is usually served as a base background layer of a map and provides spatial context. You can get images using open source or commercial service providers: XYZ tiles or WMS services.
Projection
Projection refers to the coordinate reference system (CRS) used to represent and transform geographic locations on a map. Projections are essential for accurately displaying spatial data, ensuring that positions on the Earth’s surface are correctly positioned and oriented on the map.
The Maps add-on supports various standard projections like EPSG:4326 (WGS 84 - commonly used for GPS coordinates) and EPSG:3857 (Spherical Mercator - popular for online mapping due to its conformal properties).
The default projection is EPSG:4326.
Data Vector Source
Data vector source is a source containing geo-objects. This source acts as a connector between the data and the map UI component. It carries the data along with some additional information on how the geo-objects should be displayed on a map.
Geo-object
Basically, geo-object is an entity that has a specific property of a geometry type. This property stores specific data to define points, polylines and polygons. Jmix provides data-aware component that acts as a connector between geo-objects and a map.
Coordinates
Coordinate reference systems (CRS) specify every place on Earth by a set of numbers called coordinates. There are two main groups: projected coordinate reference systems (also called Cartesian or rectangular coordinate reference systems) and geographic coordinate reference systems.
A geographic coordinate system uses degrees of latitude and longitude, and sometimes also a height value, to describe a location on the Earth’s surface. The most popular one is called the World Geodetic System - WGS 84 (EPSG:4326). GPS devices use it to define position on Earth.
This is the default coordinate system for all coordinates passed to or received from the Jmix Map component.
| When dealing with EPSG:4326 coordinates in OpenLayers, put the longitude first, and then the latitude. For more detailed information, please refer to the OpenLayers documentation. |
Once map data is projected onto a planar surface, the geographic system (latitude-longitude), which is based on angles measured on a sphere, is no longer valid. Therefore, a Cartesian coordinate system is used. When a user inputs longitude and latitude coordinates into the Jmix Map component, it converts geographic coordinates into projected coordinates in meters used for raster tile generation in GIS and WM(T)S services.
Markers
Markers can be displayed on top of a map to show points of interest, such as addresses, buildings, vehicles, or any other entity. A marker is defined by a coordinate and an icon.
Markers can be configured to show text, which is displayed below the marker icon by default. You can customize the position and style of the text by setting a custom text style for the marker.
