Templates
A report template defines the structure and appearance of a generated report. Its format also determines which output formats are available.
Output Format Compliance Matrix
The matrix below shows the supported template and output format combinations.
| Template / Output | XLSX | XLS | CSV | DOCX | DOC | HTML | |
|---|---|---|---|---|---|---|---|
XLSX |
+ |
+ |
+ 1 |
+ 1 |
|||
XLS |
+ |
+ 1 |
|||||
CSV |
+ |
||||||
DOCX |
+ |
+ 2 |
+ 2 |
||||
DOC |
+ |
+ 1 |
|||||
HTML |
+ |
+ |
|||||
JRXML |
+ |
+ |
+ |
+ |
+ |
+ |
+ |
1 - LibreOffice must be installed for output.
2 - Depending on the jmix.reports.use-office-for-document-conversion application property, the output can be generated with or without LibreOffice. If LibreOffice is not used, you need to provide the required fonts, as described in HTML to PDF.
Adding a Template
To add a report template, open the report detail view and switch to the Templates tab:
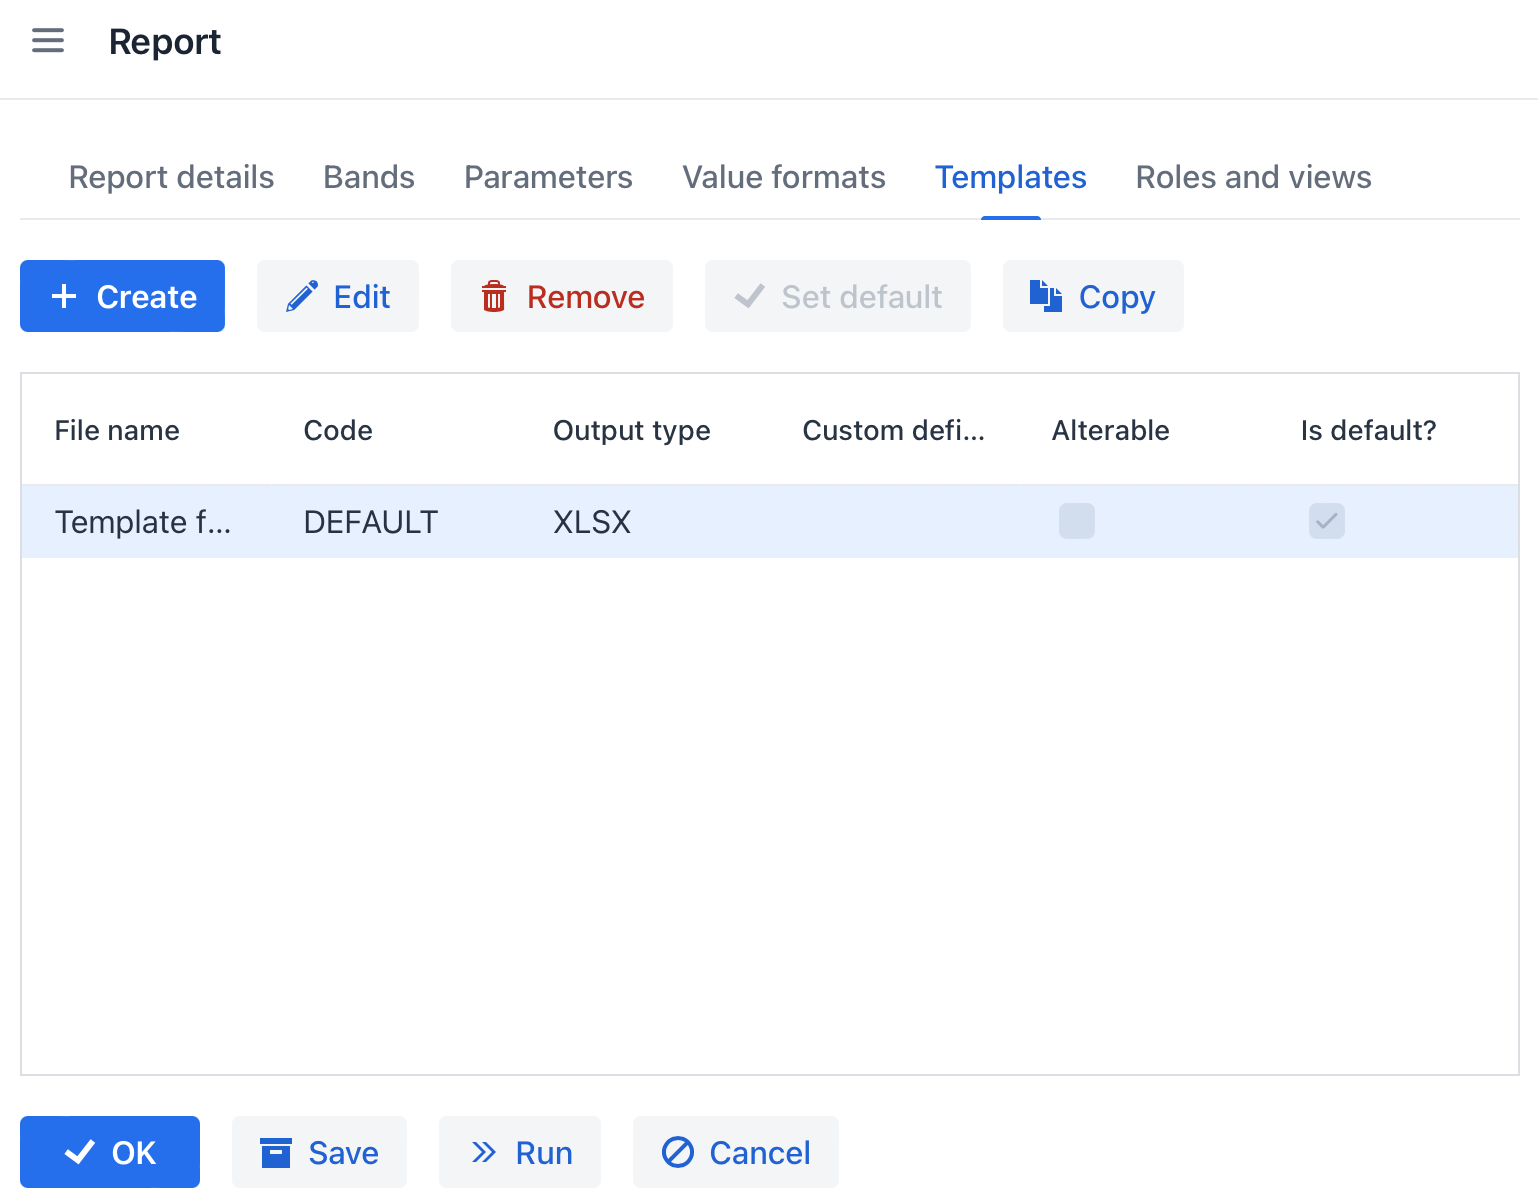
A report can have multiple templates, but one template must be selected as the default.
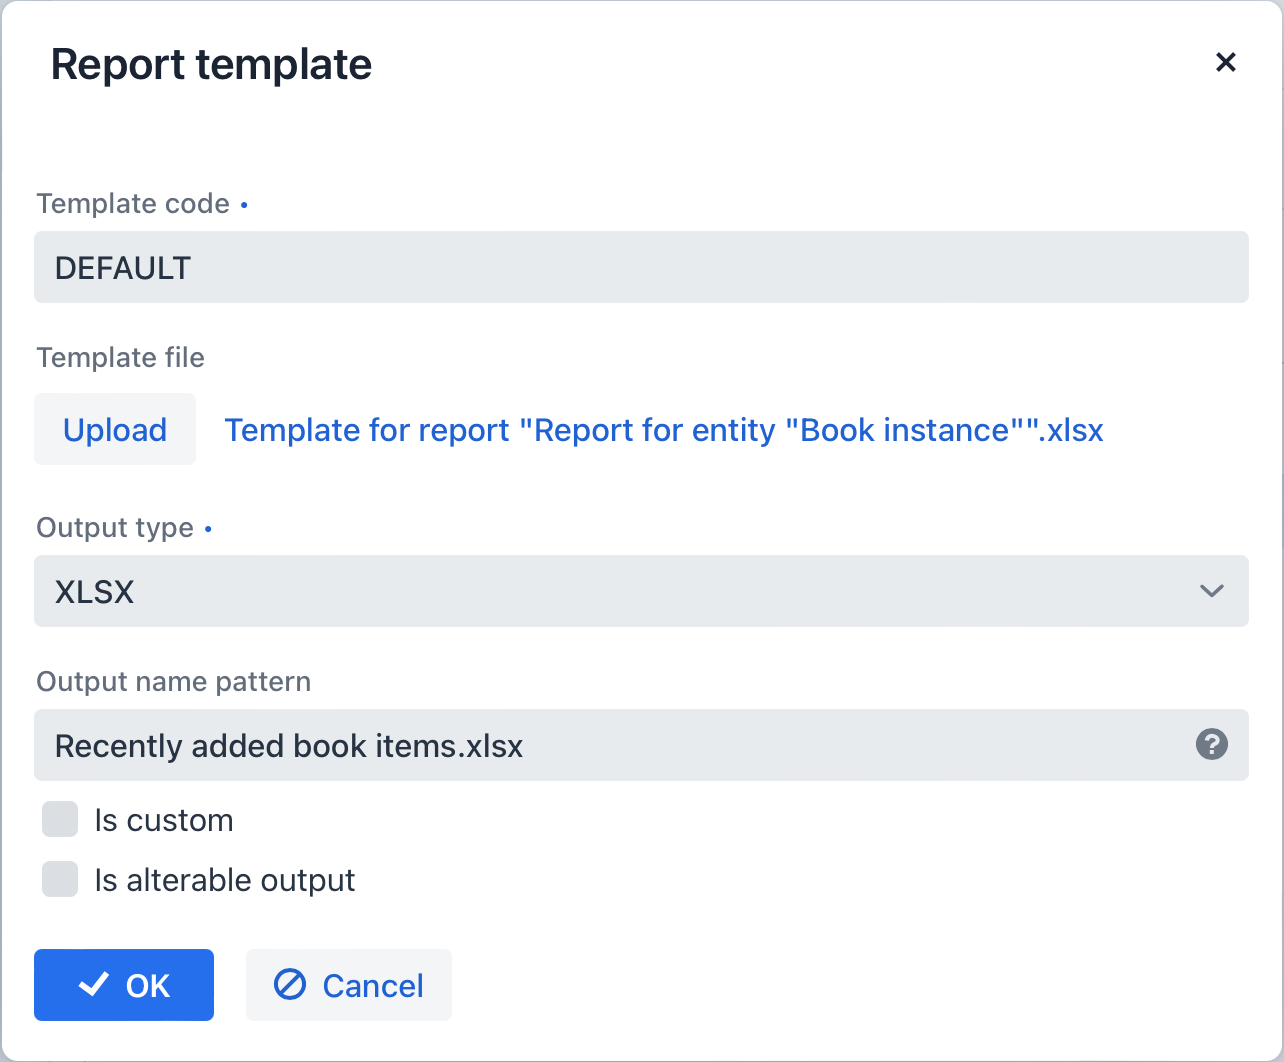
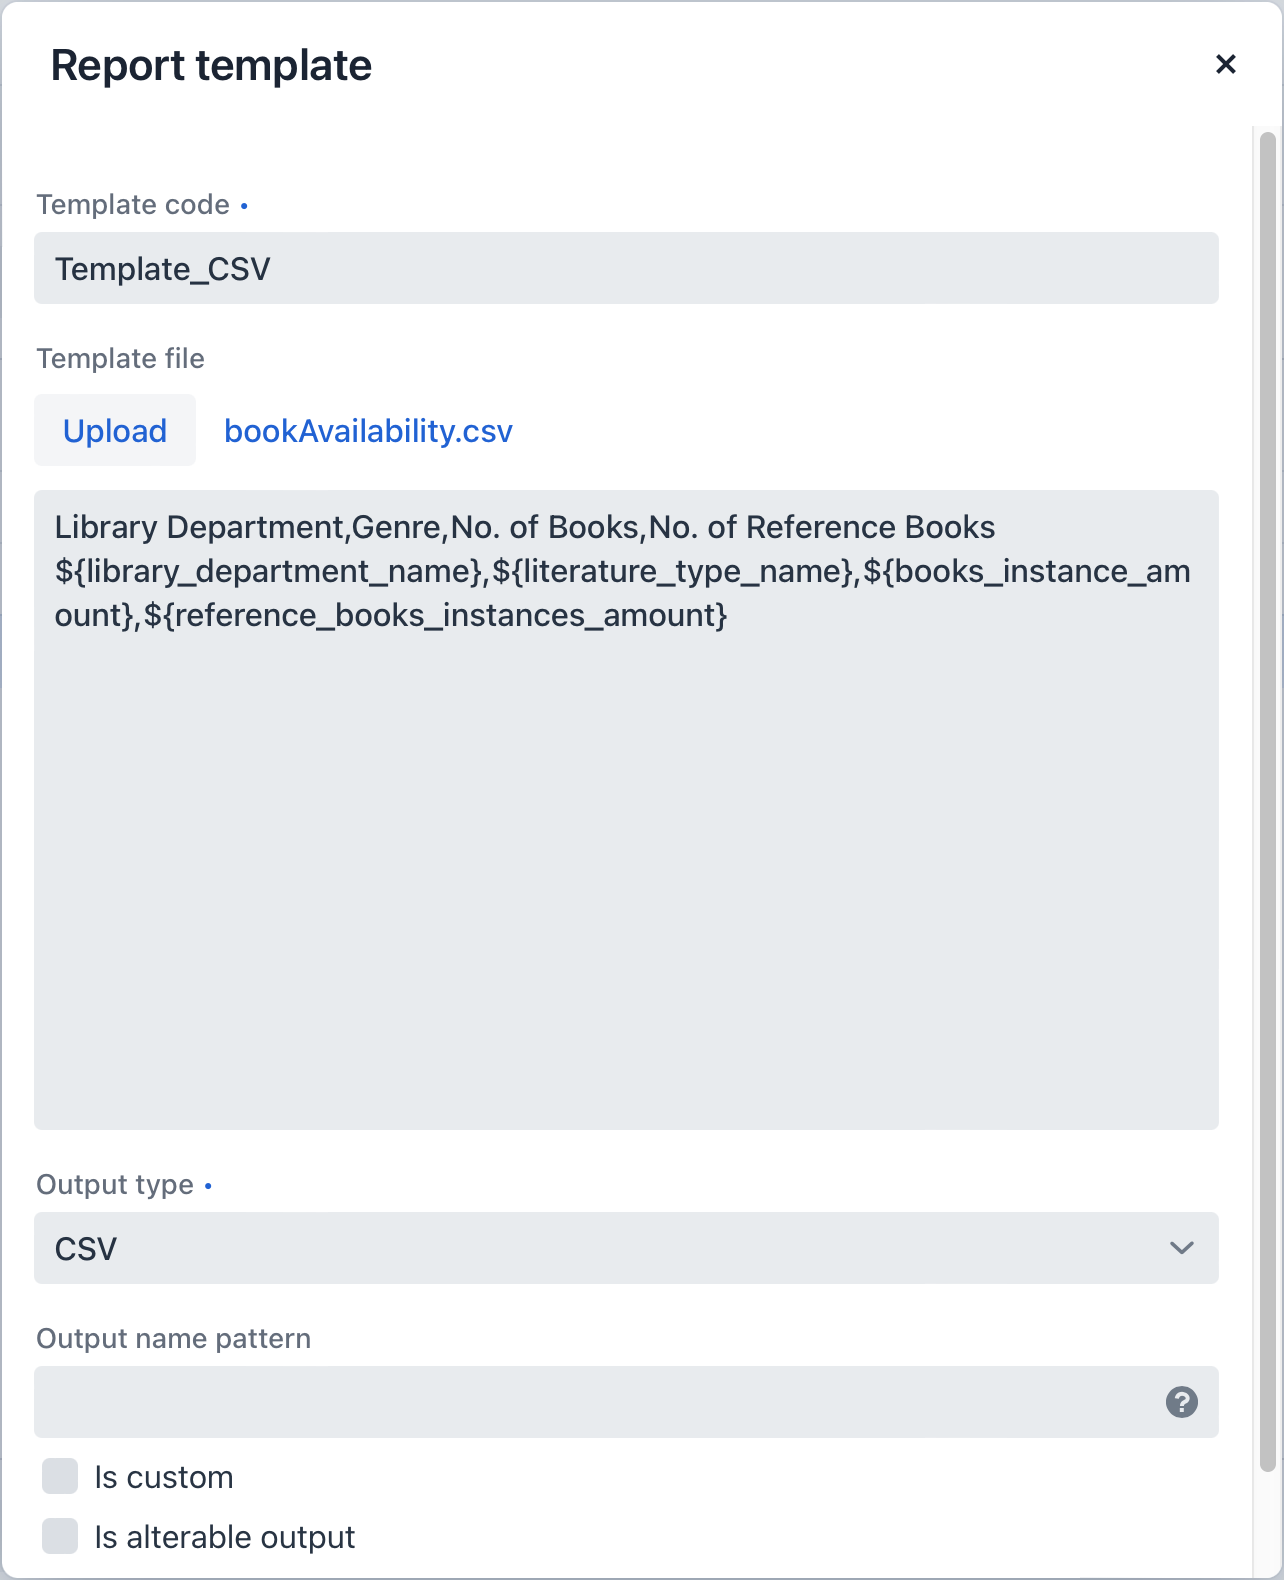
The dialog for adding a template is shown below:
-
Template code - unique template code.
-
Template file - uploaded from the file system and stored in the database together with the report structure description.
-
Output type - report output type. It must be consistent with the template file type according to the rules described in Output Format Compliance Matrix.
-
Output name pattern - optional file name pattern used to generate the output file name. It can be a constant string or contain a report parameter as a variable, for example,
${header.authorName}.xlsx. More complex patterns with multiple parameters and string concatenation can be created as a script in any band of the report structure, for example,${Root.title}.xlsx, wheretitleis produced by the following script:[['title' : ('Report for '+params['author'].firstName+' '+params['author'].lastName)]] -
Is custom - enables custom formatting logic not covered by the built-in formatters. When this option is selected, two additional fields become available:
-
Defined by - how the custom template is defined: by class, script, or URL.
-
Custom definition - fully qualified Java class name, Groovy script content, or URL used to create the template. If you select Script, the following parameters are available in the Groovy script:
-
params- map of report parameters, available asparams. -
rootBand-BandDataobject that provides access to band datasets. -
applicationContext-ApplicationContextobject that provides access to managed beans.
-
-
-
Is alterable output - lets the user choose the report output type at runtime in a dialog window.
If enabled, a dialog for selecting the output type is shown when the report is run. If the report has more than one template, a template selection field is shown as well.
-
Is default - marks the template as the default for the report. The default template is used unless the user explicitly selects another one.
Template Types
| You can find examples of various template types in the Report Generation guide. |
XLS(X) Templates
You can create XLS(X) templates in Microsoft Office or LibreOffice.
Each report band must have a corresponding named region in the template. The region name must match the band name. For example, if a report has Header and Data bands, the template must also contain Header and Data named ranges. To create named regions, select the required cell ranges and enter the name in the field in the upper-left corner of the application window. To edit existing named regions, use Formulas → Name Manager in Microsoft Office, or Insert → Names → Manage in LibreOffice. Every visible part of the sheet should correspond to a report band, at least an empty one.
The bands are output in the order specified in the band hierarchy.
Bands can be horizontal or vertical. Horizontal bands expand downward; vertical bands expand to the right. Horizontal bands can be organized in a tree structure and contain child bands. For child bands, create named regions directly below the regions that correspond to the parent bands.
The XLSX formatter renders child bands using the following algorithm:
-
Write the first row of parent band →
-
Write all first row’s children rows →
-
Write the next row of parent band.
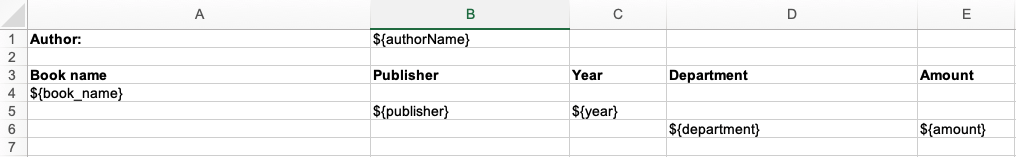
Place band dataset fields in the template using the ${field_name} syntax, where field_name is the corresponding band field name. For example:
You can also add variables to the template. Use the ${<BandName>.<variableName>} syntax in sheet names or in XLSX headers and footers.
Cells may contain formatting and multiple fields. To output images or formulas, place them entirely inside the corresponding named region linked to the band.
Formulas can reference cells in the same band or in another band. To be processed by the formatter, a formula should use either a cell range within the band or direct cell coordinates, for example, (A1*B1) or ($B:$B).
To process data as an Excel chart, create an empty band in the report structure and a named region with the same name in the template. Then create a chart inside this named region and refer to related bands using the Select data button in the chart context menu. If chart data is in a continuous cell range, select any cell in that range. If it is not continuous, select nonadjacent cells or ranges.
|
Enabling row auto-height in XLSX templates To activate automatic row height calculation in manually created XLSX templates, you should define a named region that starts with For XLSX reports generated using the report wizard, this named region is automatically added for each configured report region. When a report is executed, a cell whose content exceeds the available space for a single line will automatically become multi-line, with the row height adjusting accordingly to display the entire content. |
|
Converting XLSX to PDF and CSV XLSX reports can be automatically converted to CSV and PDF. LibreOffice must be installed for PDF conversion. |
CSV Templates
You can create CSV templates in Microsoft Office or LibreOffice.
Bands in a CSV template must be horizontal, so the named region expands downward. They must also belong to the first level of data, that is, be children of the Root band. In all other respects, the same principles apply as for XLS(X) templates.
Inline editor
CSV templates support inline editing. You can edit the template directly in the Report template dialog and see the changes without re-uploading the file.
DOC(X) Templates
You can create DOC(X) templates in Microsoft Office or LibreOffice.
A DOC(X) template can include document text and, optionally, one or more tables. Document text outputs data from the first rows of arbitrary bands. Tables can output any number of band rows.
To place a field in the document text, use a string in the ${band_name.field_name} format, where band_name is the band name and field_name is the name of a band field.
To output data into a table, link the table to a band by specifying ##band=band_name in the first cell, where band_name is the band name. Use the ${field_name} syntax for table fields, where field_name is the field name of the band associated with the table. As in document text fields, you can use the band name prefix to access fields of other bands. A single table cell can contain multiple fields.
Horizontal bands in DOC(X) cannot contain sub-bands. If you need sub-bands, use XLS(X) format.
|
The table must contain either one or two rows. If the table has two rows, then the corresponding band fields must be in the second row. The first row should contain the marker with the corresponding band name and, if necessary, a static text or other band fields. |
The following example shows a template for a report with two bands, Book and Authors. The first band outputs the book name and genre, and the second outputs the list of authors.
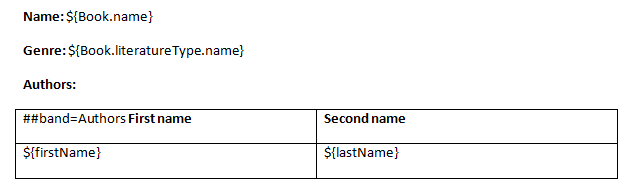
|
Cell data formats are not supported in DOC(X) templates. To avoid locale-related formatting issues for numbers or dates, such as unwanted numeric separators, cast the values to strings. For example: into |
|
Processing Multi-line Strings in DOCX Templates By default, line breaks in parameter values are ignored when generating a report. To preserve line breaks (e.g., This feature is exclusive to the DOCX report output format and has no effect on other formats like XLSX or PDF. |
HTML Template
An HTML template is stored in an .html file encoded in UTF-8 without a BOM. You can use HTML and CSS features supported by the Flying Saucer library. Its main guide is available on the project page.
To control page size, page headers and footers, use special CSS rules and properties.
There are two ways to place data in an HTML template:
-
Using FreeMarker tags.
-
Using Groovy templating engine.
By default, the Report wizard generates an HTML template with FreeMarker tags.
Use the Template type radio button in the report template dialog to switch between these methods.
HTML templates support inline editing. You can edit the template directly in the Report template dialog and see the changes without re-uploading the file.
- Groovy templating engine
-
You can preprocess the HTML template as a Groovy template. It is processed by GStringTemplateEngine.
The template engine uses JSP-style
<% %>script and<%= %>expression syntax, as well asGString-style expressions. Theoutvariable is bound to the writer used to produce the template output.GStringTemplateEnginehas access to:-
external parameters:
BandName.fields.ParamName; -
bands:
BandName.bands.ChildBandName; -
fields:
BandName.fields.FieldName.
You may use variables for convenience, for example:
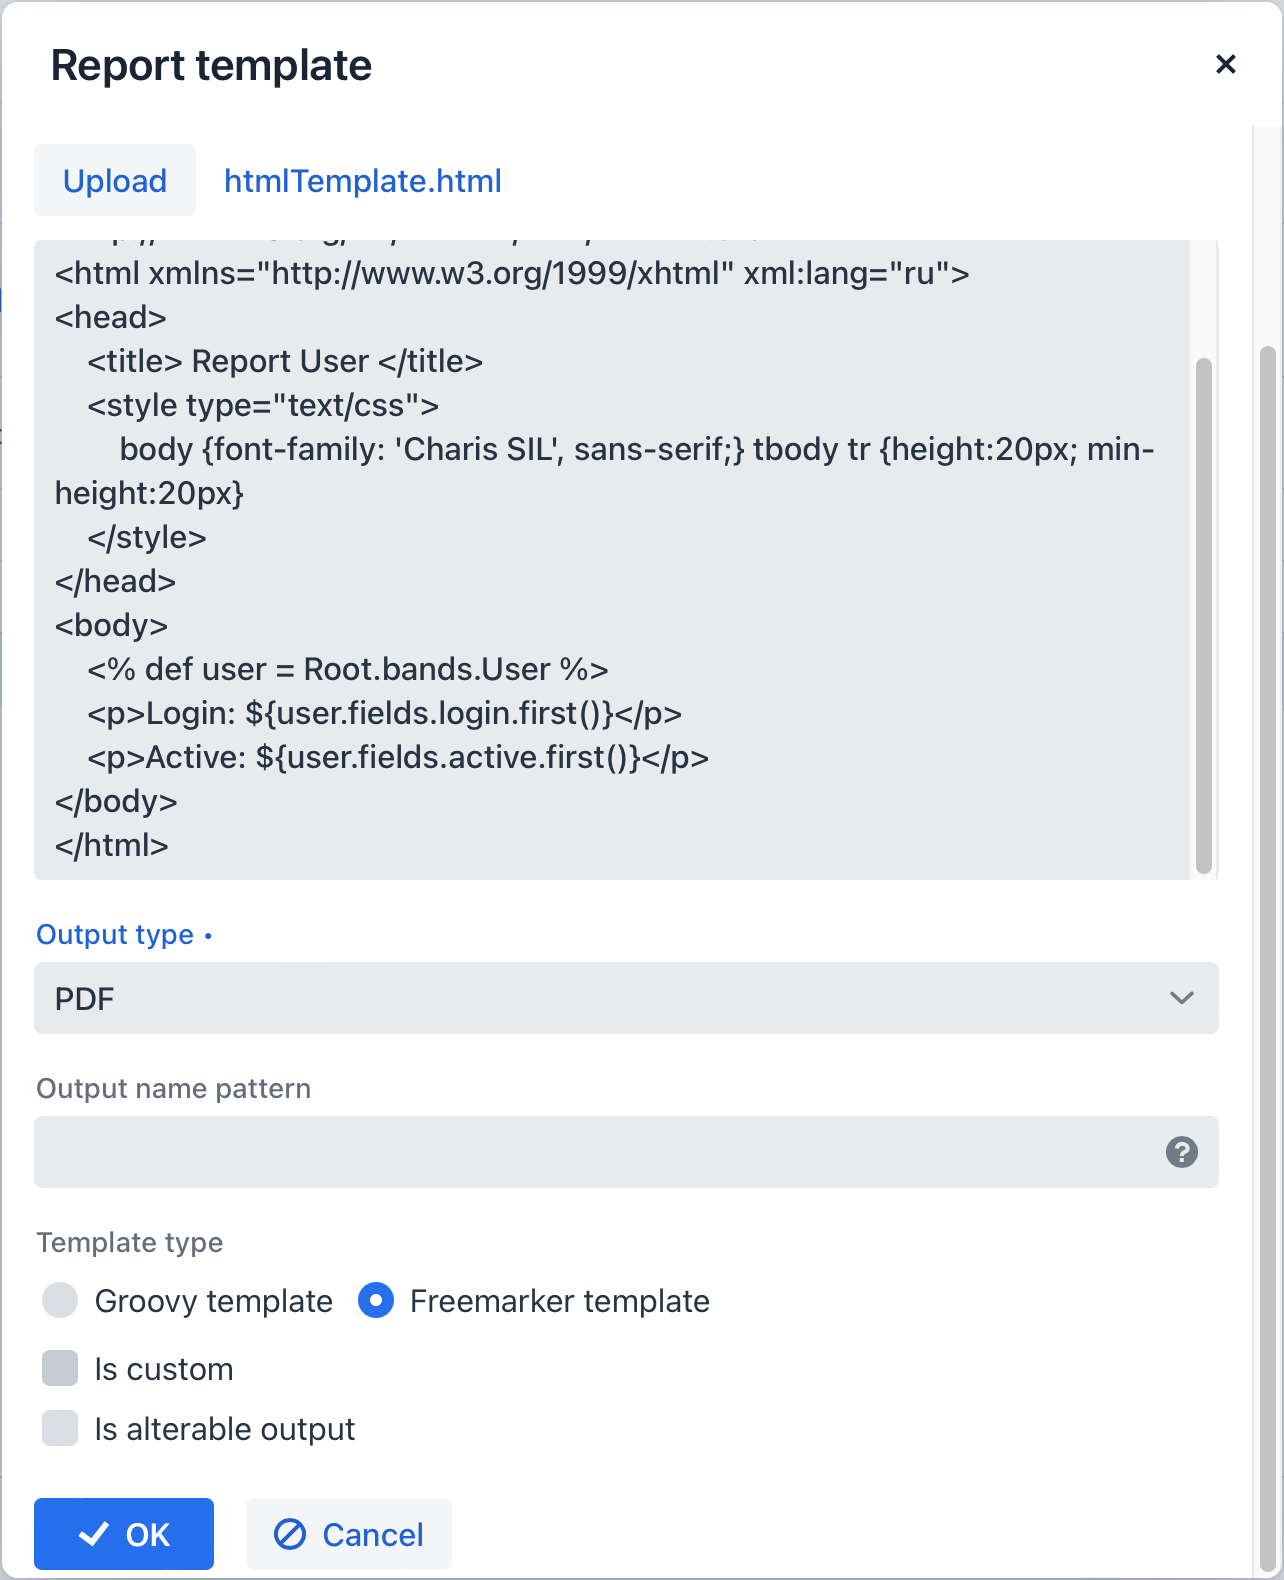
<% def headerRow = Root.bands.HeaderRow %>
<p>Date: ${headerRow.fields.reportDate}</p>
Below is an example of a template that outputs a report for a single user.
<?xml version="1.0" encoding="utf-8"?> <!DOCTYPE html PUBLIC "-//W3C//DTD XHTML 1.1//EN" "http://www.w3.org/TR/xhtml11/DTD/xhtml11.dtd"> <html xmlns="http://www.w3.org/1999/xhtml" xml:lang="ru"> <head> <title> Report User </title> <style type="text/css"> body {font-family: 'Charis SIL', sans-serif;} tbody tr {height:20px; min-height:20px} </style> </head> <body> <% def user = Root.bands.User %> <p>Login: ${user.fields.login.first()}</p> <p>Active: ${user.fields.active.first()}</p> </body> </html> -
- FreeMarker
-
FreeMarker documentation is available at freemarker.apache.org.
The FreeMarker document model has the following structure:
Band {
      bands [ bandName : [ band, .. ], .. ]
      fields [ fieldName : fieldValue, .. ]
}
For example, you should use the following expression to access the
namefield in a row having index 0 of thebandband:Root.bands.band[0].fields.nameYou may use variables for convenience, for example:
<#assign headerRow = Root.bands.Header[0]>
<p>Date: ${headerRow.fields.reportDate}</p>
You can also use
getMessage()to get localized values:getMessage()accepts one or two arguments. If one argument is provided, it returns a value from the message bundle. If two arguments are provided, it returns a localized message from the bundle using the arguments as the group and key.${getMessage(order.status)}Below is an example of a template that outputs a report consisting of two bands,
BookandAuthors. The first band outputs a book name and genre, and the second outputs a list of authors of this book.<!doctype html> <html> <head></head> <body> <#assign book = Root.bands.Book[0] /> <#assign authors = Root.bands.Authors /> <p>Name: ${book.fields.name}</p> <p>Genre: ${book.fields.literatureType.name}</p> <table border="1" cellpadding="5" cellspacing="0" width="200"> <thead> <tr> <td>First name</td> <td>Last name</td> </tr> </thead> <tbody> <#list authors as author> <tr> <td>${author.fields.firstName}</td> <td>${author.fields.lastName}</td> </tr> </#list> </tbody> </table> </body> </html>Below is a more complex example. Let’s assume we have the following bands structure:
Root { HeaderBand { query = return [[ "name" : "Column1" ],[ "name" : "Column2" ]] } Band1 { query = return [ ["field1" : "Value 11", "field2" : "Value 12"], ["field1" : "Value 21" , "field2" : "Value 22"] ] } Band2 { query = return [[ "header" : "Header1" ], [ "header" : "Header2" ]] SubBand1 { query = return [["header" : 'SubHeader1'] , [ "header" : 'SubHeader2' ]] } } }-
Inserting a field:
<!doctype html> <html> <head> <title> Simple template </title> </head> <body> <#assign Tree1 = Root.bands.Band2> <h1> Header </h1> <p> ${Tree1[1].bands.SubBand1[0].fields.header} </p> </body> </html>-
Inserting a list:
<!doctype html> <html> <head> <title> List </title> </head> <body> <#assign Table1Header = Root.bands.HeaderBand> <#if Table1Header?has_content> <ol> <#list Table1Header as header> <li> ${header.fields.name} </li> </#list> </ol> </#if> </body> </html>-
Inserting a table:
<!doctype html> <html> <head> <title> Table </title> </head> <body> <#assign Table1Header = Root.bands.HeaderBand> <#assign Table1 = Root.bands.Band1> <table border="1" cellpadding="5" cellspacing="0" width="200"> <thead> <tr> <#list Table1Header as header> <td> ${header.fields.name} </td> </#list> </tr> </thead> <tbody> <#list Table1 as row> <tr> <td> ${row.fields.field1} </td> <td> ${row.fields.field2} </td> </tr> </#list> </tbody> </table> </body> </html>-
Inserting a multi-level list:
<!doctype html> <html> <head> <title> Multi-level list </title> </head> <body> <#assign Tree1 = Root.bands.Band2> <ul> <#list Tree1 as item> <li> <h2> ${item.fields.header} </h2> <#if item.bands.SubBand1?has_content> <ul> <#list item.bands.SubBand1 as subitem> <li> <h3> ${subitem.fields.header} </h3> </li> </#list> </ul> </#if> </li> </#list> </ul> </body> </html> -
- Embedded pictures
-
At the moment, the Jmix Reports add-on does not provide the same image insertion mechanisms for HTML reports as for DOCX or XLSX reports. However, you can still embed images using the
imgtag and the image location in thesrcattribute. Images can be added to an HTML report in the following ways.-
By URL
An image can be served statically by the application. For example, the image hosted in the
build\resources\static\images\folder can be inserted like:<img src="http://localhost:8080/images/SomeImage.jpg" height="68" width="199" border="0" align="right"/> -
By bitmap
An image is added as a byte array within the
srcattribute. This approach allows you to use variables for theFileRefattributes of the entities. The byte array can even be added directly to the template, even though this approach is not recommended:<img alt="SomePicture.png" src="data:image/png;base64,iVBORw0K ..... AcEP9PwxD0hNKK1FCAAAAAElFTkSuQmCC"/>You can also insert an image stored in the database as a byte array (
byte[]) into an HTML report. To do this, use a Groovy script in the value format settings to convert thebyte[]into aBase64 Data URLstring.-
In the report structure, select the desired band, for example,
User. -
Within this band, create or ensure that there is a parameter named
picture. This parameter will receivebyte[]data from the database (from the entity’spicturefield). -
In the report structure, navigate to the Value Formats tab.
-
Create a new format:
-
Name:
picture- this must match the parameter name from step 2. -
Select Groovy script checkbox.
-
Groovy script:
import java.util.Base64

if (value) {
    return "data:image/png;base64," + Base64.getEncoder().encodeToString(value)
} else {
    return "";
}
-
-
In your report HTML template, reference the generated value like this:
<img src="${User[0].fields('picture')}" alt="picture"/>
-
-
By custom prefixes:
-
You can use the
resource://prefix to refer to image files in theconfdirectory or on the classpath. This works only for HTML templates rendered to PDF. For example, the imageabc.jpgstored in theresource\com\company\app\imagesfolder can be inserted as follows:<img src="resource://com/company/app/images/abc.jpg" height="68" width="199" border="0" align="right"/> -
The
fs://prefix allows you to insert an image by specifying aFileRef. For example:<img src="fs://2025/07/08/78c65527-9cb7-ee77-940f-86e31b214f49.jpeg?name=filename.jpeg" height="68" width="199" border="0" align="right"/>The query parameter ?name={original_filename}.{ext}is mandatory. The system relies on this parameter to correctly parse the string and reconstruct theFileRefobject.
-
-
- Converting HTML to PDF
-
Reports that use an HTML template and PDF output do not always display fonts correctly. To resolve this, add a
jmix/fontssubdirectory containing the required.ttffonts to the Jmix configuration directory (${user.dir}/.jmix/conf/by default). You can also use operating system fonts by specifying their path in the jmix.reports.pdf-fonts-directory application property.
In order to resolve the fonts issue on an Ubuntu server, you should do the following:
-
Install the
ttf-mscorefonts-installerpackage:$ sudo apt-get install ttf-mscorefonts-installer
-
Set the jmix.reports.pdf-fonts-directory application property:
jmix.reports.pdf-fonts-directory = /usr/share/fonts/truetype/msttcorefonts
-
Explicitly specify fonts in HTML templates, for example:
<html>
<head>
    <style type="text/css">
        * {
            font-family: Times New Roman;
        }
    </style>
To avoid errors when converting HTML to PDF, wrap field values in <![CDATA[ ]]> in the HTML template:
<tr>
	<td> <![CDATA[${(row.fields('book_name'))!?string!}]]> </td>
	<td> <![CDATA[${(row.fields('author'))!?string!}]]> </td>
</tr>
JasperReports Template
The JasperReports formatter allows you to use JasperReports templates to output data extracted by Jmix reporting. The template is processed by the report engine and generates output of the configured type. See Output Format Compliance Matrix.
To use JasperReports templates, add net.sf.jasperreports:* dependencies manually as described in the Installation section.
|
You can create JRXML templates using JasperReports tools (for example, Jaspersoft Studio) or in a simple text editor. Each report band defined in the report structure must have a corresponding band element in the template which is, in turn, placed within one of the standard JasperReports report sections (which are also named as the bands in JasperReports terms): title, pageHeader, columnHeader, detail, etc.
The report engine puts all band data into a single datasource, JRBandDataDataSource, which contains data as a tree with the Root band as the root. It also passes the CubaJRFunction instance to the template as the main data source, accessible through the REPORTING parameter. Declaring this parameter in the report template is optional because it is added automatically if omitted. However, if you want to compile the template in a JasperReports IDE, declare it explicitly.
The REPORTING parameter supports two functions:
-
dataset- gets the sub-datasource from the main data source that can be used, for example, in tables or in subreports as subDataset. This method searches among the children of the root band for the band with specified name and creates a new data source with this band data as a new root. For example:<subDataset name="Product"> <field name="name" class="java.lang.String"/> <field name="price" class="java.lang.Long"/> </subDataset> ... <dataSourceExpression><![CDATA[$P{REPORTING}.dataset("Product")]]></dataSourceExpression> -
bitmap- transforms the given byte array intoByteArrayInputStreamand can be used for embedding images into the report. For example:
<field name="Main.image" class="java.lang.Object"/> //image from DB as byte array
...
<imageExpression><![CDATA[$P{REPORTING}.bitmap($F{Main.image})]]></imageExpression>
Each report band can be used in the template only once, so if you need to represent the same data in different forms within one report (for example, as a table and a chart), you need to create as many bands as the band elements in the template. Nested bands are not supported, all bands should be direct children of the Root band.
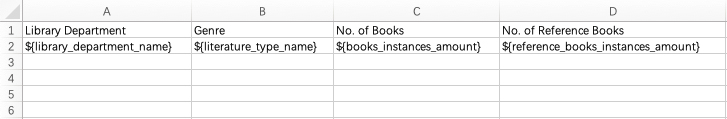
The data can be retrieved from the datasource using the following syntax: $F{<field name>}. For example:
<textField>
    <textFieldExpression><![CDATA[$F{library_department_name}]]></textFieldExpression>
</textField>
You can find an example of a report with JasperReports template in the Sample Jasper Reports section.
Class-Defined Template
Class-defined templates are useful when SQL, JPQL, or Groovy is not sufficient for preparing report data. A typical use case is a report that combines the output of several other reports.
Create a class and implement the io.jmix.reports.yarg.formatters.CustomReport interface. Define the createReport() method, which returns an array of bytes and takes the following input parameters:
-
report- report descriptor of theio.jmix.reports.yarg.structure.Reporttype. -
rootBand- root band data of theio.jmix.reports.yarg.structure.BandDatatype. -
params- a map of external report parameters.
Below is an example of a simple class-defined template. It creates an HTML document showing the name of a book selected as a report parameter:
package com.company.library.reports;

import com.company.library.entity.Book;
import io.jmix.reports.yarg.formatters.CustomReport;
import io.jmix.reports.yarg.structure.BandData;
import io.jmix.reports.yarg.structure.Report;

import java.util.Map;

public class BookReport implements CustomReport {
    @Override
    public byte[] createReport(Report report, BandData rootBand, Map<String, Object> params) {
        Book book = (Book) params.get("book");
        String html = "<html><body>";
        html += "<p>Name: " + book.getName() + "</p>";
        html += "</body></html>";
        return html.getBytes();
    }
}
In the report template dialog, check the Is custom checkbox, select Class in the Defined by field, and set the fully qualified name of the Java class as the custom definition:
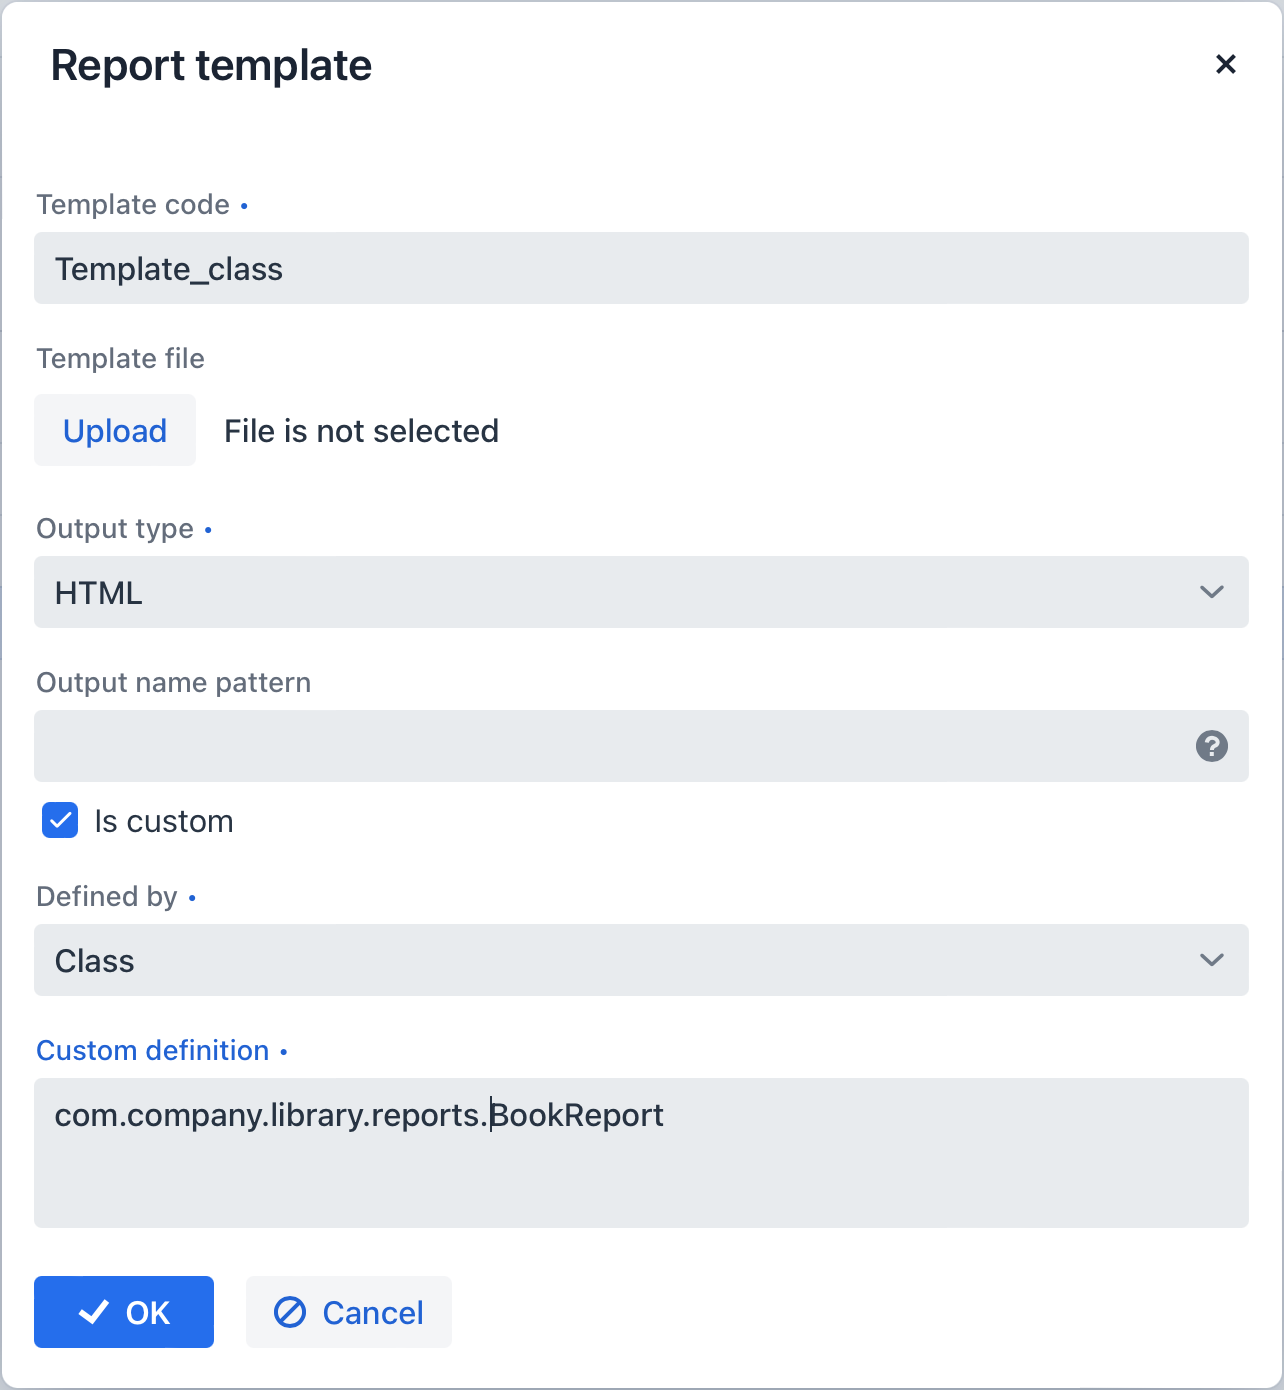
Table Formatter
When you select table output in the wizard, the system creates a template automatically. When the report runs, the data is displayed in a dedicated application view.
You can also create a table template manually for an existing report. To do this, select Table as the output type in the report template detail view.
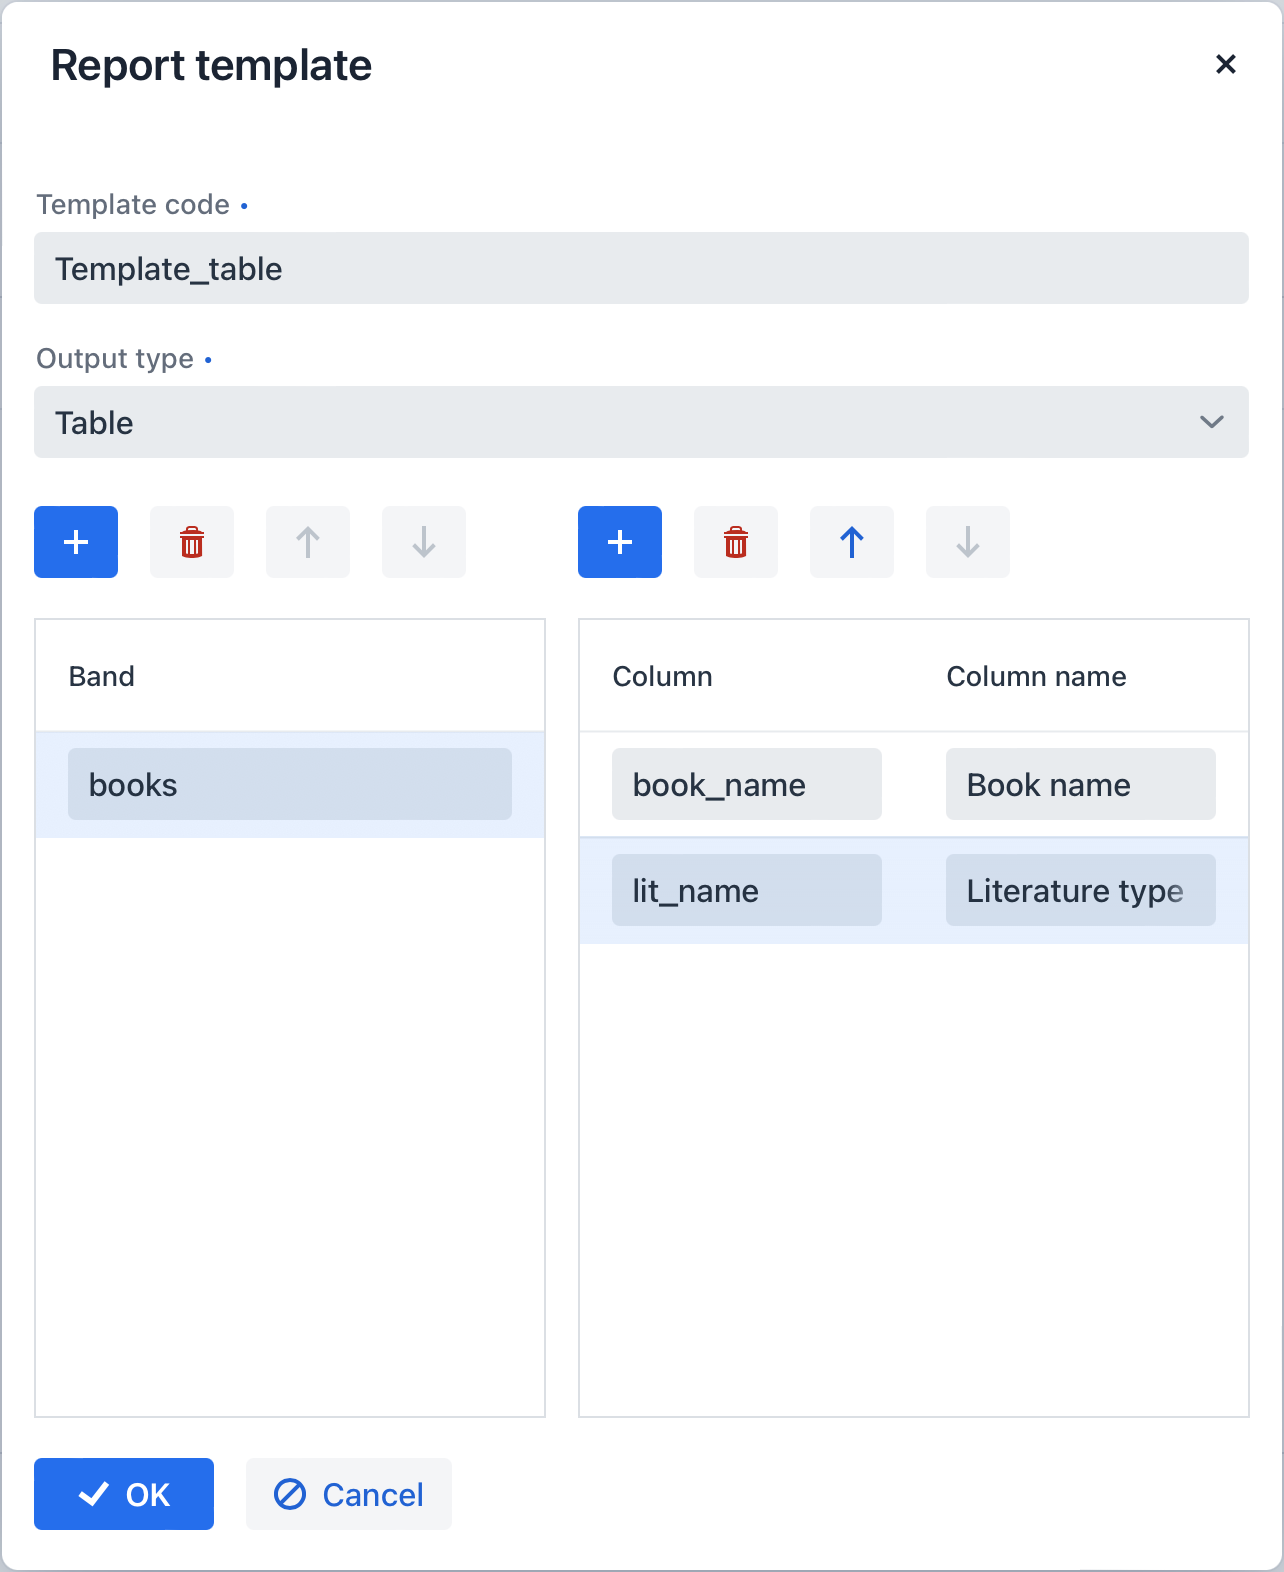
In the Band column, add the names of the bands to display in the resulting table. For each band, define a key-value map where the key is the dataset property name and the value is its localized caption.
The Reports add-on retrieves band data and renders a sortable table for each band from the first level of the hierarchy.
The table displays columns for all properties for SQL and JPQL datasets. If the Entity/List of Entities dataset is used, the table will display only the columns for selected attributes.
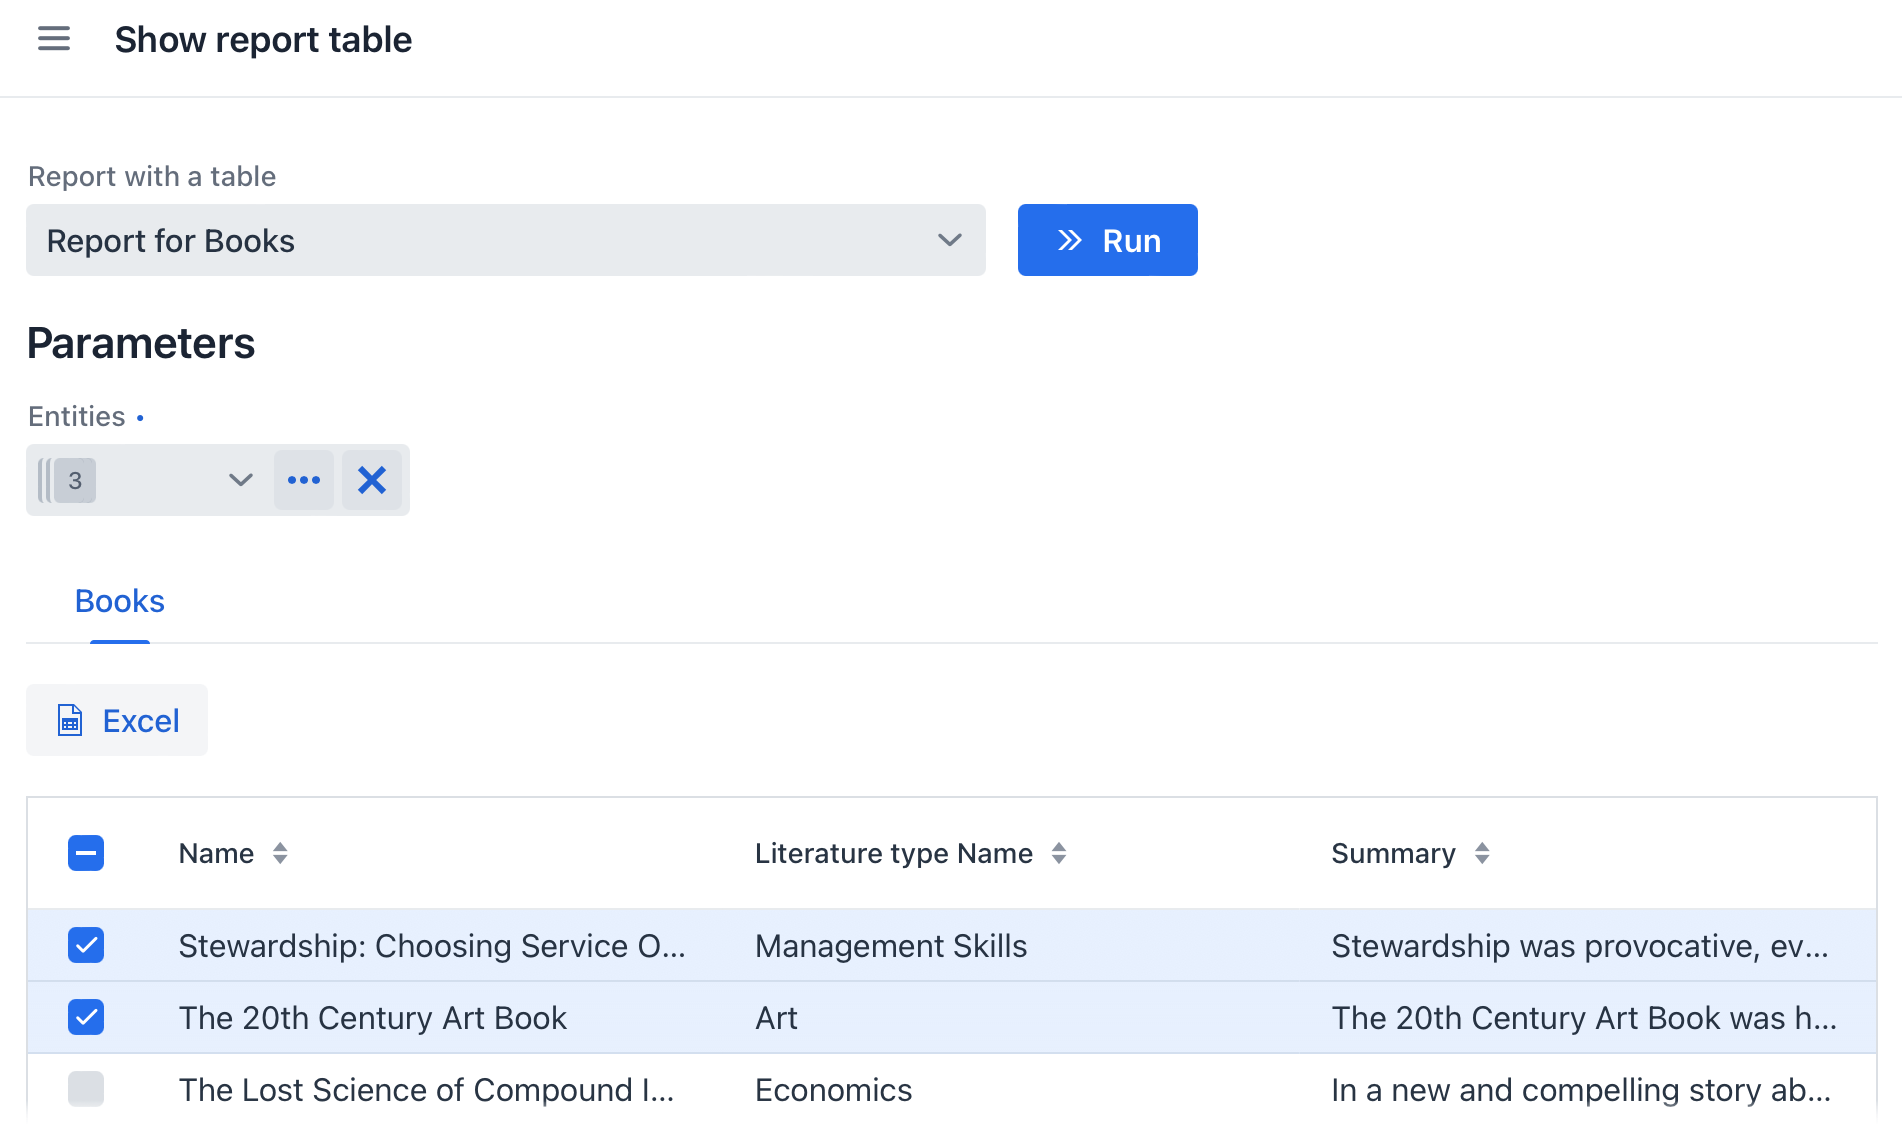
The resulting table is displayed in the Reports → Show tables view of your application. Use the Excel button to download the displayed table as an Excel file.
Executing External Reports
The Reports add-on allows you to run a report provided by an external service, such as Microsoft Reporting Services, and download its output. To define an external report, follow these steps:
-
In the report template dialog, select the Is custom checkbox.
-
Select URL in the Defined by field.
-
In the Custom definition field, specify the URL of the external report. Report parameters can be passed in the URL as
${param Alias}placeholders. -
Configure the jmix.reports.curl-path application property and set it to the path to the command line
curltool.
@TemplateDef Annotation
The @TemplateDef annotation defines a template as part of the report structure for design-time reports. You can apply this annotation multiple times on a report class if it contains several templates. To implement additional logic, declare a method annotated with @TemplateDelegate.
The @TemplateDef annotation has the following attributes:
-
code- unique template code. Use this code when referring to the template programmatically. -
isDefault- indicates whether this template should be used automatically for document generation unless the user explicitly specifies another one. Default:false. -
outputType- determines the type of output content generated by the reporting engine. The output type must be consistent with the template file type described in Output Format Compliance Matrix. -
alterableOutput- specifies whether users can choose the report output type at runtime in the UI. Default:false. -
custom- additional parameters for custom output document rendering. See @CustomTemplateParameters. -
outputNamePattern- optional file name pattern used to generate the file name for the produced report. This can be a constant string or include a report parameter as a variable (for example,${header.authorName}.xlsx). -
filePath- path to the file on the classpath that contains the template content. Template files are typically placed in the resources source root of the same module. -
table- table template definition forReportOutputType.TABLEoutput type. See @TemplateTableDef. -
templateEngine- template engine used to process the contents of text templates. Used for HTML template files with various output types. Default:TemplateMarkupEngine.FREEMARKER.
@CustomTemplateParameters Annotation
The @CustomTemplateParameters annotation defines parameters for a custom report template as part of the @TemplateDef definition. A custom template can provide a custom implementation for generating output documents based on band data and value formats.
The @CustomTemplateParameters annotation has the following attributes:
-
enabled- specifies whether a custom template implementation should be used. Default:false. -
definedBy- specifies how the custom template is invoked. Default:CustomTemplateDefinedBy.DELEGATE.SCRIPTandCLASSare not supported here; useDELEGATEinstead. -
urlScript- script that accepts a parameters map and returns a URL to call for generating the output.
@TemplateTableDef Annotation
The @TemplateTableDef annotation defines the structure of a template with io.jmix.reports.entity.ReportOutputType.TABLE output.
It has the band attribute, which specifies one or more bands to include in the output. Each band is displayed in a separate table component. See @TableBandDef.
@TableBandDef Annotation
Part of the table template definition, the @TableBandDef annotation represents a report band whose data is displayed in the resulting table.
The @TableBandDef annotation has the following attributes:
-
bandName- name of a report band declared in the current report definition. -
columns- columns displaying fields from the band. See @TableColumnDef.
@TableColumnDef Annotation
Part of the table template definition, the @TableColumnDef annotation represents a column in the resulting table and retrieves its values from band data by key.
The @TableColumnDef annotation has the following attributes:
-
key- name of a dataset property used to fetch values from the band data. -
caption- column caption. Use themsg://format for localization. The default message group is inferred from the declaration class’s package.
@TemplateDelegate Annotation
The @TemplateDelegate annotation marks a delegate method that implements logic related to a template defined in the report definition class.
Requirements:
-
The method must have no parameters.
-
The method must return one of the supported functional interfaces.
Supported interfaces:
-
CustomReport- delegates custom generation of the report output document.
The @TemplateDelegate annotation has the code attribute, which is the code of the template declared in the current report definition.
