Tracing
A trace shows the path of one request through the application and other services. It consists of spans: each span corresponds to one operation, such as loading a view or an SQL query, and stores its duration and attributes. Spans are nested, so the trace shows which operation took the longest.
Tracing in Jmix is based on Micrometer Observation and Micrometer Tracing, and the export is done through OpenTelemetry. Jmix creates spans for its operations; Spring Boot creates spans for incoming and outgoing HTTP requests.
Enabling Jmix Spans
jmix.core.data-observation-enabled=true
jmix.ui.ui-observation-enabled=true
The first property enables data access spans, the second one enables UI spans. Both are false by default. The same properties enable Jmix metrics: one observation produces both a metric and a span.
Vaadin sends all user actions as requests to a single URL, and the root span of each of them has the same name http post /**. Which view was opened and which action the user performed is visible only from the Jmix view lifecycle, data loader lifecycle, fragment lifecycle and execute action spans and their attributes.
Export through OpenTelemetry
Add the OpenTelemetry starter. Since Spring Boot 4, this is the recommended way: the starter contains the Micrometer Tracing bridge and the OTLP exporter.
implementation 'org.springframework.boot:spring-boot-starter-actuator'
implementation 'org.springframework.boot:spring-boot-starter-opentelemetry'
Specify the address of the trace collector, for example OpenTelemetry Collector or Grafana Tempo:
management.opentelemetry.tracing.export.otlp.endpoint=http://localhost:4318/v1/tracesShare of Sampled Traces
The management.tracing.sampling.probability property sets the share of requests whose traces are sent to the storage system. The default value is 0.1: one trace out of ten is kept.
management.tracing.sampling.probability=1.0The 1.0 value is convenient for development and debugging. In production, it increases the load on the application and the amount of stored data, so a value from 0.01 to 0.1 is used there.
Jmix Spans
The span name in the tracing system differs from the observation name: for example, the jmix.ui.views observation produces spans named view lifecycle.
| Observation | Span name | Attributes |
|---|---|---|
|
|
|
|
||
|
||
|
||
|
|
|
|
|
|
|
|
|
|
|
|
|
|
|
The values of the tags shared with metrics are described on the Metrics page. Attributes that metrics do not have:
| Attribute | Value |
|---|---|
|
The JPQL query text |
|
The query parameters with their values. Added if the query has parameters |
|
The list of properties of the loaded values |
|
The number of saved and removed entities of each type, for example |
|
The original loader ID, if |
Counting values through DataManager.getCount(ValueLoadContext) is recorded as a span named load values with the method=getCount attribute.
For example, in the trace of opening the visit list in the portal, the data loader lifecycle span of the view loader contains loading through REST DataStore and request processing in the second application:
view lifecycle (beforeShow)                              jmix-petclinic-portal
└── data loader lifecycle (load, visitsDl)               jmix-petclinic-portal
    └── load list of entities                            jmix-petclinic-portal
        └── http post                                    jmix-petclinic-portal
            └── http post /rest/entities/{entityName}/search   jmix-petclinic
                └── secured request                      jmix-petclinic
                    └── load list of entities            jmix-petclinic
The load list of entities span in the second application has the Jmix attributes: entity.name (petclinic_Visit), jpql.query with the JPQL query text, method with the operation and jmix.user.username with the user on whose behalf the query was executed.
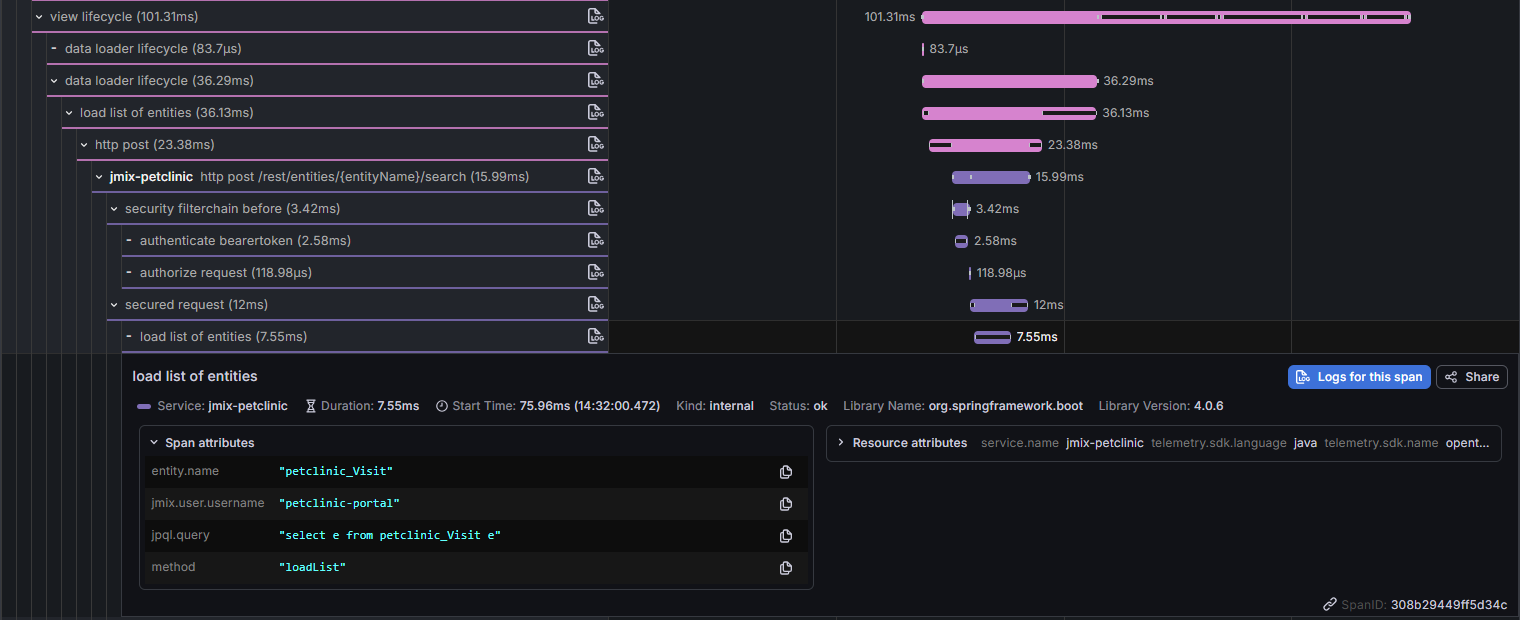
How to find extra and slow database queries using data loading spans is described in Data Access.
User and Tenant Attributes
When the jmix.core.use-user-info-for-observation property is enabled (the default), all spans get the attributes:
-
jmix.user.username: the current username; -
jmix.user.tenantId: the tenant ID in applications with multitenancy.
The jmix.user.username attribute lets you find the requests of a particular user in the tracing system. If usernames must not get into the tracing system, set the property to false.
The jpql.parameters attribute contains query parameter values, including personal data from search conditions. Take this into account when configuring access to the trace storage.
Context Propagation Between Services
For a trace to continue in another service, an outgoing HTTP request must carry the tracing headers. Spring Boot adds them automatically if the client is created from the auto-configured RestClient.Builder or RestTemplateBuilder. A client created with RestClient.create() or new RestTemplate() does not pass the headers, and the trace breaks at the service boundary.
Viewing Traces in Grafana
Traces are stored in a tracing system, such as Grafana Tempo, and are viewed in Grafana through Explore with the Tempo data source. A trace is displayed as a tree of spans on a timeline: the bar length is the operation duration, and the nesting shows which operation called which. The timeline shows which span took most of the request time.
Traces are searched with TraceQL queries. Span attributes are given with the span. prefix. Loading entity lists that took longer than 500 ms:
{ name = "load list of entities" && duration > 500ms }All lifecycle spans of the User.list view opened by the admin user:
{ name = "view lifecycle" && span.view.id = "User.list" && span.jmix.user.username = "admin" }To browse traces without writing queries, use Drilldown → Traces: Grafana shows the request rate, errors and duration by service and span and lets you go from outliers on a graph to particular traces.
The upper part of the page shows the rate of all spans, errors and the duration distribution; the lower part shows the same data by span name. In the Petclinic example, most spans are created by the Spring Security filter chain (authorize request, secured request, security filterchain): there are more of them than Jmix view lifecycle spans. If such spans are not needed, they are disabled, see Configuration for Production.
Searching and viewing traces is built into Grafana. Slow requests, view stages and DataManager loads are collected in the Traces section of the "Jmix 3 Full Observability" dashboard, see Ready-Made Dashboards. You can also go to a trace from other signals: from a log line by the trace ID, see Trace IDs in Logs, and from an exemplar point on a metric graph, see Exemplars. The root span of a request opens the CPU or memory allocation profile recorded during this span, see Linking Profiles to Spans. Going from a log line to a trace is shown in the Observability: Distributed Tracing guide.
Spans of Business Operations
A business operation that includes several framework calls can be combined into one span using the Micrometer Observation API. An observation is created through the ObservationRegistry bean:
@Autowired
private ObservationRegistry observationRegistry;
public void confirmOrder(Order order) {
    Observation.createNotStarted("sales.order.confirm", observationRegistry)
            .contextualName("confirm order")
            .lowCardinalityKeyValue("order.channel", order.getChannel().getId())
            .observe(() -> orderProcessor.process(order)); (1)
}| 1 | Order processing: calls to DataManager and other services inside the operation. |
The observation produces the confirm order span; the load entity, save entities and outgoing HTTP request spans created inside the operation become its child spans. At the same time, the sales.order.confirm timer with the order.channel tag appears. If the operation ends with an exception, observe() records it in the span and in the error tag of the timer.
lowCardinalityKeyValue tags get into both the metric and the span, so only values from a small set suit them. IDs and other unique values are added through highCardinalityKeyValue: they are written to the span only.
A full example with a user registration span is given in the Observability: Distributed Tracing guide.
Configuration for Production
-
A share of traces is kept, usually from 1 to 10%, see Share of Sampled Traces.
-
To keep all traces with errors and slow requests, the decision is made after the trace completes, in OpenTelemetry Collector with the tail_sampling processor. In this case, the application sends all traces to the Collector (
management.tracing.sampling.probability=1.0), and the Collector does the filtering. -
Unneeded observations are disabled by the
management.observations.enableproperty by name prefix, together with their spans and metrics. For example, Spring Security adds several filter chain spans to every request;management.observations.enable.spring.security=falsedisables them. -
Spans contain personal data (
jpql.parameters,jmix.user.username), see User and Tenant Attributes; this affects the choice of the trace storage system and access rights to it. -
The trace retention period in Tempo is set by the
compactor.compaction.block_retentionparameter.
See Also
-
Observability: Distributed Tracing: an example of two applications with Grafana Tempo