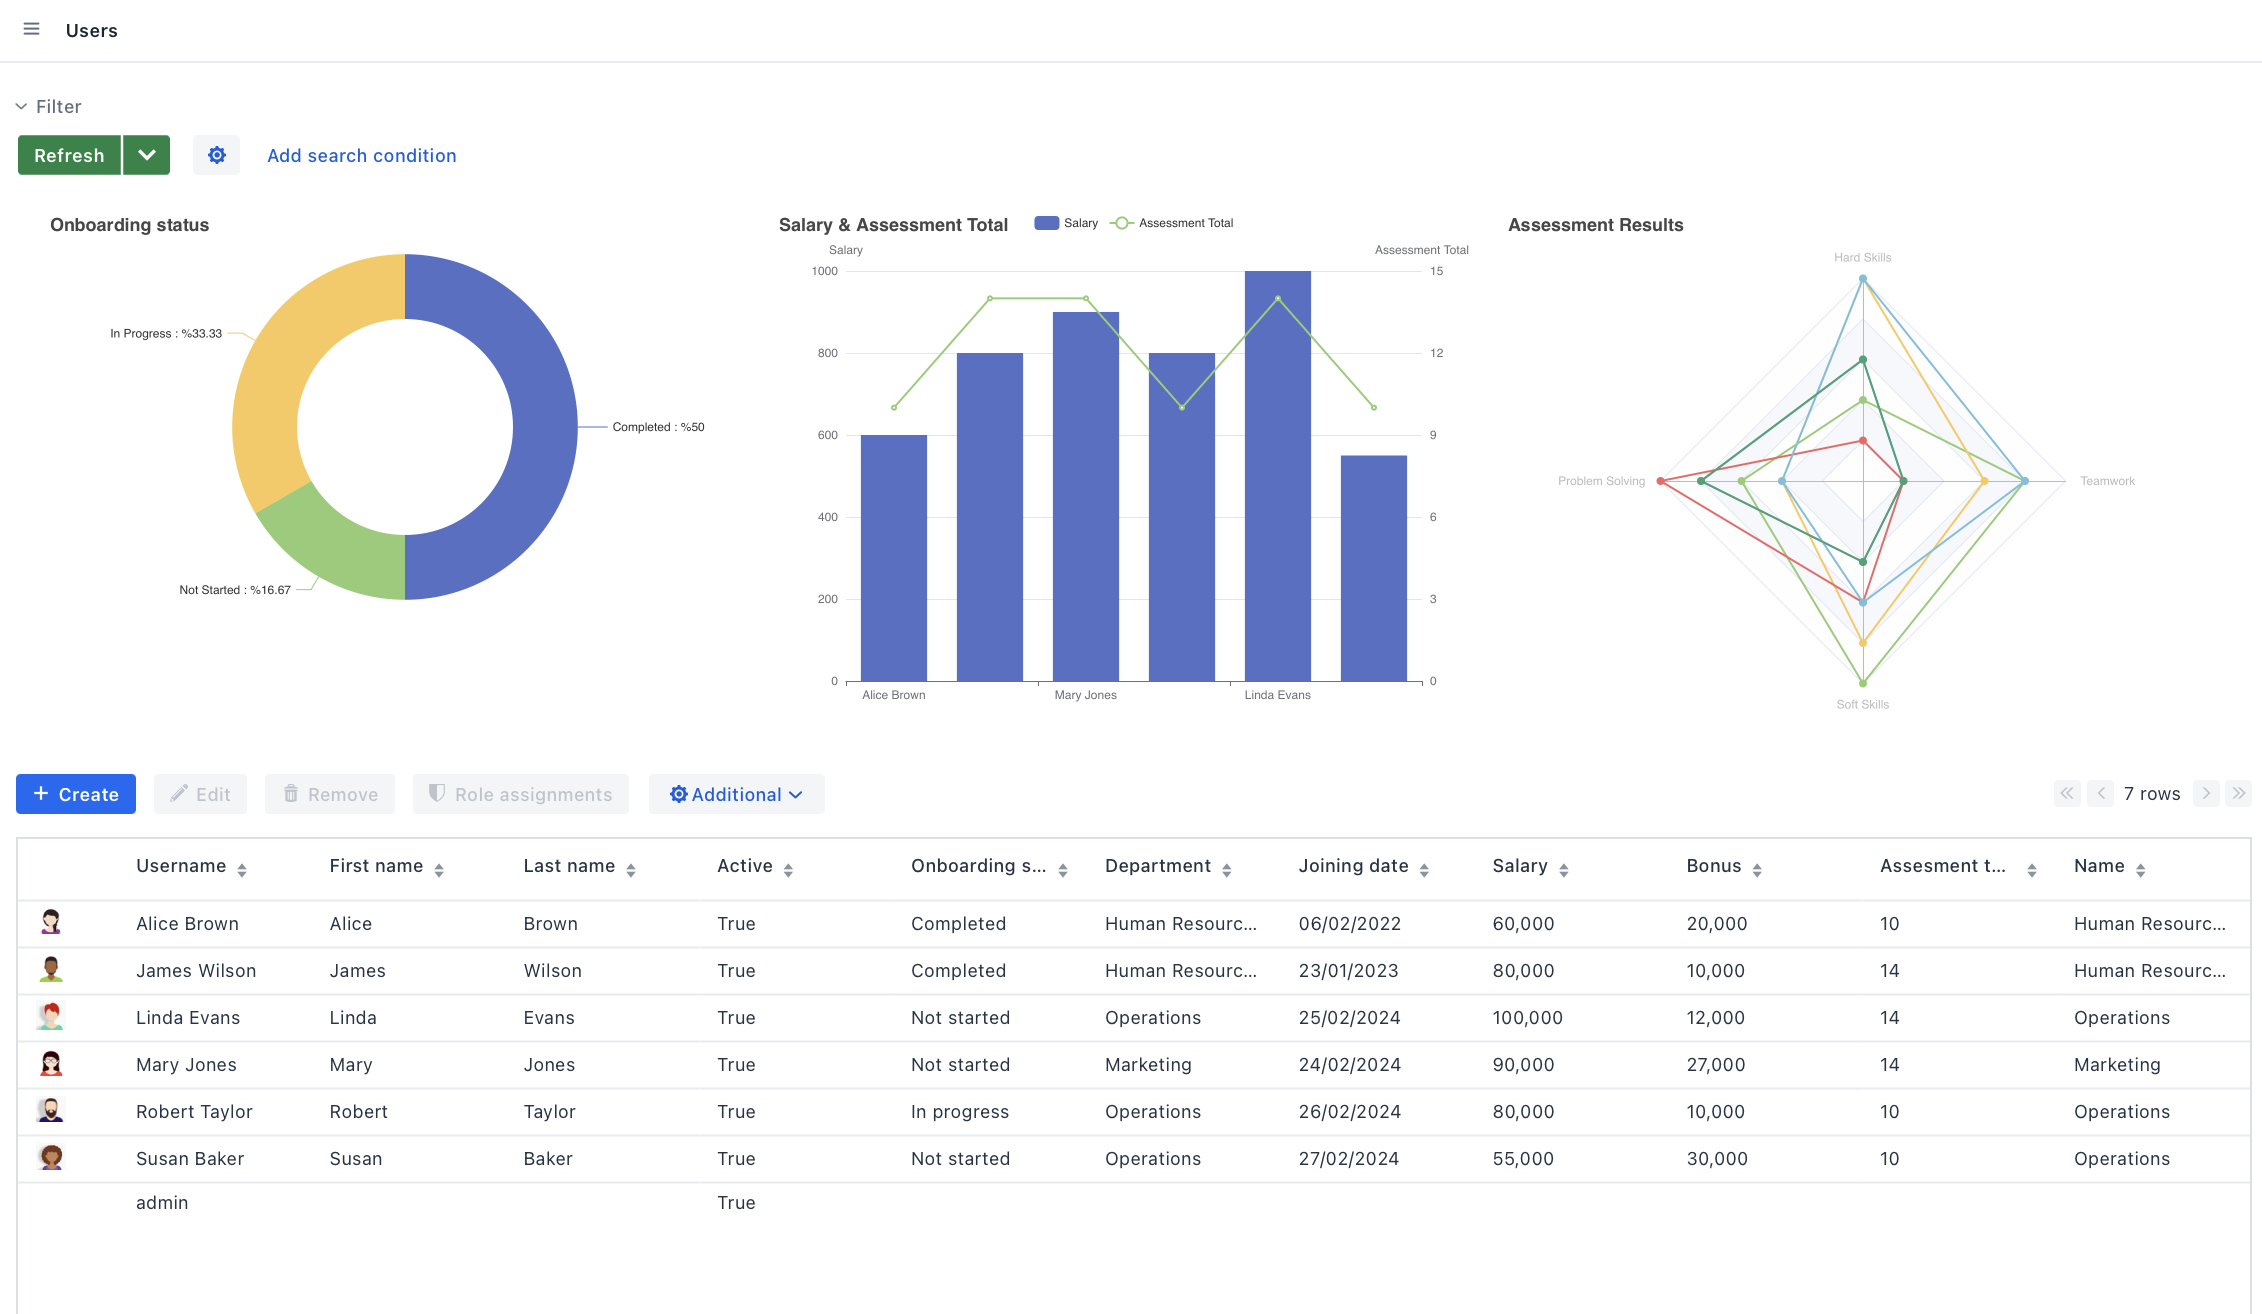
Getting Started with Charts
This section provides instructions on getting started with integrating charts into your application.
You will use the Onboarding application as a starting point. If you haven’t created this application, you can refer to the Tutorial section, which offers a detailed, step-by-step guide for developing the application.
Otherwise, download the complete application source code from the jmix-framework/jmix-onboarding GitHub repository. Next, follow the instructions in the Opening Existing Project section to open it in Jmix Studio.
Add the Charts add-on according to the installation section.
| When placing charts in responsive layouts or dynamically shown containers, see Responsive Sizing. |
Let’s look at the model of the sample onboarding application.
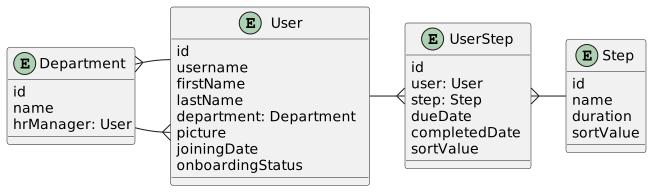
You need to add the following attributes to the User:
-
Salary (float)
-
Teamwork (int)
-
Hard Skills (int)
-
Soft Skills (int)
-
Problem Solving (int)
-
Assessment Total (int): The sum of teamwork, hard skills, soft skills and problem-solving scores.
These attributes' data will serve as the basis for the following charts:
-
A bar chart to compare employees' salaries and assessment scores.
-
A pie chart to show the distribution of onboarding statuses.
-
A radar chart to illustrate individual employee skills in various areas.
These charts will enable more data-driven decisions in HR management and planning.