Observability: Centralized Logging
This guide demonstrates how to export structured logs from two Jmix applications through OpenTelemetry and inspect them centrally in Grafana. For the local environment, we use the preconfigured Grafana OpenTelemetry LGTM stack, which includes the OpenTelemetry Collector, Loki, and Grafana in a single container.
Requirements
To effectively use this guide, you will need the following:
-
Setup the development environment.
-
Clone the sample project and switch to
release_3branch:git clone https://github.com/jmix-framework/jmix-observability-logging-sample cd jmix-observability-logging-sample git checkout release_3
What We are Going to Build
This guide focuses on setting up centralized logging across two applications: the Jmix Petclinic application and the Jmix Petclinic Portal.
As part of the setup, we also explore how the Petclinic Portal is built and how it interacts with the Petclinic backend using the Jmix REST Data Store.
The main steps covered in this guide are:
-
Running the Grafana OpenTelemetry LGTM stack as the local logging environment.
-
Configuring both applications to export structured logs through OTLP.
-
Exploring logs from both applications in Grafana.
Petclinic Portal
|
The following section describes the Petclinic Portal application, its connection to the Petclinic backend, and how the integration is set up. If you are only interested in centralized logging and observability topics, you can skip this section and continue directly with Introduction to Observability. |
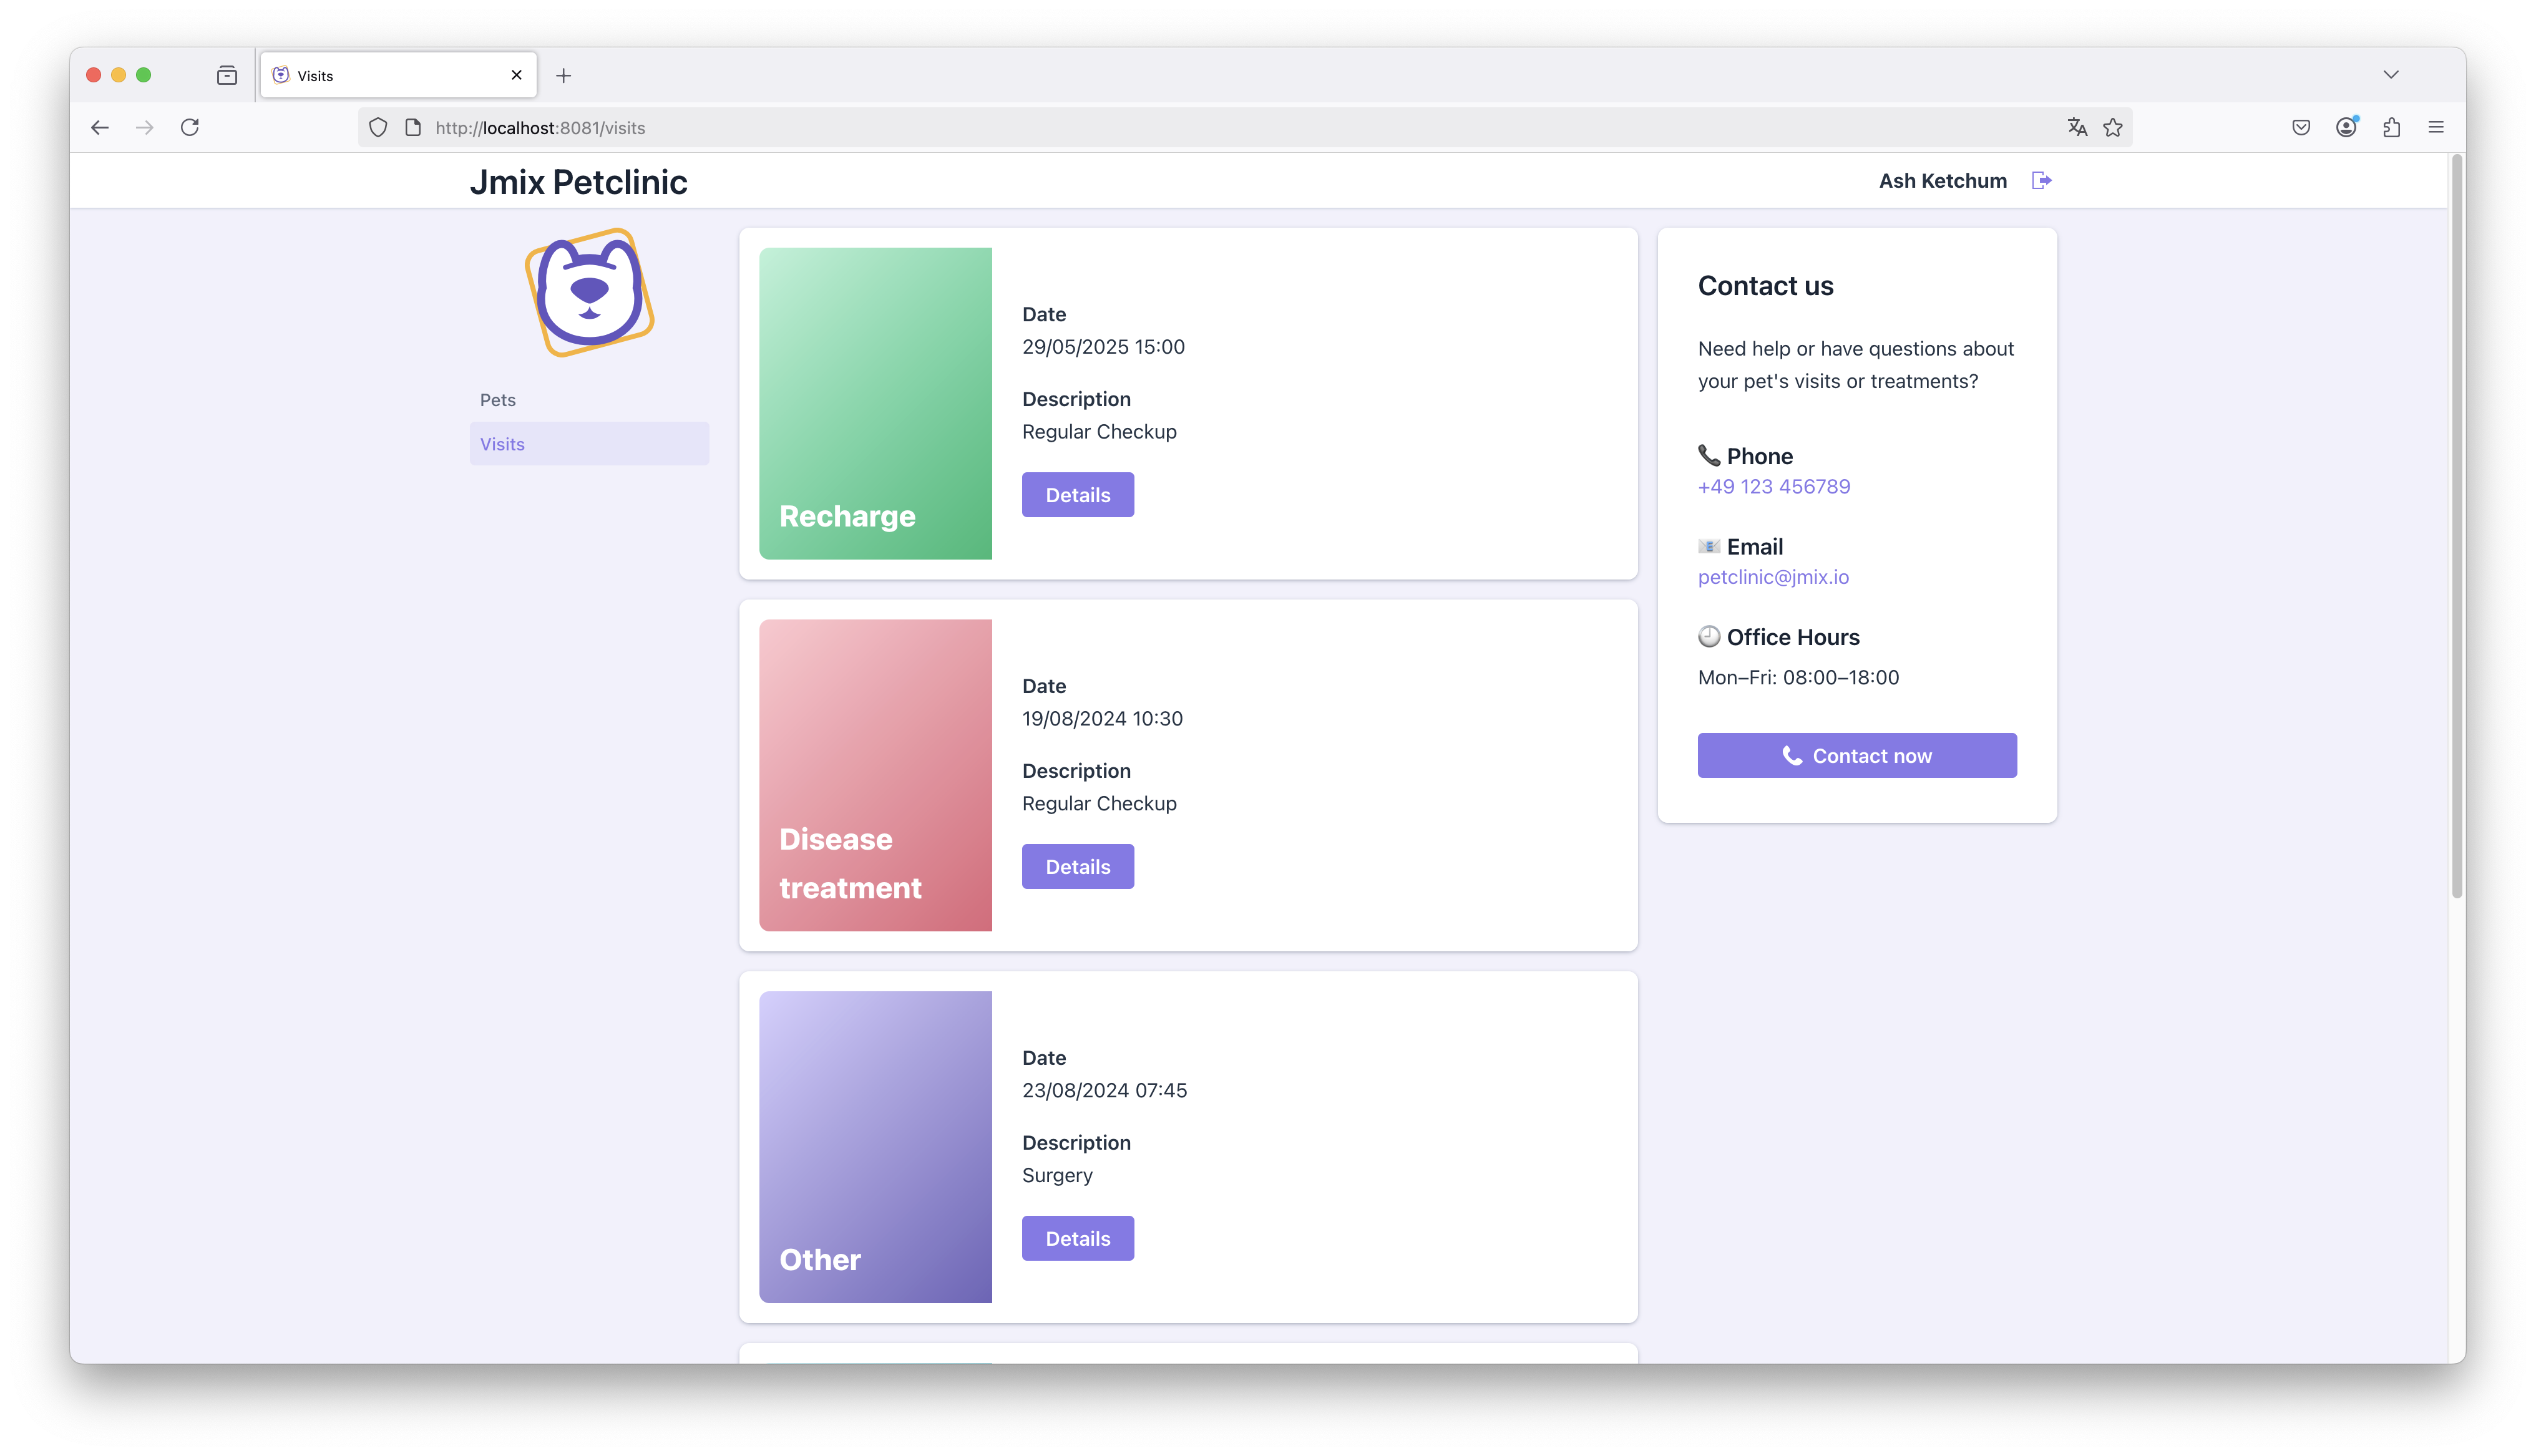
The Petclinic Portal allows pet owners to log in and view their data, including pets, past and upcoming visits, and contact information for the clinic. This functionality is a typical example of a consumer-facing app that offers self-service capabilities while staying connected to a central backend.
Petclinic API Integration
The Jmix REST Data Store provides an easy way to connect two Jmix applications using a REST API. The Portal fetches data such as Pet and Visit entities from the Petclinic backend without persisting or managing the data itself.
By splitting things up this way, we can deploy the Portal as a public-facing app with its own login system — like social login. At the same time, we don’t have to expose the full backend to the internet. Instead, we just expose a focused set of features, so users get exactly what they need without opening up the whole system.
Exposing Generic REST API in Petclinic
To enable the Petclinic application to expose its data through REST, we first need to add the following dependencies to the build.gradle file:
implementation 'io.jmix.rest:jmix-rest-starter'
implementation 'io.jmix.authserver:jmix-authserver-starter'
To allow the Petclinic Portal to access the Petclinic backend, we configure an OAuth2 client for the portal in the application.properties file of the Petclinic backend.
spring.security.oauth2.authorizationserver.client.petclinic-portal.registration.client-id=petclinic-portal
spring.security.oauth2.authorizationserver.client.petclinic-portal.registration.client-secret={noop}UYfIcnMhoL
spring.security.oauth2.authorizationserver.client.petclinic-portal.registration.authorization-grant-types=client_credentials
spring.security.oauth2.authorizationserver.client.petclinic-portal.registration.client-authentication_methods=client_secret_basic
spring.security.oauth2.authorizationserver.client.petclinic-portal.token.access-token-format=reference
spring.security.oauth2.authorizationserver.client.petclinic-portal.token.access-token-time-to-live=24h

jmix.authserver.client.petclinic-portal.client-id=petclinic-portal
jmix.authserver.client.petclinic-portal.resource-roles=system-full-access|
The Petclinic Portal uses the |
|
In this example, the |
With these settings in place, the Jmix Petclinic application now exposes a REST API protected by OAuth2. Let’s look into how to configure the Portal application to use the Petclinic REST API backend.
Connecting Petclinic Portal to the Backend
To enable the Petclinic Portal to connect to the Petclinic backend and access its data, we first need to configure the REST Data Store module in the portal application.
First, add the following dependencies to the build.gradle file of the Petclinic Portal application:
implementation 'io.jmix.restds:jmix-restds-starter'Next, we need to configure the connection details of the client credentials flow in application.properties:
jmix.core.additional-stores=petclinic
jmix.core.store-descriptor-petclinic=restds_RestDataStoreDescriptor

petclinic.baseUrl=http://localhost:8080
petclinic.clientId=petclinic-portal
petclinic.clientSecret=UYfIcnMhoL
To connect to the Petclinic backend, we configure a custom REST data store named petclinic in the Portal application. As the datastore descriptor we use the RestDataStoreDescriptor, which requires authentication via OAuth2 client credentials. Once configured, the portal can interact with exposed entities from the backend securely and without managing the data itself.
We create a Pet Jmix DTO Entity in the portal application that represents the data structure we expect from the backend.
@JmixEntity
@Store(name = "petclinic") (1)
@RestDataStoreEntity(remoteName = "petclinic_Pet") (2)
public class Pet {

    @JmixGeneratedValue
    @JmixId
    private UUID id;

    private List<Visit> visits;

    @InstanceName
    private String name;

    // ...

}| 1 | @Store(name = "petclinic") — specifies that the entity belongs to the additional petclinic data store. |
| 2 | @RestDataStoreEntity(remoteName = "petclinic_Pet") — maps the DTO to the corresponding entity name exposed by the petclinic REST API. |
After creating and connecting the DTO entities, we can use them like any other persistent entities within Jmix views.
We define a data loader in the Portal pet-list-view.xml to load Pet entities. When using the Jmix REST Data Store, the data loader works slightly differently compared to standard database loaders: it uses a JSON-based query format instead of JPQL, as the query is sent to the Petclinic backend via its REST API.
Here’s an example of how the Pet entities are loaded for the currently logged-in owner:
<collection id="petsDc"
            class="io.jmix.petclinic.portal.entity.Pet">
    <fetchPlan extends="_base">
        <property name="type" fetchPlan="_base"/>
    </fetchPlan>
    <loader id="petsDl" readOnly="true">
        <query>
            <![CDATA[
            {
              "property": "owner.id",
              "operator": "=",
              "parameterName": "ownerId"
            }
            ]]>
        </query>
    </loader>
</collection>
For more information on how to define queries and filters when using the Jmix REST data store, refer to REST data store: Using Query in View XML.
Portal Custom Layout
The Petclinic Portal uses a fully customized layout that intentionally deviates from the typical look of a business application. Instead of relying on standard Jmix or Vaadin UI components, the layout mimics elements of modern websites — including scrollable views, card-based presentation, and visually grouped sections.
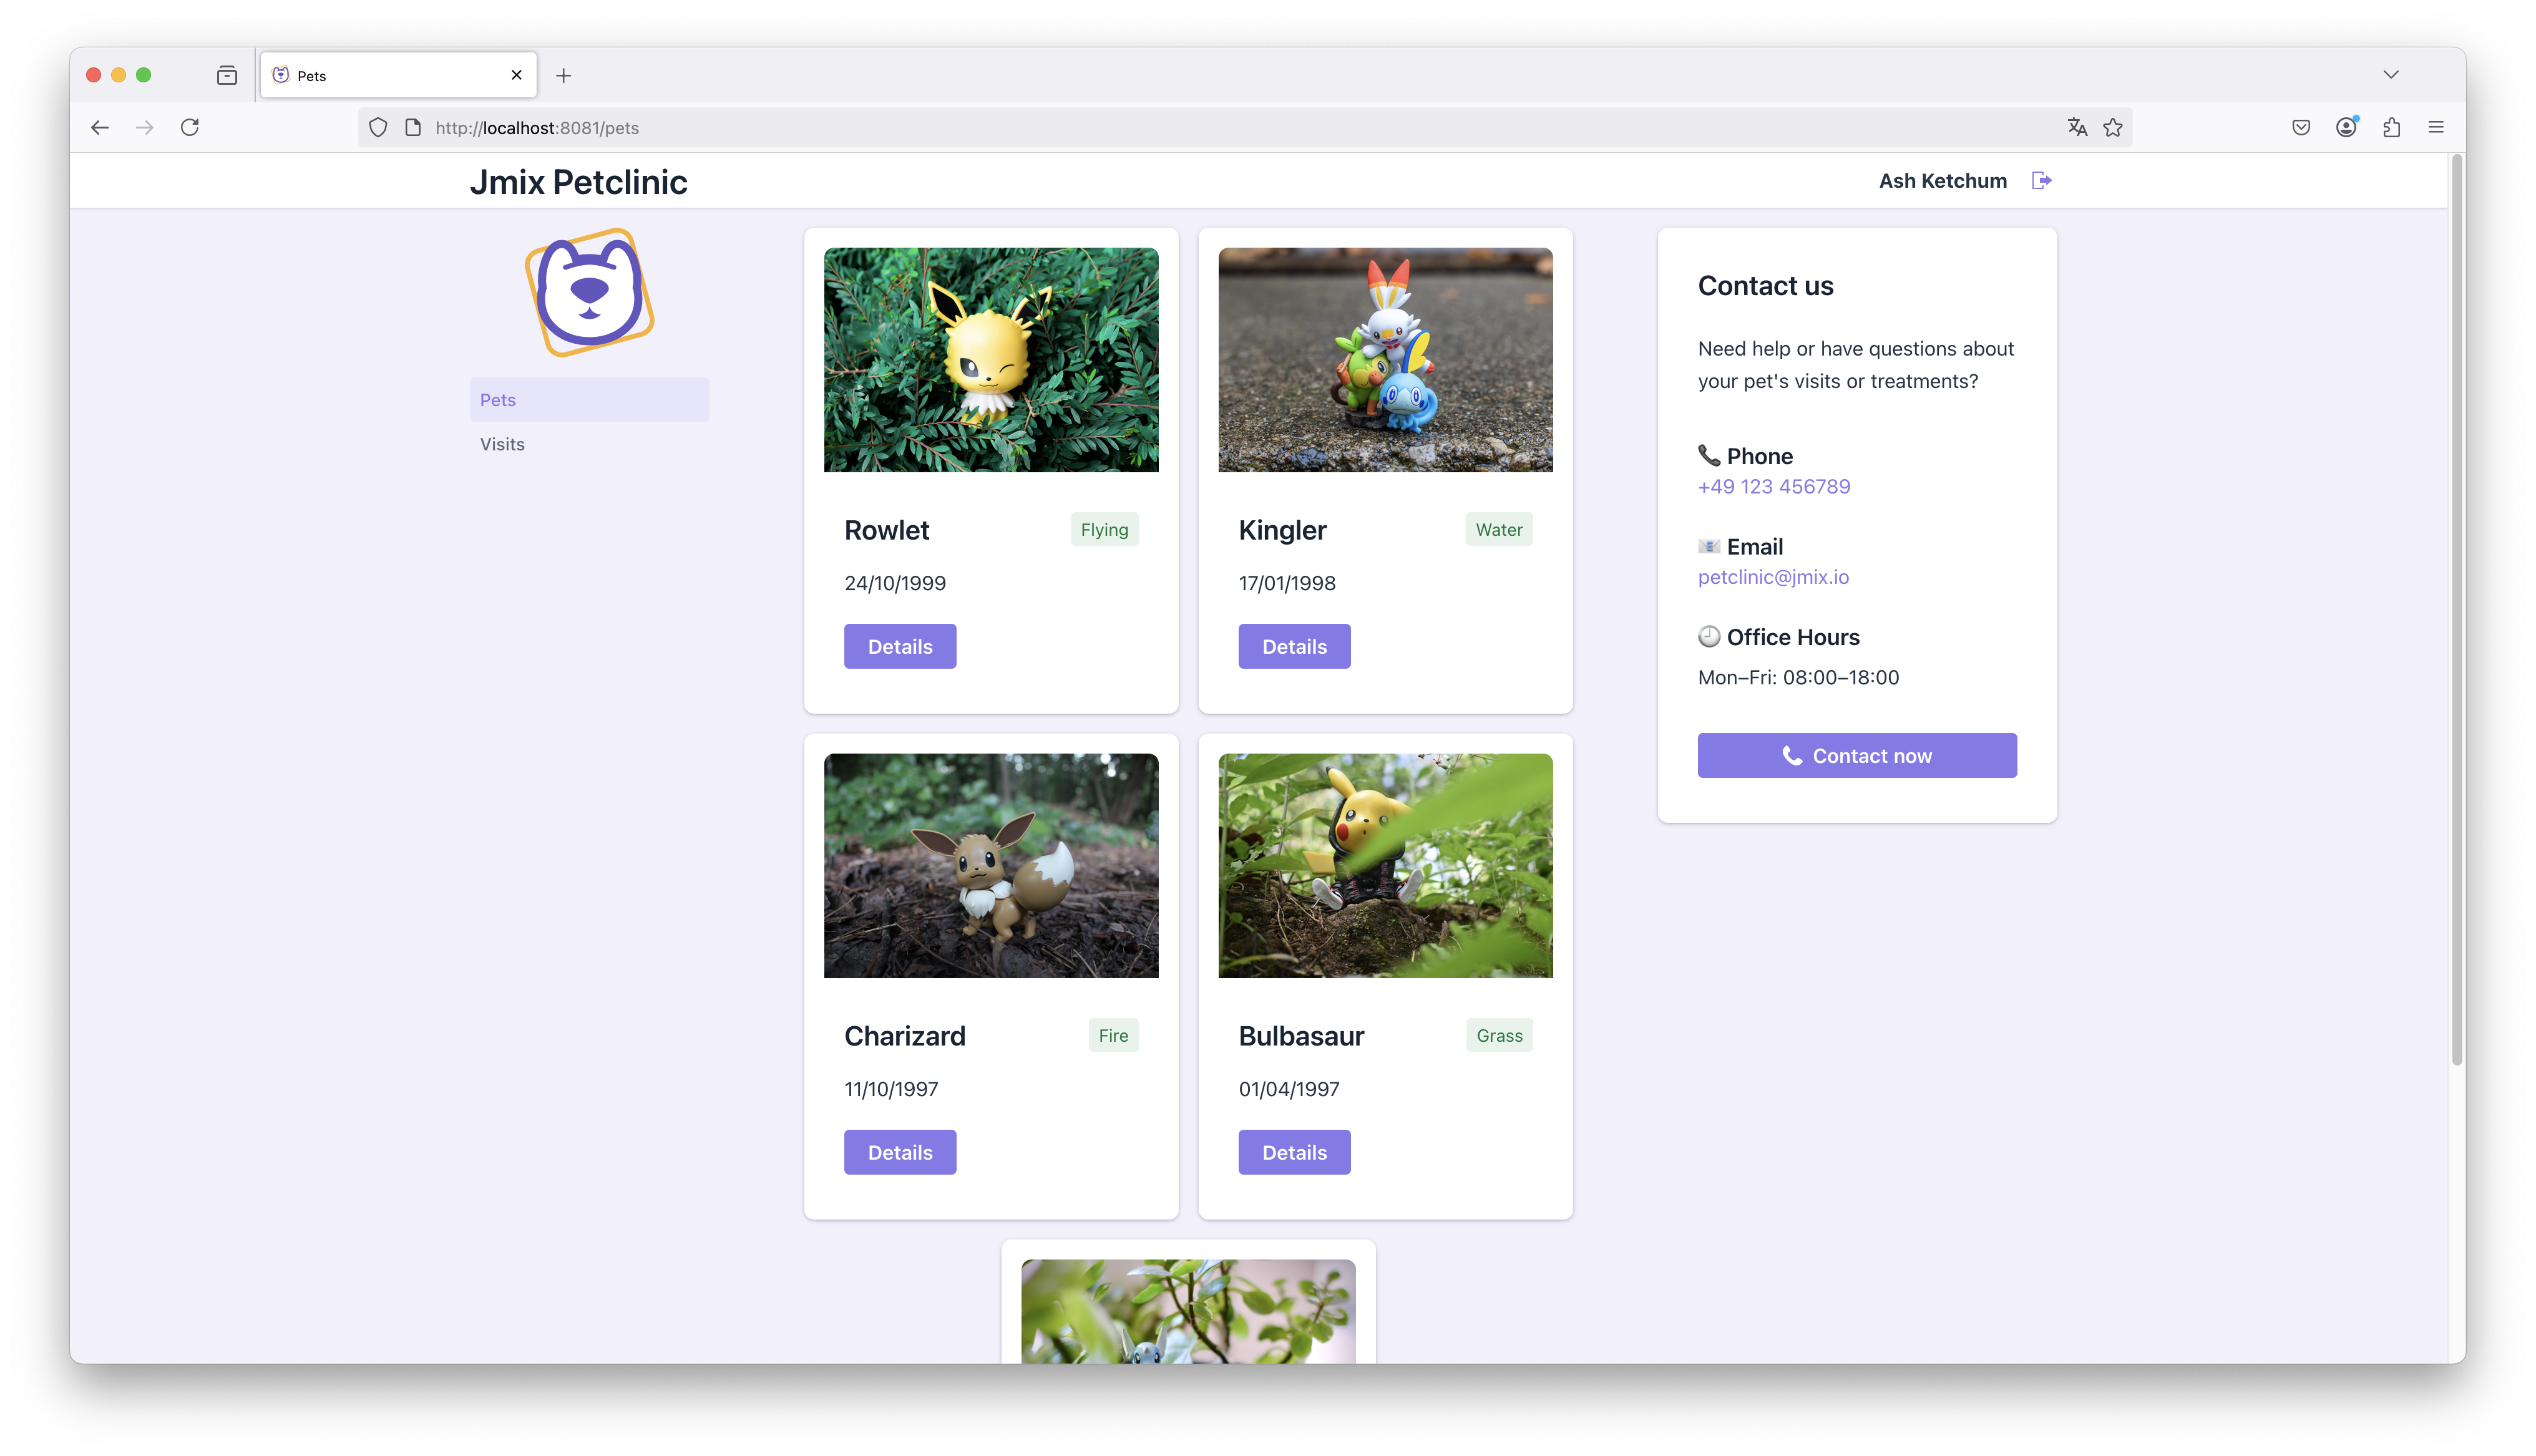
We use a Fragment to represent each Pet entity visually as a card component. Each card displays key information such as the pet’s name, type, birthdate, and offers a button to navigate to the detail view.
<?xml version="1.0" encoding="UTF-8" standalone="no"?>
<fragment xmlns="http://jmix.io/schema/flowui/fragment">
    <data>
        <instance id="petDc"
                  class="io.jmix.petclinic.portal.entity.Pet">
            <loader id="petDl"/>
        </instance>
    </data>
    <actions>
        <action id="detailsAction" text="msg://details" />
    </actions>
    <content>
        <vbox id="root" classNames="pet-card">
            <image id="petIcon" classNames="pet-image"/>
            <vbox spacing="true" padding="true">
                <hbox spacing="false" padding="false" width="100%">
                    <h3 width="100%"><span dataContainer="petDc" property="name">Pet Name</span></h3>
                    <span classNames="badge success"><span dataContainer="petDc" property="type" /></span>
                </hbox>
                <span><span dataContainer="petDc" property="birthdate" /></span>
                <button action="detailsAction" themeNames="primary"/>
            </vbox>
        </vbox>
    </content>
</fragment>
The visual appearance of the cards is defined using a custom CSS file. While it reuses selected Lumo theme variables for consistency (e.g., spacing, colors, border radius), the styles themselves are custom-defined and not based on Vaadin components. Let’s create a dedicated file under src/main/frontend/themes/jmix-petclinic-portal/view/pet-card.css:
.pet-card {
  background-color: var(--lumo-base-color);
  border-radius: var(--lumo-border-radius-l);
  padding: var(--lumo-space-m);
  box-shadow: var(--lumo-box-shadow-xs);
  max-width: 300px;
}

.pet-image {
  border-top-left-radius: var(--lumo-border-radius-l);
  border-top-right-radius: var(--lumo-border-radius-l);
  object-fit: cover;
  height: 180px;
  width: 100%;
}

.badge {
  align-self: flex-start;
  padding: 2px 8px;
  border-radius: var(--lumo-border-radius-m);
  font-size: var(--lumo-font-size-s);
  background-color: var(--lumo-success-color-10pct);
  color: var(--lumo-success-text-color);
}
Cards are dynamically created when the Pet data is loaded into the Pet List View by reacting to a CollectionContainer.CollectionChangeEvent on the data container.
This event listener allows us to rebuild the card layout each time the set of loaded pets changes.
@Route(value = "pets", layout = MainView.class)
@ViewController(id = "Pet.list")
@ViewDescriptor(path = "pet-list-view.xml")
@DialogMode(width = "50em")
public class PetListView extends StandardListView<Pet> {

    @ViewComponent
    private HorizontalLayout cardWrapper;
    // ...

    @Subscribe(id = "petsDc", target = Target.DATA_CONTAINER)
    public void onPetsDcCollectionChange(final CollectionContainer.CollectionChangeEvent<Visit> event) {
        cardWrapper.removeAll();
        petsDc.getItems()
                .forEach(this::addPetCard);
    }

    private void addPetCard(Pet pet) {
        PetCard petCard = fragments.create(this, PetCard.class);
        petCard.setPet(pet);
        petCard.setDetailsActionHandler(() ->
                viewNavigators.detailView(this, Pet.class)
                .editEntity(pet)
                .navigate()
        );
        cardWrapper.add(petCard);
    }
}|
To learn more about how to build consumer-facing applications with Jmix, watch the webinar Making Web UI in Java Fancy: Fast Prototype Consumer Facing App on Jmix. It walks through the full process of building custom UIs like the Petclinic Portal, including layout, design, and REST integration. |
With both the Petclinic backend and the Portal application up and running, we now turn our attention to observability. Specifically, we want to see how to equip both applications with centralized logging.
Introduction to Observability
Before diving into the technical setup, let’s take a step back and look at the broader concept of observability — what it means in practice and why it’s especially relevant in distributed systems.
Observability is the ability to understand the internal state of a system based on the telemetry data it produces.
While observability is beneficial for any application, it becomes especially critical in distributed systems and microservice architectures, where system complexity increases and understanding behavior across multiple components becomes significantly more challenging.
In traditional environments, administrators could often still introspect systems at the operating system level to investigate problems. In modern cloud environments, containerized setups, and Kubernetes-based infrastructures, this is no longer possible. Applications are isolated, ephemeral, and distributed across nodes, making direct access for debugging or inspection infeasible.
As a result, the need has emerged to extract telemetry data — logs, metrics, and traces — directly from applications and forward it into specialized observability systems for centralized collection, analysis, and monitoring.
Observability is typically built around three main pillars:
-
Logs: Structured or unstructured records of events that have occurred within the system.
-
Metrics: Numerical data that represent measurements over time, such as response times, error rates, or system load.
-
Traces: Records of the request-flow as it passes through different parts of the system.
In this guide, we focus primarily on logging. We will see how to use structured logs and centralize logging across multiple applications to improve monitoring, troubleshooting, and overall system understanding.
Centralized Logging
Centralized logging refers to the practice of collecting log data from multiple applications and systems into a single, centralized location for analysis and monitoring. This approach simplifies troubleshooting, enhances visibility across distributed systems, and enables proactive issue detection.
There are various ways to implement centralized logging. Many cloud providers offer managed logging services, such as AWS CloudWatch, Google Cloud Logging, or Microsoft Azure Monitor, which automatically collect logs from infrastructure and applications. Additionally, there are SaaS-based observability platforms like Datadog, which provide extensive logging, monitoring, and alerting capabilities as a service. For teams that prefer to manage their own infrastructure, self-hosted solutions such as the Elastic Stack (formerly ELK Stack) or Grafana Loki are popular options. These solutions allow full control over data retention, cost management, and system integration.
Despite their differences, centralized logging systems share a common architecture. Typically, one or more components are responsible for receiving log data from applications (collectors or agents), and another component stores and indexes the logs for querying and visualization.
The main benefit of centralized logging is that it brings together logs from multiple independent applications into a single place. Instead of manually digging through separate log files, operators and developers can search and analyze logs centrally — making troubleshooting and system monitoring much more efficient.
Structured Logging
Structured logging refers to writing logs in a machine-readable format such as JSON or key-value pairs, rather than plain text messages. This makes it significantly easier for centralized logging systems to parse, index, and query logs efficiently.
With structured logs, fields like userId, petId, or errorType can be used directly in queries, enabling fast and precise troubleshooting. It also supports advanced use cases such as automated detection and masking of sensitive information (PII) and correlating events across distributed systems.
Here’s an example of a structured log entry in JSON format:
{
  "timestamp": "2025-04-26T08:45:30.123Z",
  "level": "ERROR",
  "service": "petclinic-portal",
  "errorType": "ValidationError",
  "message": "Pet name must not be empty",
  "attributes": {
    "userId": "8fa85f64-5717-4562-b3fc-2c963f66afa6",
    "petId": "5e8b6c45-0c12-4f0f-bc47-1a6a5d2cf08d"
  }
}
In contrast, a traditional log entry using a default Logback console appender might look like this:
2025-04-26 08:45:30 ERROR [http-nio-8080-exec-7] io.jmix.petclinic.portal.view.pet.PetListView - Pet name must not be empty for Pet with ID: 5e8b6c45-0c12-4f0f-bc47-1a6a5d2cf08dIn the unstructured format, the petId is embedded somewhere in the message string — for example after a colon, or within a phrase like 'with ID'. Because log messages vary widely in wording and structure, it’s nearly impossible for automated systems to reliably extract such values from plain text logs.
With structured logging, fields like petId are explicitly available, so we can filter and search for all logs related to a specific entity — something that’s critical for debugging and monitoring distributed systems.
To fully benefit from centralized logging, applications should produce structured logs natively. Structured data makes it possible to query specific fields and build rich, user-specific dashboards across distributed systems.
In our petclinic example, we will use Spring Boot’s OpenTelemetry support to export structured logs from the applications and send them to the centralized logging backend.
Loki and Grafana
In this guide, Loki stores and queries the application logs, while Grafana provides the user interface for exploring them.
Unlike the Elastic Stack (ELK), which indexes the full content of log messages, Loki only indexes a small set of pre-defined labels (like app, env, or service) and stores the actual log content separately. This design makes Loki much more efficient in terms of storage and memory usage, while still enabling powerful filtering and search capabilities for common queries.
Loki is part of the broader Grafana observability stack alongside Tempo for distributed tracing and Prometheus for metrics. For the local observability environment, this guide introduces the Grafana OpenTelemetry LGTM stack instead of configuring and running the Collector, Loki, and Grafana as separate services.
Running the Grafana OpenTelemetry LGTM Stack
For local development, we use the Grafana OpenTelemetry LGTM stack. It packages the OpenTelemetry Collector, Loki, Grafana, Tempo, Prometheus, and Pyroscope into a single preconfigured Docker image.
The sample project’s Docker Compose configuration contains one lgtm service for the complete stack:
lgtm:
  image: grafana/otel-lgtm:latest
  ports:
    - "3000:3000" # Grafana
    - "4317:4317" # OTLP gRPC
    - "4318:4318" # OTLP HTTP
Port 4318 accepts OTLP over HTTP, port 4317 accepts OTLP over gRPC, and port 3000 exposes Grafana. Loki, Tempo, and Prometheus are already configured as Grafana data sources, so no separate Collector, Tempo, Loki, or Grafana configuration files are needed.
|
The LGTM image is intended for development, demo, and testing environments. In production, applications typically send telemetry to dedicated managed or self-hosted observability backend services instead of running all components in a single container. |
OpenTelemetry
OpenTelemetry is a vendor-neutral open-source project that defines standards and components for collecting, transmitting, and processing telemetry data such as logs, metrics, and traces.
In this guide, OpenTelemetry provides the mechanism for transporting logs from the applications to the centralized backend. Communication uses the OpenTelemetry Protocol (OTLP), a standardized protocol for logs, metrics, and traces. The applications therefore export to an OTLP endpoint instead of integrating directly with Loki.
This keeps the application configuration independent of the local Grafana stack. An OTLP-compatible managed service or another Collector deployment can replace the local endpoint without changing the logging code.
OpenTelemetry Collector
The OpenTelemetry Collector receives telemetry, optionally processes it, and forwards it to one or more backends. The Collector included in the LGTM image is already configured to accept OTLP logs and write them to the bundled Loki instance.
As a result, this sample does not need a custom otelcol-config.yaml. We only need to point the applications to the Collector endpoint.
Exporting Logs with OpenTelemetry
There are multiple ways to forward logs to the OpenTelemetry Collector. Applications can export log records directly, or infrastructure agents can collect and forward container output.
In this sample, the applications export Logback events directly. Spring Boot’s OpenTelemetry integration configures the OpenTelemetry SDK and OTLP exporter.
The OpenTelemetry Logback appender converts each Logback event into a structured OpenTelemetry log record and passes it to the SDK. The OTLP exporter then sends those records to the Collector, which forwards them to Loki.
First, let’s add the required dependencies to the build.gradle:
// This appender sends log events to the OpenTelemetry Collector via OTLP.
implementation 'io.opentelemetry.instrumentation:opentelemetry-logback-appender-1.0:1.32.1-alpha'

// Required to export log records via the OTLP protocol to the OpenTelemetry Collector.
implementation 'io.opentelemetry:opentelemetry-exporter-otlp'

// Provides the OpenTelemetry SDK bean and the OTLP log export auto-configuration.
implementation 'org.springframework.boot:spring-boot-opentelemetry'
Next, we define the OTLP logging endpoint in the application’s application.properties:
# Enables exporting logback logs via OTLP to the collector.
management.logging.export.otlp.enabled=true
management.opentelemetry.logging.export.otlp.transport=http
management.opentelemetry.logging.export.otlp.endpoint=http://localhost:4318/v1/logs
This configuration points the log output to the OpenTelemetry Collector running locally. Additionally, we need to create the logging configuration (logback-spring.xml) to forward log events both to the console and to the OpenTelemetry appender:
<?xml version="1.0" encoding="UTF-8"?>
<configuration>

    <!-- Console Appender:
         Outputs logs to the console. The pattern includes a timestamp, thread,
         log level, logger name, and prints all MDC (Mapped Diagnostic Context) key/value pairs using %X.
    -->
    <appender name="console" class="ch.qos.logback.core.ConsoleAppender">
        <encoder>
            <pattern>
                %d{HH:mm:ss.SSS} [%thread] [%X] %-5level %logger{36} - %msg%n
            </pattern>
        </encoder>
    </appender>

    <!-- OpenTelemetry Appender:
         Sends log events to an OpenTelemetry Collector with all MDC attributes are captured.

         OpenTelemetryAppender automatically puts trace_id and span_id into the logs so that it is possible to correlate them with traces
    -->
    <appender name="OpenTelemetry" class="io.opentelemetry.instrumentation.logback.appender.v1_0.OpenTelemetryAppender">
        <captureMdcAttributes>*</captureMdcAttributes>
    </appender>

    <!-- Root Logger:
         Configures logging at INFO level and routes log events to both the console and OpenTelemetry appenders.
    -->
    <root level="INFO">
        <appender-ref ref="console"/>
        <appender-ref ref="OpenTelemetry"/>
    </root>

</configuration>
Finally, we initialize the OpenTelemetry Logback Appender at application startup to connect it properly with the OpenTelemetry SDK:
package io.jmix.petclinic.portal.config;

import io.opentelemetry.api.OpenTelemetry;
import io.opentelemetry.instrumentation.logback.appender.v1_0.OpenTelemetryAppender;
import org.springframework.beans.factory.InitializingBean;
import org.springframework.stereotype.Component;

/**
 * "The OpenTelemetryAppender for both Logback and Log4j requires access to an OpenTelemetry instance to function properly.
 * This instance must be set programmatically during application startup."
 * See also logback-spring.xml:
 *     <appender name="OpenTelemetry" class="io.opentelemetry.instrumentation.logback.appender.v1_0.OpenTelemetryAppender" />
 * see: <a href="https://docs.spring.io/spring-boot/reference/actuator/loggers.html">Spring Boot OpenTelemetry Logging</a>
 */
@Component
class OpenTelemetryAppenderInitializer implements InitializingBean {

	private final OpenTelemetry openTelemetry;

	OpenTelemetryAppenderInitializer(OpenTelemetry openTelemetry) {
		this.openTelemetry = openTelemetry;
	}

	@Override
	public void afterPropertiesSet() {
		OpenTelemetryAppender.install(this.openTelemetry);
	}

}
With this configuration, both the Petclinic and the Petclinic Portal applications export their structured logs via OTLP. All application logs are now structured and sent directly to the OpenTelemetry Collector.
Configuring the Docker Environment
The endpoint in application.properties uses localhost:4318, which is correct when the applications run from Jmix Studio or through Gradle and the LGTM container runs on the same machine.
When the applications run as Docker containers, localhost refers to the application container itself. The Compose configuration therefore overrides the endpoint with the internal lgtm service address:
MANAGEMENT_OPENTELEMETRY_LOGGING_EXPORT_OTLP_ENDPOINT: http://lgtm:4318/v1/logsBoth application services use the same override and send their logs to the Collector inside the LGTM container.
Observability in Action
With everything configured, it’s time to bring the full observability setup to life.
-
Start PostgreSQL and the LGTM service from the sample project root:
docker compose -f docker/docker-compose.yaml up -d -
Start the Petclinic Backend and Portal applications from Jmix Studio. Their local configuration sends logs to
localhost:4318.Alternatively, build both application JAR files:
./gradlew -Pvaadin.productionMode=true --include-build jmix-petclinic-2 :jmix-petclinic-2:clean :jmix-petclinic-2:bootJar -x test --no-build-cache
./gradlew -Pvaadin.productionMode=true --include-build jmix-petclinic-portal :jmix-petclinic-portal:clean :jmix-petclinic-portal:bootJar -x test --no-build-cache
Then start the applications with the Compose
appprofile:docker compose -f docker/docker-compose.yaml --profile app up --build -d -
Open Grafana at http://localhost:3000 (username:
admin, password:admin) and navigate to Drilldown > Logs.
The Petclinic and Petclinic Portal applications now send their logs to the Collector inside the LGTM container. The Collector forwards the records to Loki, where they become available in Grafana.
To stop the infrastructure and any application containers, use:
docker compose -f docker/docker-compose.yaml downLog Overview in Grafana
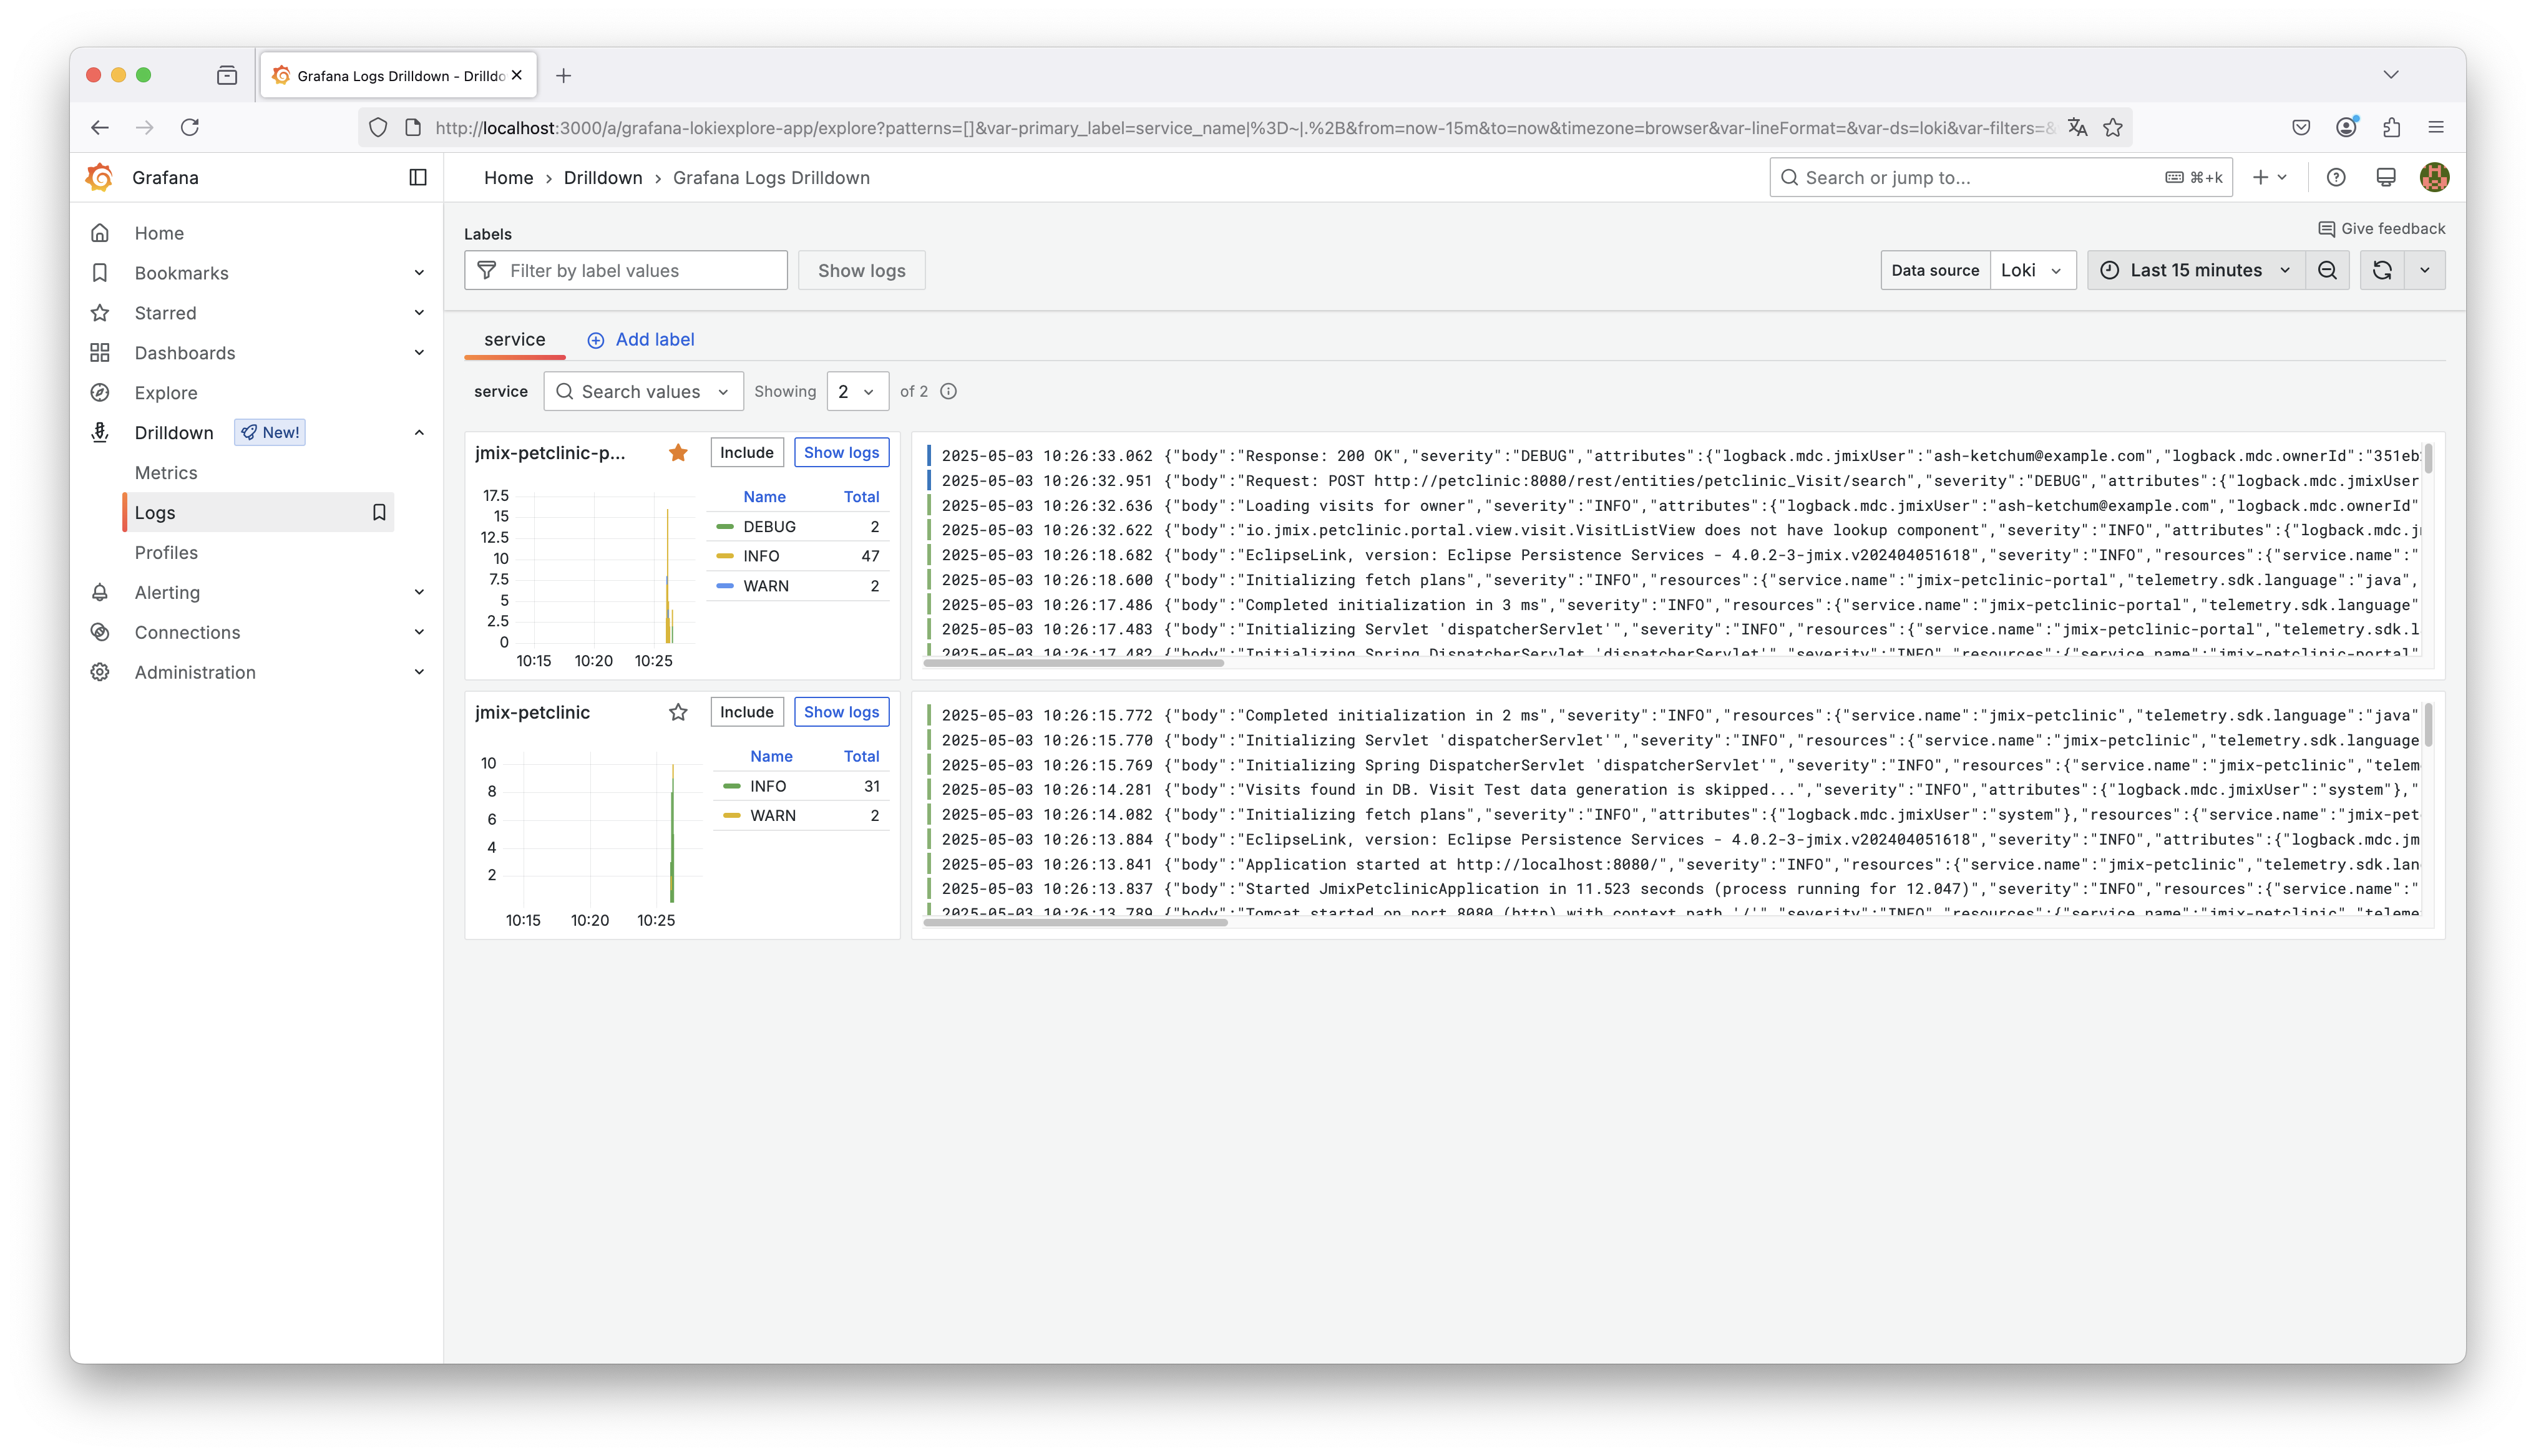
The screenshot above shows a unified view in Grafana’s Log UI. Each application appears as a separate service label (jmix-petclinic and jmix-petclinic-portal). As we can see both applications started logging into Loki.
This view highlights one of the key benefits of centralized logging: we can monitor all applications from a single place and quickly switch between them to inspect log streams, without jumping through multiple interfaces or terminals.
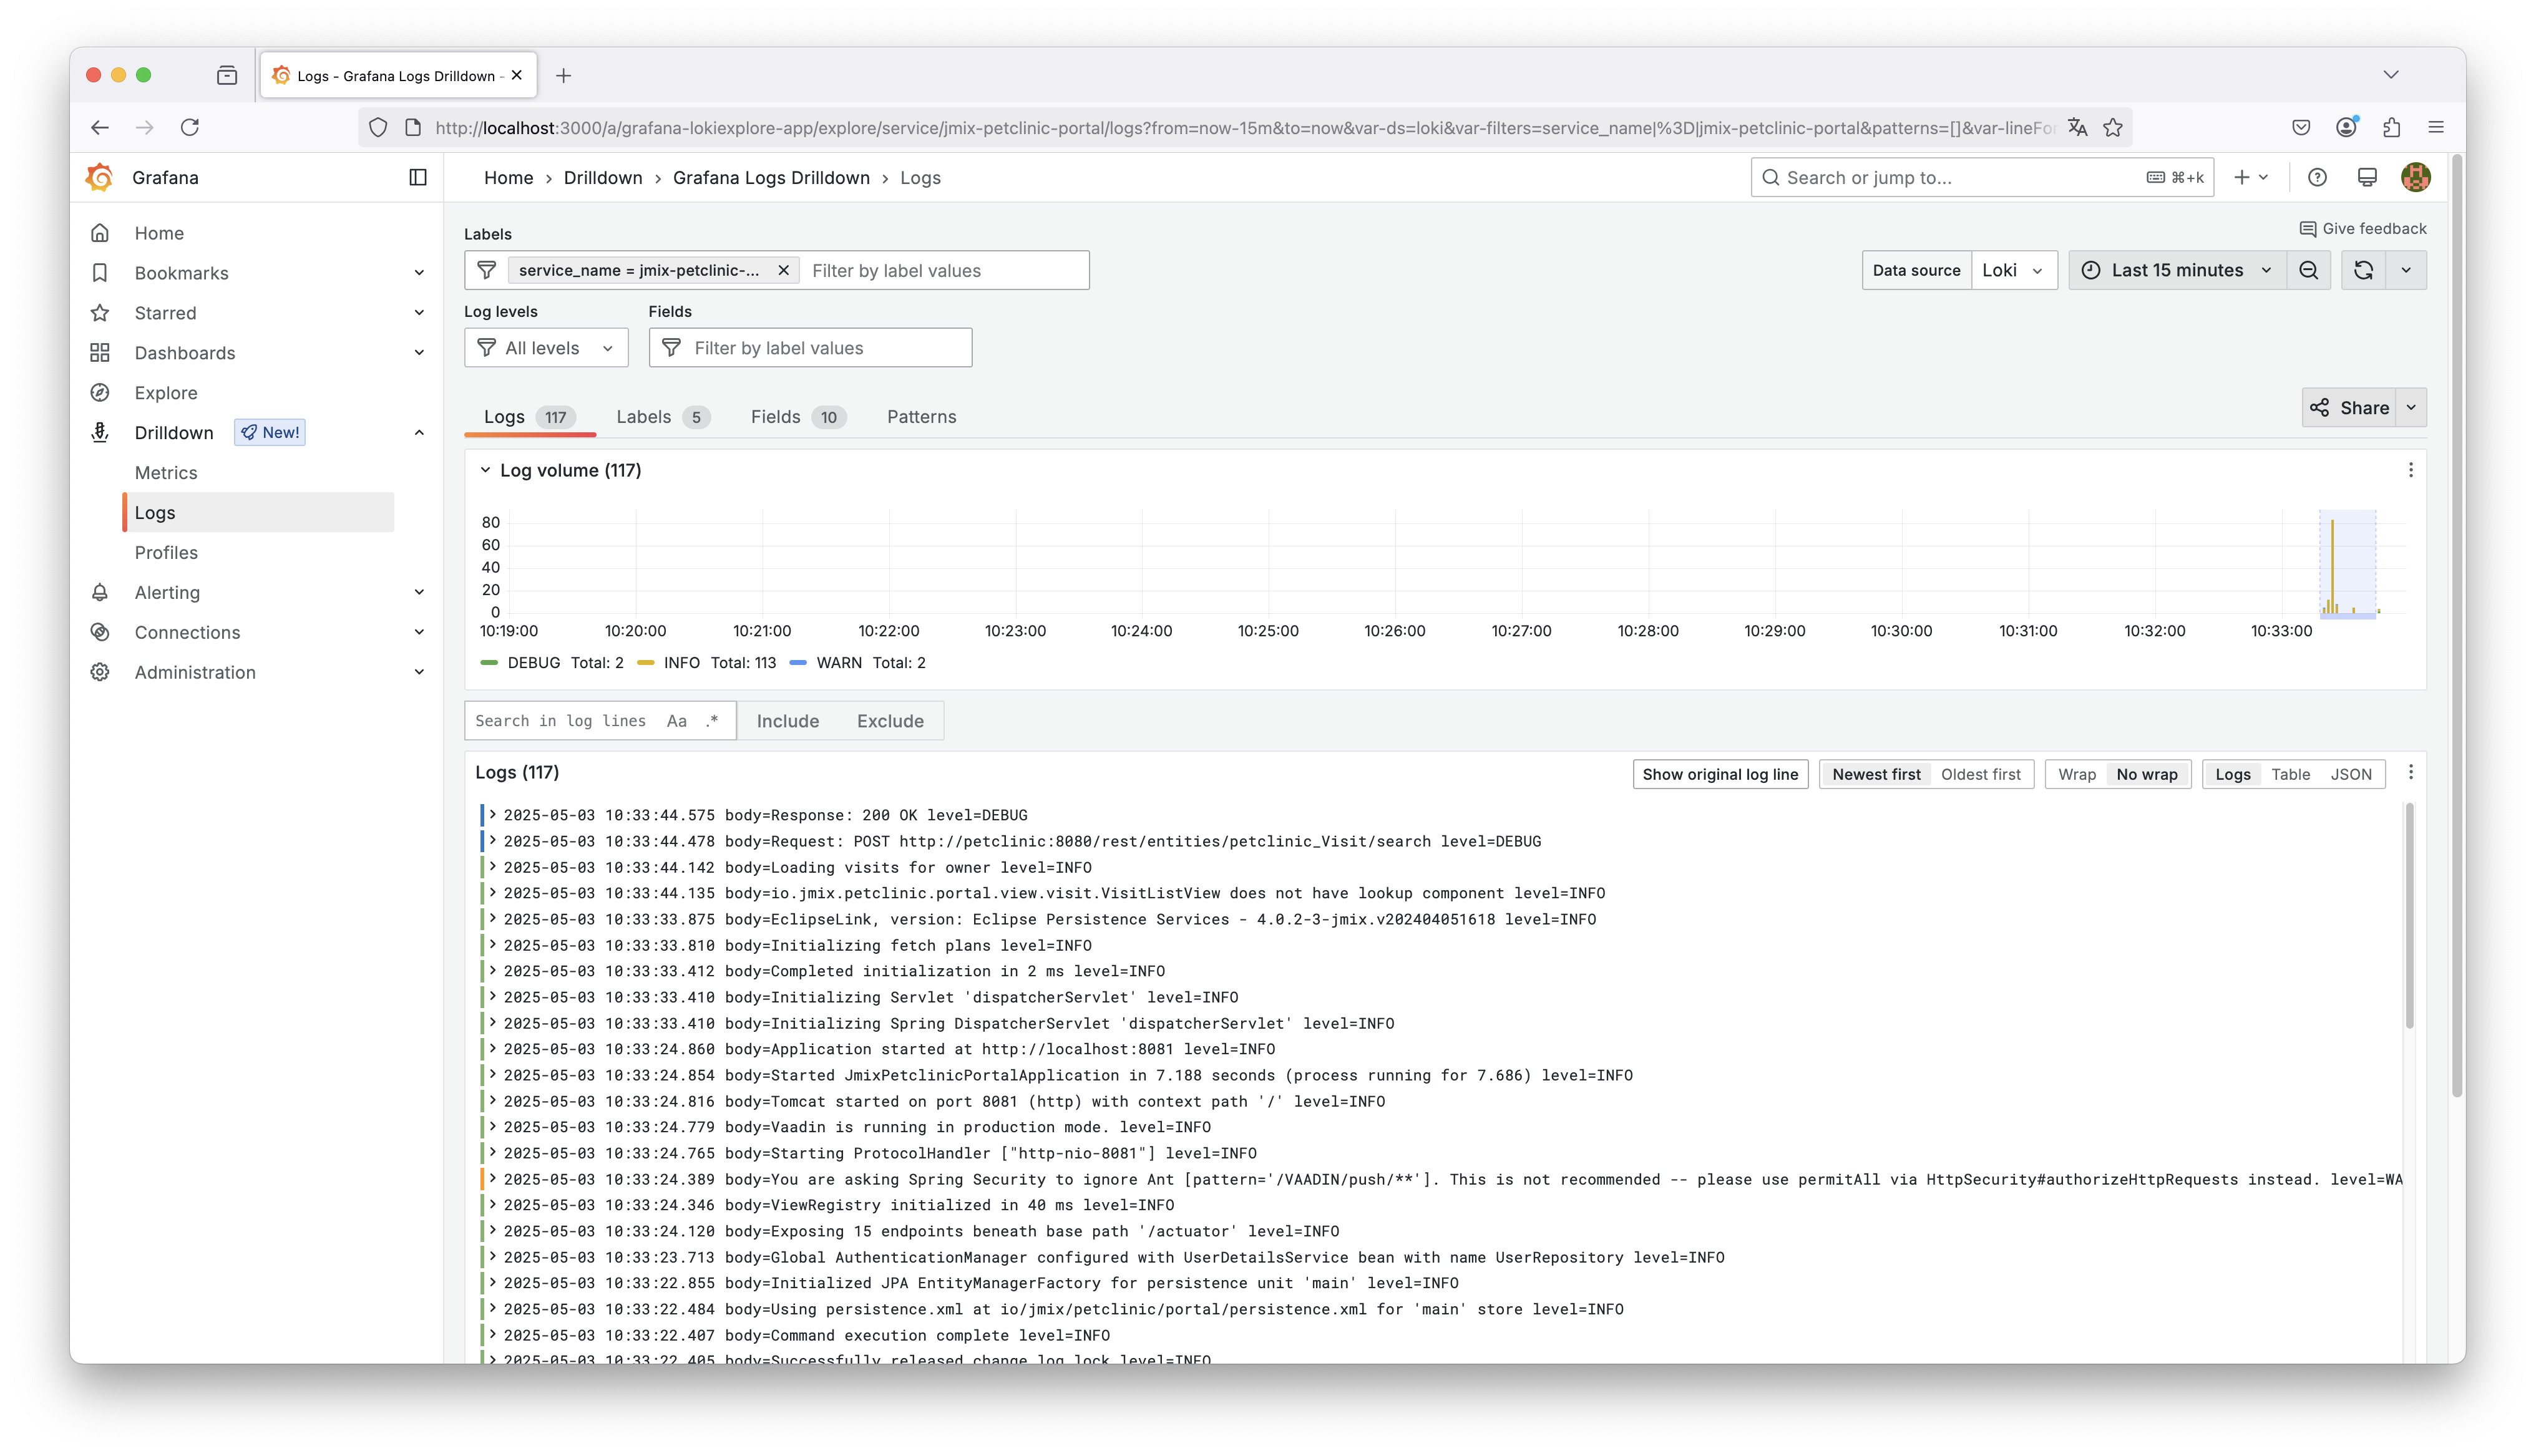
If we drill into one of the services, like jmix-petclinic-portal, Grafana shows a list of all log entries for that service.
The active filter at the top indicates that logs are scoped to this specific service (service_name = jmix-petclinic-portal).
We can search for keywords in the logs, apply field-based filters, and inspect individual entries.
Inspecting Log Entries
After getting an overview of all logs per application, we can drill down into the individual log entries to explore the structured data we’ve configured.
The screenshot below shows the details of a specific log line emitted by the jmix-petclinic-portal application:
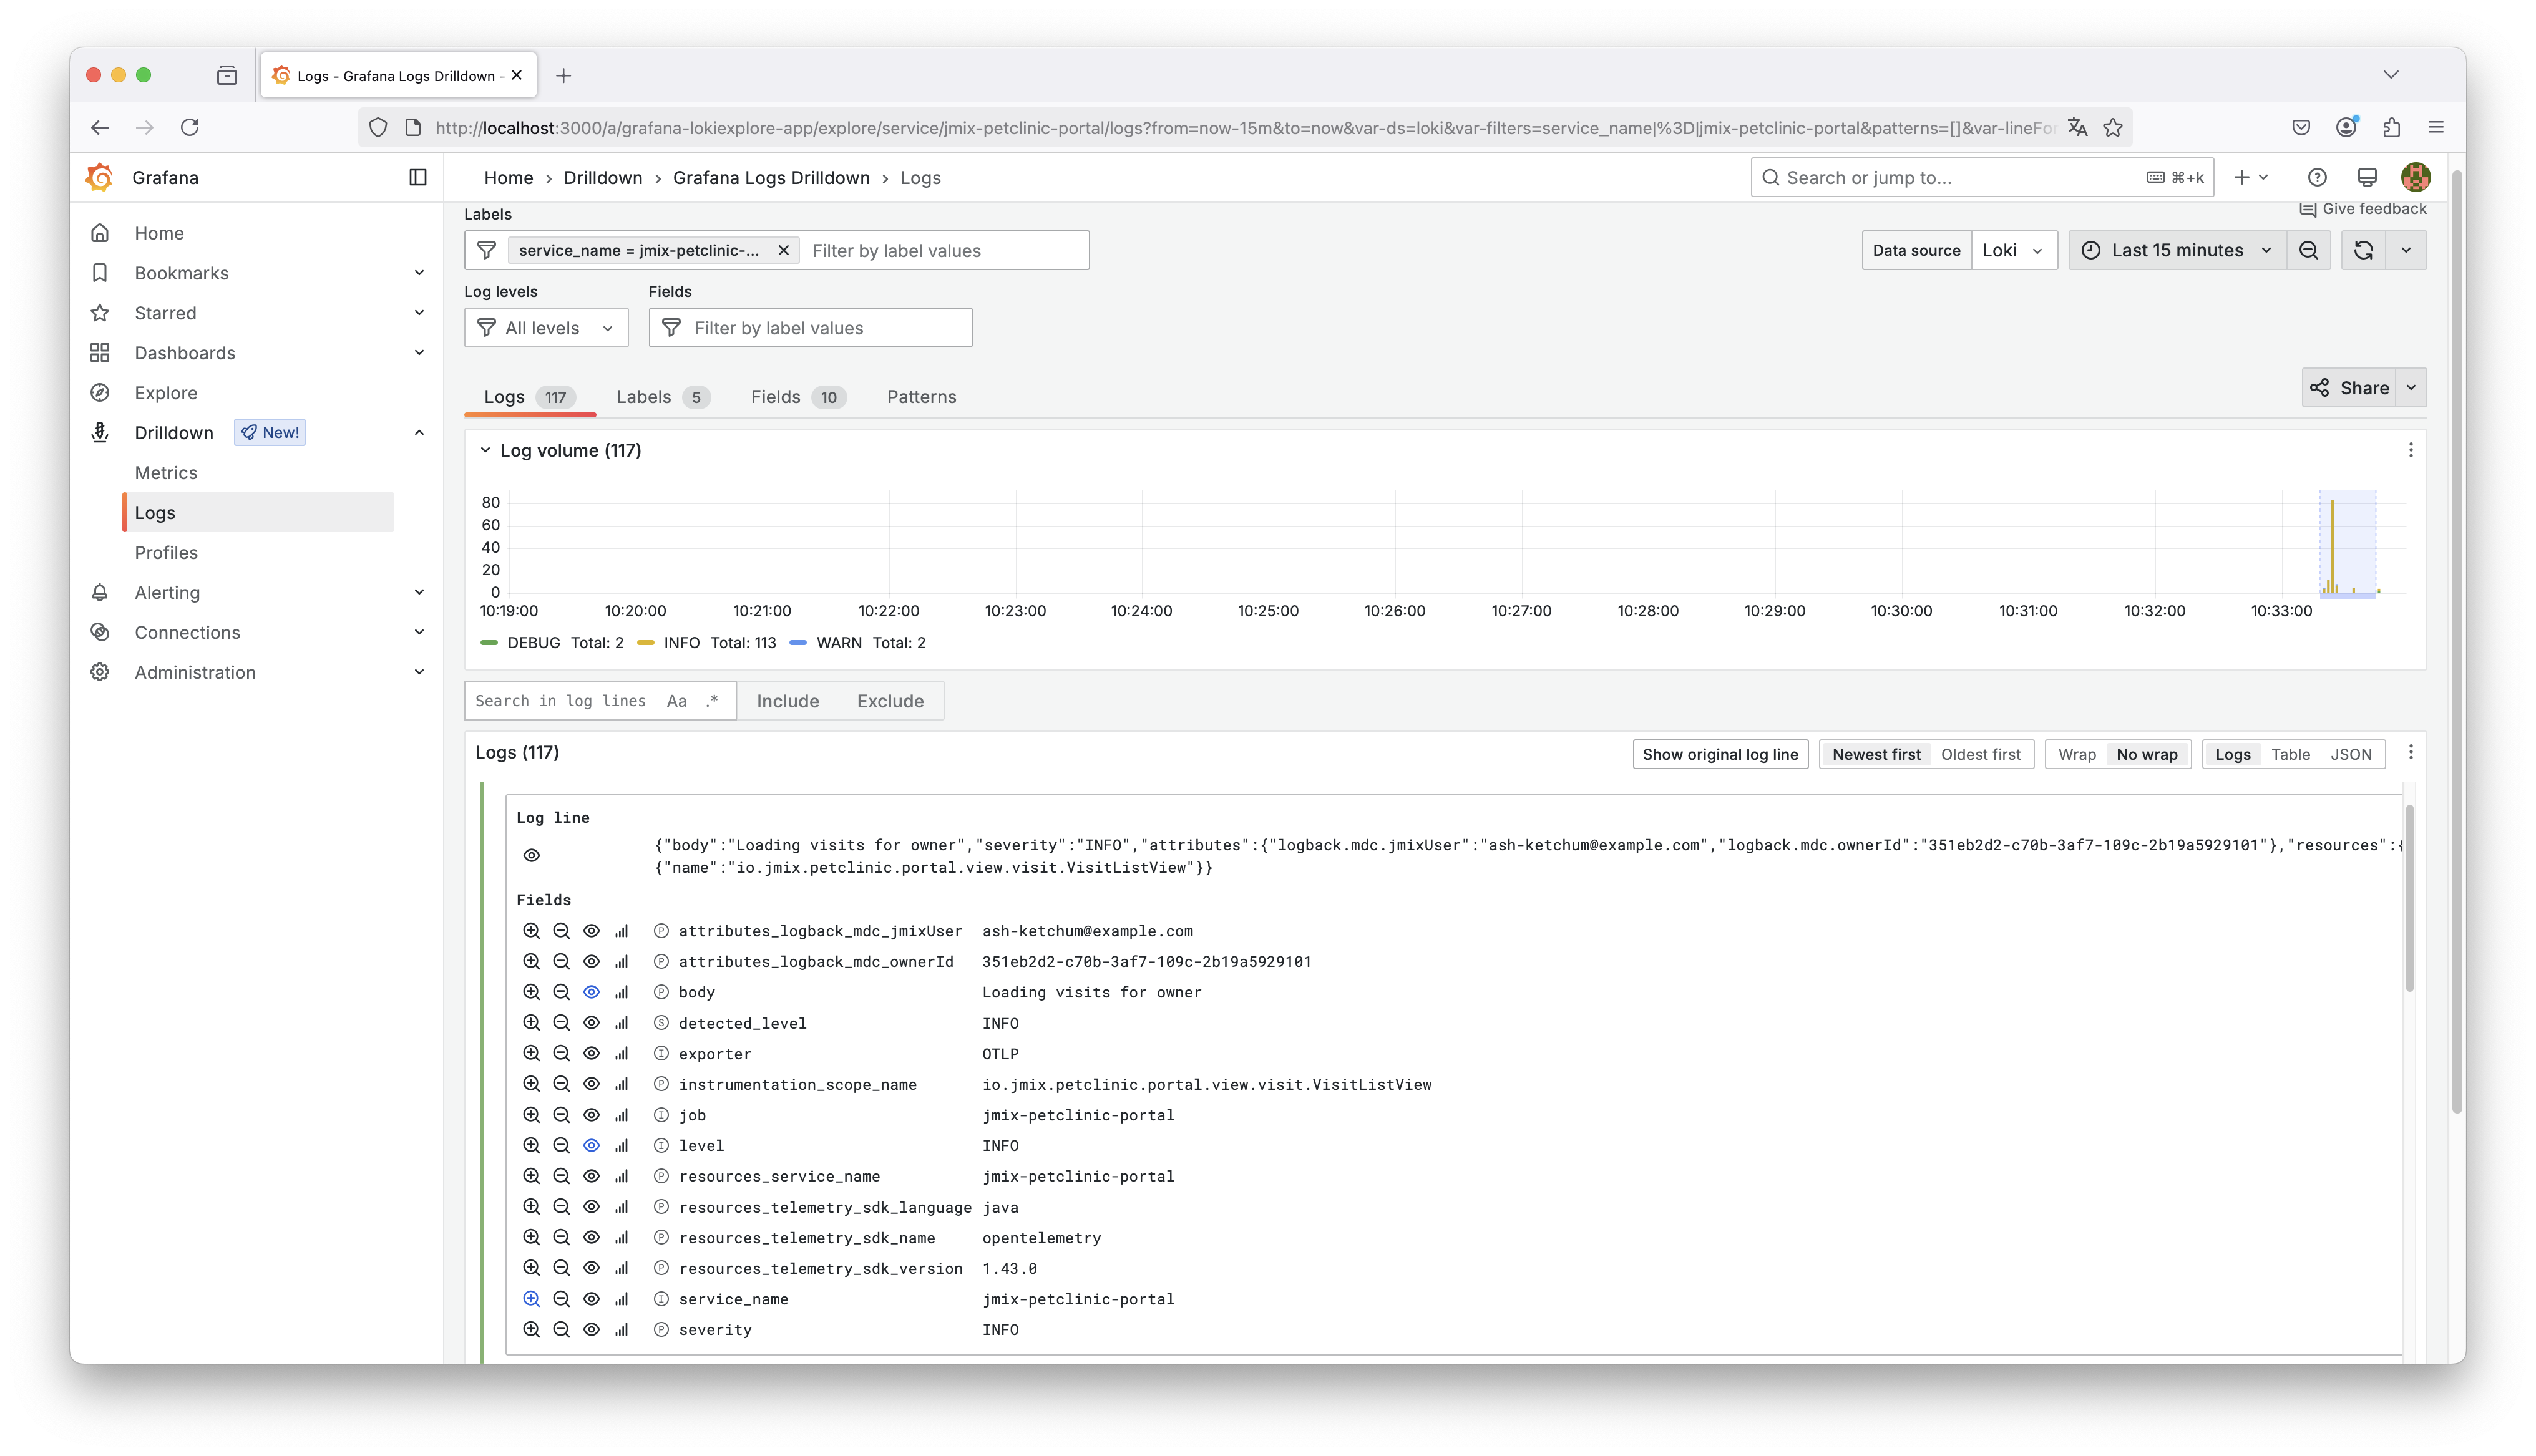
We can see the original log message body, along with various fields that were automatically extracted by the logging pipeline. These fields include standard ones like level, service_name, and timestamp, as well as application-specific MDC fields like attributes_logback_ownerId and attributes_logback_jmixUser.
The ownerId field was added in the source code before the log statement using MDC (Mapped Diagnostic Context):
@Route(value = "visits", layout = MainView.class)
@ViewController(id = "Visit.list")
@ViewDescriptor(path = "visit-list-view.xml")
@DialogMode(width = "50em")
public class VisitListView extends StandardListView<Visit> {

    // ...
    @Subscribe
    public void onInit(final InitEvent event) {
        String ownerId = currentUser().getOwnerId();
        MDC.put("ownerId", ownerId);
        log.info("Loading visits for owner");

        visitsDl.setParameter("ownerId", ownerId);
    }
}
By adding context such as the current user’s ID to each log entry, we enable precise filtering in Grafana — making it much easier to troubleshoot and trace events back to specific users or actions.
To dive deeper into MDC and how to enrich your logs with contextual information, see our introduction guide on logging: Application Logging in Jmix: Context Information in Logs.
While centralized logging gives us great visibility into logs across multiple services, we still lack a mechanism to link related log entries across applications. What’s missing is a correlation mechanism that ties together the full execution path of a request.
This is exactly the use case for distributed tracing — a topic we’ll dive into in the next part of this series.
Summary
In this guide, we used the Petclinic Backend and the consumer-facing Petclinic Portal to demonstrate centralized logging across two Jmix applications. Both applications convert their Logback events into structured OpenTelemetry log records and export them through OTLP.
The Grafana OpenTelemetry LGTM image provides the complete local pipeline in one container: the Collector receives the records, Loki stores them, and Grafana displays them. Its preconfigured pipeline and data sources remove the need to maintain separate Collector and Grafana configuration files for this development environment.
The OpenTelemetry Logback appender also preserves MDC attributes such as ownerId and jmixUser. These machine-readable fields make the logs easier to filter and connect to application context. Because the applications export through the vendor-neutral OTLP protocol, the same application configuration can target another compatible Collector or observability service.
