Logging
Logging in a Jmix application works the same way as in any Spring Boot application: logs are written through SLF4J and Logback. Log levels, the line format and output to a file are configured by the standard logging.* properties, see Spring Boot Logging.
Log Levels
A level is set in application.properties for a package or a class:
logging.level.io.jmix=info
logging.level.io.jmix.core.datastore=debug
A level can be overridden at startup without changing the file, through an environment variable. Dots in the category name are replaced with underscores:
LOGGING_LEVEL_IO_JMIX_CORE_DATASTORE=DEBUGMain Logging Categories
A new Jmix project contains the following settings in application.properties. To get detailed output, set the debug level for the category you need.
| Category | Output at the debug level |
|---|---|
|
SQL statements that EclipseLink sends to the database and their execution time, see SQL Statements in the Trace Context |
|
Data store operations: which entities are loaded and saved |
|
Access constraint checks. The |
|
All debug output of the framework |
|
Spring Security activity: authentication, filters, access decisions. Detailed output requires the |
The debug level for io.jmix and eclipselink.logging.sql writes every data operation and every SQL statement to the log and slows the application down, see Configuration for Production.
MDC: Log Record Context
The server handles requests of different users at the same time, and the log lines of different requests are mixed. To select the lines of one request, user or business object, every line needs an attribute to find them by. Passing such an attribute to every message manually is inconvenient, and it cannot be passed to framework lines, such as SQL statements, at all.
MDC (Mapped Diagnostic Context) solves this. It is a set of key-value pairs that Logback keeps for the current thread. A value put into MDC automatically gets into all log lines that the thread writes after that: the lines of your code, Jmix, EclipseLink and other libraries. In the line format, a value is output with the %X{key} pattern, and the %X pattern without a key outputs all pairs.
Values are put into MDC by Jmix, Micrometer Tracing and the application code:
| Key | Who puts it and when |
|---|---|
|
Jmix: the current username, see Username in MDC |
|
Micrometer Tracing: the IDs of the current trace and span, if tracing is enabled, see Trace IDs in Logs |
Custom keys |
The application code through |
Example: a service method confirms an order, and all lines written during the confirmation must contain the order number.
try (MDC.MDCCloseable ignored = MDC.putCloseable("orderNumber", order.getNumber())) {
    log.info("Confirming order");
    return dataManager.save(order); (1)
}| 1 | The DataManager log lines and SQL statements written while saving also get orderNumber. |
MDC.putCloseable() removes the value when the try block exits. If the value is not removed, it stays in the thread and gets into the lines of the next request that this thread handles.
MDC is bound to a thread and does not pass to other threads by itself. When code runs through @Async, ExecutorService or CompletableFuture, the values must be passed explicitly, for example through MDC.getCopyOfContextMap() and MDC.setContextMap().
Username in MDC
Jmix puts the current username into MDC under the jmixUser key. The value is set:
-
when handling REST API requests;
-
when running code on behalf of another user through
SystemAuthenticator; -
when running UI background tasks.
The standard Spring Boot line format does not output MDC. To show the username in every line, add it to the level format:
logging.pattern.level=%5p [%X{jmixUser:-}]Result:
2026-10-26T11:33:36.050+03:00 DEBUG [petclinic-portal] 18244 --- [nio-8080-exec-6] i.j.core.datastore.AbstractDataStore : loadList: store=main, metaClass=petclinic_Visit, ...Here petclinic-portal is the user on whose behalf another application called the REST API.
Trace IDs in Logs
If tracing is enabled in the application, Micrometer Tracing puts the IDs of the current trace and span into MDC, and Spring Boot outputs them in every log line. The output format is set by the logging.pattern.correlation property. A log line looks like this:
11:33:36.050 [http-nio-8080-exec-6] [traceId=b0adeb0946e1bc98796376a316e3561e, spanId=2ab2f07bc8c04434, jmixUser=petclinic-portal] DEBUG i.j.core.datastore.AbstractDataStore - loadList: store=main, metaClass=petclinic_Visit, ...The trace ID is the same for the whole user request, even if the request passed through several applications: an outgoing HTTP request passes it in the traceparent header, and the receiving application continues the same trace.
Selecting Log Lines by Trace ID
Having a line with an error, you select all other lines of this request by its traceId: what the user opened, what data was loaded, what SQL was executed, including in other applications. The lines of other requests executed at the same time do not get into the selection. In Grafana Loki, this selection is done with a LogQL query:
{service_name=~"jmix-petclinic.*"} | trace_id="b0adeb0946e1bc98796376a316e3561e"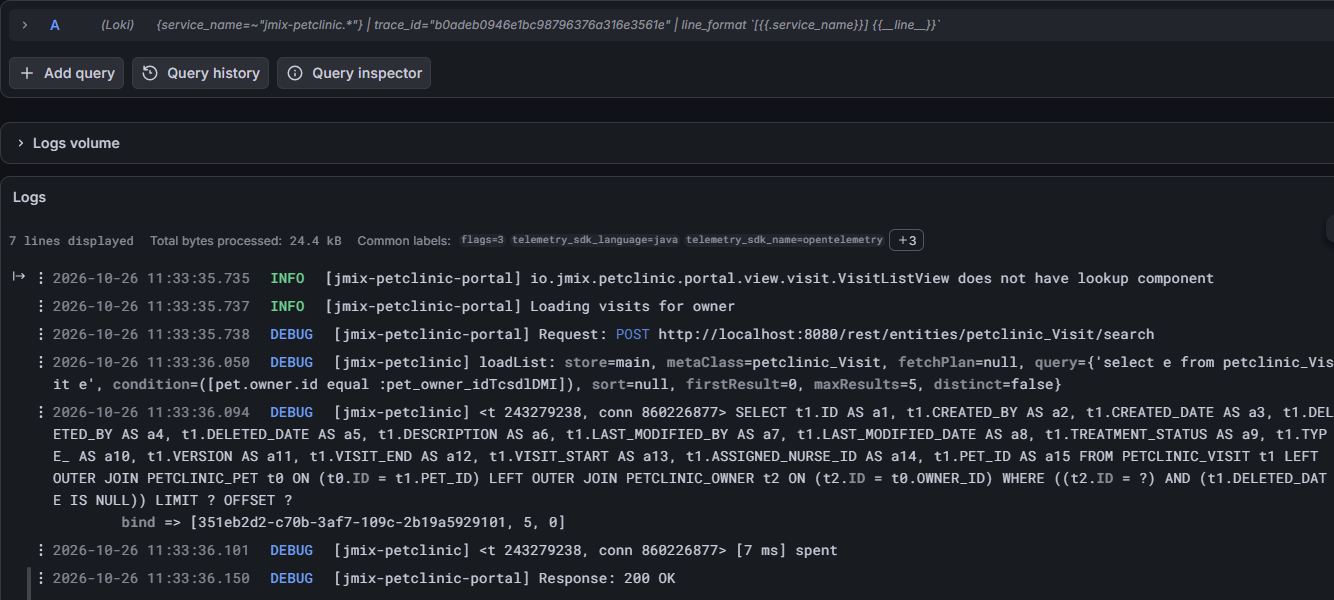
The selected lines of the portal and the backend follow in the order of execution: the portal opens a view and sends a REST request, the backend loads visits and executes an SQL statement with parameters, the portal receives the response.
Moving Between Log Lines and Traces
The details of a log record in Grafana show the MDC values as attributes (jmixUser, trace_id, span_id), and the trace ID is a link: it opens the trace with the duration of every operation. In the opposite direction, a span of the trace opens the log lines written during this span. Investigating a complaint about a slow view starts with a trace, and investigating an error in the log starts with the log.
Selecting Log Lines for Traces That Were Not Kept
The IDs are written to the lines also for requests whose traces were not included in the sampled share. The lines of such a request can still be selected by traceId, in Loki or with a plain search in the log file.
SQL Statements in the Trace Context
If the debug level is set for the eclipselink.logging.sql category, EclipseLink writes every SQL statement with parameter values to the log, and after the execution, the statement time:
<t 653221857, conn 549323368> SELECT COUNT(ID) FROM PETCLINIC_VISIT WHERE (((ASSIGNED_NURSE_ID = ?) AND (TREATMENT_STATUS <> ?)) AND (DELETED_DATE IS NULL)) LIMIT ? OFFSET ?
	bind => [60885987-1b61-4247-94c7-dff348347f93, DONE, 1, 0]
<t 653221857, conn 549323368> [1 ms] spent
Here t is the hash code of the thread, and conn is the hash code of the database connection. The time covers preparing the statement, executing it and reading the result, but not waiting for a connection from the pool. The line with the time is added by the EclipseLink build that Jmix uses.
SQL lines, like other log lines, contain the trace and span IDs. With data access spans enabled, the span ID is the span of the Jmix operation during which the statement was executed, for example load list of entities. So the trace shows which SQL statements each data loading produced, see Data Access.
The number of SQL statements reveals extra database calls. The following LogQL query finds the traces with the largest number of SQL statements in the last 5 minutes:
topk(10, sum by (trace_id) (count_over_time(
  {service_name="jmix-petclinic"} != "spent" | scope_name="eclipselink.logging.sql" [5m]
)))
Here scope_name is the logger category: filtering by it leaves only SQL lines, and the != "spent" condition excludes the lines with the execution time. As a result, each trace gets the number of SQL statements executed in it. If you group by span_id instead of trace_id, the query shows how many SQL statements each data loading operation executed.
The two groupings together distinguish two kinds of extra queries:
| Result | What it means |
|---|---|
A trace has many SQL statements, and each loading operation has one |
The code performs many separate loads through |
One loading operation has many SQL statements |
EclipseLink loads related entities with separate queries. The cause is found in the fetch plan of the loading |
Each trace_id or span_id forms a separate series in the query, and Loki limits their number in one query to five hundred by default (the limits_config.max_query_series parameter). If the limit is exceeded, reduce the window, for example to [1m], or narrow the selection, for example by user: | jmixUser="admin".
Configuration for Production
-
The permanent log level is
infoorwarn; thedebuglevel is enabled for a particular category for the time of the investigation. The level is changed without a restart through the Actuatorloggersendpoint, see Spring Boot Loggers. Theloggersendpoint changes the application settings, so it is closed to anonymous access. -
SQL output (
eclipselink.logging.sql) is not enabled permanently: the text of every database query is written to the log, and the log volume grows many times. For continuous monitoring, data loading spans are enough: they record the JPQL query text and its parameter values, and the duration of data operations is visible in thejmix.data.*metrics. SQL output is enabled for the time of the investigation, see SQL Statements in the Trace Context. -
Detailed logging of every step is not needed: the lines of one request are selected by
traceId, see Trace IDs in Logs. -
The retention period of logs in Loki is set by the
limits_config.retention_periodparameter withcompactor.retention_enabledturned on.
Centralized Log Collection
When the application runs in several instances or consists of several services, logs are collected in a common storage system, such as Grafana Loki or Elasticsearch. The OpenTelemetry Logback appender sends logs over the OTLP protocol. The appender passes trace IDs and, if its settings say so, MDC values as record attributes, by which logs are then filtered.
In Grafana, logs from Loki are browsed without writing queries in Drilldown → Logs: logs are grouped by service and level, and the selection is narrowed by attributes, such as the username from MDC. For complex selections, Explore with LogQL queries is used.
The start page of Drilldown → Logs shows all applications that send logs: for each one, a histogram of the number of lines by level and the latest lines. The level is shown in color, so a spike of warnings or errors is visible at once.
For example, while the database is stopped, the histogram of the backend (jmix-petclinic) gets WARN lines from the HikariCP connection pool, and the histogram of the portal gets warnings at the same moments.
The page of one application shows a histogram of all its lines by level and the lines themselves. In the example with the stopped database, the histogram shows a gap: requests waited for a connection and wrote no lines. Right after the gap come the warnings of the connection pool. Above the histogram, you select levels, fields and a text filter.
Step-by-step setup with an example of two applications and Grafana is described in the guides: