Profiling
Logs, metrics and traces show what happened and how long it took. A profile shows why a span took long: in which methods the application spends CPU time, where it allocates memory and where threads wait for locks.
Profiles are stored by Pyroscope, a continuous profiling system from the same Grafana Labs set; it is also preconfigured in the grafana/otel-lgtm Docker image. Profiles are viewed in Grafana, in Drilldown → Profiles. The agent parameters and the Pyroscope deployment are described in the Pyroscope documentation.
Adding the Agent
Profiles are collected by the Pyroscope Java agent, a JAR file that the JVM loads at application startup with the -javaagent parameter; the code and dependencies of the application do not change. The agent samples thread call stacks at short intervals, every 10 ms by default, and sends the collected data to Pyroscope every 10 seconds. See the Pyroscope documentation for details.
The agent samples stacks with the async-profiler library, which exists only for Linux and macOS. On Windows, the application with the agent is run in a Docker container or in WSL.
Reading a Profile
A flame graph in Grafana is built from top to bottom: the top row is the whole profile time (total), and under each block are the functions it called. The block width is the share of CPU time that the function took together with everything it called. For example, in the CPU profile of Petclinic for 15 minutes of load, about 170 rows of Tomcat, Spring and Vaadin frames lie above the Jmix code, see Hiding Service Frames. To get to the Jmix code, select the ServerRpcHandler.handleRpc block with the Focus block command and highlight Jmix methods by searching for jmix. Under the Vaadin navigation frames are View.beforeEnter, the view lifecycle observation, the data loader and UnconstrainedDataManagerImpl.loadList. In this navigation branch, of the 6.6 minutes of CPU time taken by View.beforeEnter, 6.4 minutes were spent on data loading (UnconstrainedDataManagerImpl.loadList). The profile was collected while running in Docker with the Pyroscope agent.
Profile of a Vaadin Request
User actions come to the application as Vaadin requests to a single URL and are not distinguished in Spring Boot metrics and traces, see Observations of Data Loading, Views and UI Actions.
In a profile, handling a Vaadin request looks like a deep stack: a Tomcat thread, Spring Security filters, VaadinServlet.service, UidlRequestHandler.synchronizedHandleRequest, ServerRpcHandler.handleRpc, AbstractNavigationStateRenderer for navigation, and only under them the Jmix methods and the code of application views (io/jmix/flowui/…, the application package). So when reading a UI profile, Jmix and application methods are found by package name, for example by searching for jmix in the flame graph, or the service frames are hidden, see Hiding Service Frames.
Hiding Service Frames
In the profile of a Vaadin request, there are several dozen Tomcat, Spring and Vaadin frames above the Jmix code. Time can be spent in them too, for example in Spring Security filters, but in most cases they get in the way of reading the profile. The Grafana flame graph cannot hide frames by package name. Its closest options are these buttons:
-
Collapse all groups collapses a chain of frames of the same width into one row with the number of frames, for example
(28) com/vaadin/flow/server/communication/ServerRpcHandler.handleRpc; -
Focus block in the block menu makes this block the root of the graph;
-
Sandwich view in the block menu shows all calls of the function, from whatever stacks they come, and what it calls.
Hiding frames by pattern is available in the pprof tool. Export the profile in Drilldown → Profiles: the Export profile data → pprof button saves the service profile for the selected interval. Then open the file in the pprof web UI with filters:
go tool pprof -http=:8081 \
  -show_from='io/jmix/flowui' \
  -hide='^(java|jdk|sun|org/apache|org/springframework|com/vaadin|io/micrometer)/' \
  profile.pb.gz
The -show_from parameter drops all frames above the first frame whose name matches the pattern, so the graph starts right at the Jmix UI code. For REST API requests and services, specify the application package instead of io/jmix/flowui. The -hide parameter removes frames matching the pattern from the middle of stacks and assigns their own time to the nearest visible caller. The same filters are set in the REFINE menu of the web UI (Focus, Ignore, Hide, Show, Show from), and a set of filters is saved with the CONFIG → Save as command. Without Go installed, pprof is run in a container:
docker run --rm -p 8081:8081 -v "$PWD:/p" golang:1.23-alpine \
  go tool pprof -no_browser -http=0.0.0.0:8081 /p/profile.pb.gz
The export from Drilldown merges the smallest profile nodes into the other node, so for a detailed investigation, export the profile for a short interval.
With these filters, the graph of the Petclinic CPU profile starts with View.beforeEnter: under it are the view lifecycle observation, the data loader and UnconstrainedDataManagerImpl.loadList. In 4 minutes of load, loadList took 94 s of CPU time: 48 s of them are events after loading (AbstractDataStore.fireEvent, mostly JpaLazyLoadingListener.afterEntityLoad), and 29 s are query execution (JpaDataStore.loadAll). In the Grafana flame graph, this ratio is split across many stacks under Tomcat and Spring frames and is not visible.
Vaadin Session Lock
Vaadin handles the requests of one user session sequentially: before handling, a request acquires the session lock (VaadinService.lockSession, VaadinSession.lock). While one request of the session is running, the other requests of this session wait: for example, requests from other browser tabs of the same user or push connection requests.
Such waiting does not use CPU time and is therefore not visible in the CPU profile. It is shown by the lock profile of the block type: the waiting threads are visible in the VaadinService.lockSession → VaadinSession.lock → ReentrantLock.lock stack. For example, when four tabs of one session repeatedly opened a view at the same time, and the data loading of the view took about 400 ms, the threads waited for the session lock for about 2.6 minutes in total over 3 minutes.
A long operation in a view event handler holds the session lock for its whole duration. Such operations are run in background tasks: they run outside the session lock, and the UI stays responsive.
Linking Profiles to Spans
By itself, a profile is linked to metrics and traces only by the service name and time: the agent samples the stacks of the whole JVM without distinguishing requests. To get the profile of a particular request, the span processor from the Pyroscope io.pyroscope:otel library is added to tracing. While the root span of a request is running, the processor labels the sampled stacks with the ID of this span and writes the ID to the pyroscope.profile.id span attribute.
implementation 'io.pyroscope:otel:2.1.4'@Bean
public SpanProcessor pyroscopeSpanProcessor() {
return new PyroscopeOtelSpanProcessor();
}Spring Boot adds SpanProcessor beans to the OpenTelemetry configuration automatically. The Pyroscope Java agent is added as described in the Adding the Agent section.
In Grafana, the details of such a span contain the Profiles for this span button and a flame graph of the CPU time spent on this request. For this, the link to profiles (Trace to profiles) is configured in the Tempo data source: the Pyroscope data source and the profile type are specified. In the grafana/otel-lgtm image, this link is not configured; set it in the Tempo data source settings, see Configure trace to profiles.
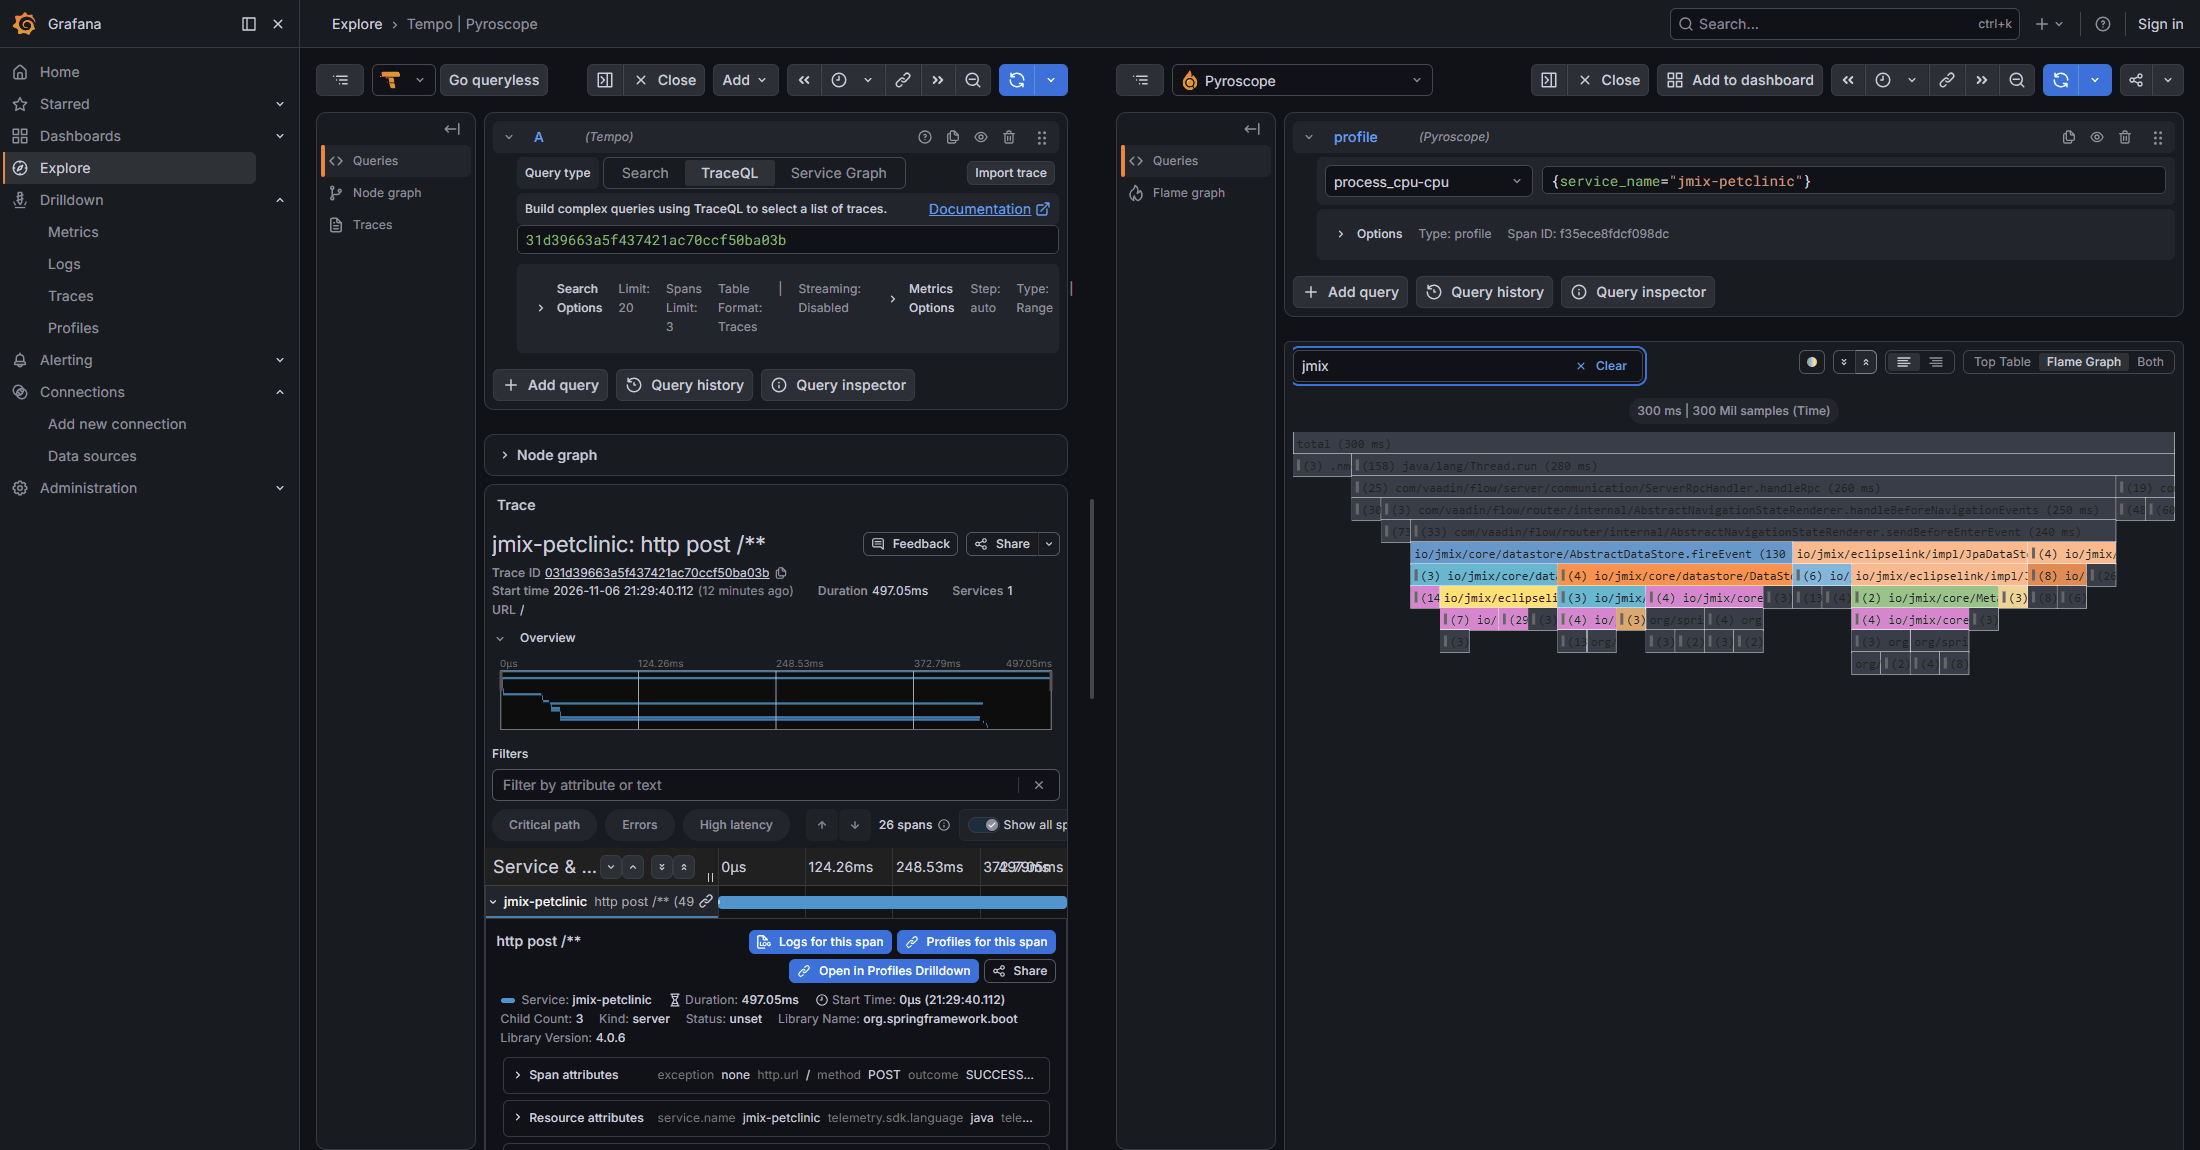
For example, a root span of a request that took 497 ms has a CPU profile with 300 ms of CPU time. The Collapse all groups button collapses the chains of Tomcat, Spring and Vaadin frames into rows with the number of frames, for example (158) java/lang/Thread.run, and searching for jmix highlights Jmix methods. The widest Jmix branch of this profile is AbstractDataStore.fireEvent (130 ms), the processing of loaded entities.
Memory allocation events are also labeled with the span ID. To see how much memory the request allocated and where, switch the profile type in the opened Pyroscope query to memory → alloc_in_new_tlab_bytes.
For the same request, the memory allocation profile for the time of its root span shows that the request allocated 175 MiB, of which 89 MiB went to processing loaded entities (AbstractDataStore.fireEvent and JpaLazyLoadingListener called from it).
Linking profiles to spans has limitations:
-
Going from a span in Grafana opens the profile type specified in the link to profiles, for example the CPU profile. Other types are selected in the opened query.
-
By default, only root spans get the ID: an incoming HTTP request, including one that came from another service. Child spans, such as
view lifecycleorload list of entities, do not get a separate profile, and their methods are included in the root span profile. Changing this with thePyroscopeOtelConfiguration.Builder.setRootSpanOnly(false)setting is not recommended: a thread has one label, and a finished child span resets it, so the rest of the parent span work no longer gets into its profile. The share of a child operation in the root span profile is shown by Focus block or Sandwich view on its method. -
The span label is bound to a thread. Work that the request passes to other threads, such as background tasks, is not included in the span profile.
-
A span shorter than the sampling interval (10 ms) may get no samples at all.
-
If Pyroscope rejects the agent uploads because of its limits, the span samples are lost with them: the Profiles for this span button is there, but the profile is empty (
0 samples). The limits are described in the Configuration for Production section.
Configuration for Production
By default, the Pyroscope Java agent collects only the CPU profile. Memory allocation and lock profiles are enabled by the PYROSCOPE_PROFILER_ALLOC and PYROSCOPE_PROFILER_LOCK environment variables. Their values determine how often the agent records events: for memory, the amount of allocations between two records; for locks, the minimum waiting time from which a lock gets into the profile. For continuous operation, start with the 512k and 10ms values. The 0 value records every event and increases the load on the application. See the Pyroscope documentation.
Pyroscope limits the size and rate of received profiles. The default values are 4 MB per profile after decompression (limits.max_profile_size_bytes) and 4 MB/s of ingestion (limits.ingestion_rate_mb; the allowance for short bursts is limits.ingestion_burst_size_mb). Under load, a profile that the agent sends every 10 seconds with memory and lock profiles enabled can exceed these limits. Pyroscope then rejects the upload with the 422 code, and the agent writes Error uploading snapshot: 422 to the application log with the decompressed size exceeds maximum allowed size or push rate limit … exceeded message. For example, with a load of 30 users and the 512k and 10ms values, the agent got this error on every upload, once every 10 seconds. Rejected profiles are lost completely, so when these messages appear, increase the Pyroscope limits or reduce the number of collected events.
The retention period of profiles in Pyroscope is set by the limits.retention_period parameter (31d by default), see Pyroscope configuration parameters.
See Also
-
Performance Diagnostics: the order of investigating performance problems