Metrics
Metrics of a Jmix application are collected through Micrometer, as in any Spring Boot application. Spring Boot Actuator provides metrics of the JVM, CPU, thread pools, HTTP requests and database connection pools, see Spring Boot Metrics. This page describes the metrics that Jmix adds and their export.
Metrics are numeric values that the application records continuously and that take little storage space. That is why they are collected all the time, including on production servers. The accumulated metrics show how performance changes from version to version; alerts about abnormal situations are based on them; during an incident they show when and in which part of the application the problems started, and the investigation continues with traces and logs.
Enabling Jmix Metrics
Metrics of Jmix observations are recorded, and all metrics become available for export, only if Spring Boot Actuator is added to the project:
implementation 'org.springframework.boot:spring-boot-starter-actuator'Metric groups are enabled by properties:
| Property | Default | Metrics |
|---|---|---|
|
|
|
|
|
|
|
|
Timers and Their Series
All Jmix metrics are timers. The jmix.data.* and jmix.ui.* metrics come from Micrometer observations, and each observation produces two metrics:
-
A Timer with the observation name, for example
jmix.ui.views. It counts completed operations: their number, total and maximum duration. Theerrortag contains the exception class name, ornoneif the operation completed without an error. -
A LongTaskTimer with the
.activesuffix, for examplejmix.ui.views.active. It shows the operations that are running at the moment: their number and current duration.
In Prometheus, dots in names are replaced with underscores, and the unit and the series type are added to the name. For example, the jmix.ui.views Timer produces the following series:
| Series | Value |
|---|---|
|
The number of completed operations |
|
The total duration of operations in seconds |
|
The maximum duration in the last interval |
The average duration in an interval is calculated by dividing the increase of the sum by the increase of the count:
rate(jmix_ui_views_seconds_sum[5m]) / rate(jmix_ui_views_seconds_count[5m])Percentiles and histograms are enabled by standard Spring Boot properties, see Configuring Metrics with Spring Boot.
The other metrics on this page are described by name, without listing their series.
Configuring Metrics with Spring Boot
Jmix metrics are regular Micrometer metrics, so all standard Spring Boot settings apply to them. The properties accept a metric name or its beginning: a value for jmix applies to all Jmix metrics, a value for jmix.ui.views applies to one metric. For the full list of properties, see Customizing Individual Metrics.
Percentiles
An average hides rare slow operations, while a percentile shows the time within which a given share of operations completes. The management.metrics.distribution.percentiles-histogram property enables a histogram, from which Prometheus calculates a percentile with the histogram_quantile() function and aggregates it over all application instances. The management.metrics.distribution.percentiles property makes the application itself calculate the given percentiles; these cannot be aggregated across instances. A histogram adds several dozen series to each series, so it is enabled only for the metrics that need it.
management.metrics.distribution.percentiles-histogram.jmix.ui.data=trueFor example, when the 95th percentile of the visitsDl loader briefly grew to 295 ms, the average duration of the beforeShow stage of the same view grew only from 80 to 113 ms. Queries for such graphs are given in the Visualization in Grafana section.
Disabling and Filtering
The management.metrics.enable property disables individual metrics, and management.observations.enable disables whole observations, together with their spans. The management.metrics.observations.ignored-meters=long-task-timer property disables the LongTaskTimer of all observations and almost halves the number of series. The management.metrics.tags property adds common tags to all metrics, for example the application name.
Rules that cannot be expressed with properties are defined by MeterFilter beans: remove a metric by a condition, remove or rename a tag, limit the number of tag values. Observations are filtered by ObservationPredicate and ObservationFilter beans.
Data Access Metrics
Enabled by the jmix.core.data-observation-enabled=true property.
jmix.data.load
The duration of read operations through DataManager, and therefore through Jmix repositories, UI data loaders and the REST API. Direct queries through EntityManager and JDBC are not measured.
| Tag | Value |
|---|---|
|
The operation: |
|
The entity name, for example |
jmix.data.save
The duration of saving and removing entities through DataManager and all the paths on top of it listed for jmix.data.load.
| Tag | Value |
|---|---|
|
Always |
|
The data store name, for example |
Loading Rate and Duration by Entity
The jmix.data.load metric with the entity.name and method tags shows which entities are loaded most often and take the longest. The loading rate by entity:
sum by (entity_name, method) (rate(jmix_data_load_seconds_count[5m]))The average loading duration by entity:
sum by (entity_name) (rate(jmix_data_load_seconds_sum[5m]))
/
sum by (entity_name) (rate(jmix_data_load_seconds_count[5m]))
If an entity is loaded much more often than the views that show it are opened, it is probably loaded in a loop (the N+1 problem). The spans and the SQL lines in the log show which queries are executed, see Data Access.
Database Connection Pool
Spring Boot publishes the metrics of the HikariCP connection pool with the pool tag, which holds the pool name. They show whether data access operations wait for a free connection:
| Metric | Value |
|---|---|
|
The number of connections in use at the moment |
|
The maximum pool size |
|
The number of threads waiting for a free connection |
|
The time of waiting for a connection (Timer) |
|
The time a connection was in use (Timer) |
|
The number of connection requests that timed out |
If hikaricp.connections.pending is greater than zero and hikaricp.connections.active equals the maximum pool size, operations wait for a connection. The waiting time is included in the duration of data loading spans, but not in the time of SQL statements in the log. The pool can be exhausted by slow queries, long transactions or a too small pool size. The pool size of the main data store is set by the main.datasource.hikari.maximum-pool-size property.
UI Metrics
Enabled by the jmix.ui.ui-observation-enabled=true property.
In a Vaadin application, the standard Spring Boot http.server.requests metric does not show which view opens slowly or which user action takes long. Vaadin sends all user actions as requests to a single URL, and in this metric they form one series POST /**. The jmix.ui.* metrics distinguish views, their lifecycle stages, data loaders and actions.
If the ID of a view, fragment or component is not defined, the tag gets the N/A value.
jmix.ui.views
The duration of view lifecycle stages.
| Tag | Value |
|---|---|
|
The stage: |
|
The view ID, for example |
|
The fully qualified name of the view class |
A layout view, such as MainView, is not created again when the user navigates between nested views, but it goes through the beforeShow, ready, beforeClose and afterClose stages. So a layout has many more ready stages than create stages, and the average opening time is calculated for each stage separately rather than by dividing the total time of all stages by the number of ready stages.
jmix.ui.fragments
The duration of fragment lifecycle stages.
| Tag | Value |
|---|---|
|
The stage: |
|
The fully qualified name of the fragment class |
|
The fragment ID in the descriptor |
|
The ID of the view that contains the fragment |
jmix.ui.data
The duration of data loader stages.
| Tag | Value |
|---|---|
|
The stage: |
|
The loader ID. Loaders without an explicit ID get |
|
The view ID |
|
The fragment ID, if the loader is declared in a fragment |
jmix.ui.actions
The duration of UI action execution. The AI Chat, Tabbed Mode and Dynamic Model add-ons record their actions in the same metric.
| Tag | Value |
|---|---|
|
The action ID |
|
The ID of the component the action is bound to |
|
The view ID |
|
The fragment ID, if the action is declared in a fragment |
jmix.EmailSender.send
The duration of sending an email message through EmailSender of the Email add-on. A regular Timer without its own tags.
User and Tenant Tags
In applications with multitenancy, when the jmix.core.use-user-info-for-observation property is enabled (the default), the jmix.data.* and jmix.ui.* metrics get the jmix.user.tenantId tag with the tenant ID of the current user. The username is not added to metrics, it is written to spans only.
Legacy UI Metrics Schema
Before version 3.0, the jmix.ui.views and jmix.ui.data metrics were recorded with other tags. This schema is kept for existing dashboards and is enabled by the jmix.ui.legacy-monitoring-enabled=true property. The property is deprecated and will be removed in a future release. When a project is upgraded to 3.0, Studio sets it to true.
Tag mapping:
| Metric | Legacy tag | Tag in the new schema |
|---|---|---|
|
|
|
|
|
|
— |
|
|
|
|
|
|
|
|
|
|
The lifecycle stage values are the same in both schemas. There are no fragment and action metrics in the legacy schema.
The jmix.ui.ui-observation-enabled and jmix.ui.legacy-monitoring-enabled properties are independent:
ui-observation-enabled |
legacy-monitoring-enabled |
Recorded UI metrics |
|---|---|---|
|
|
None |
|
|
All UI metrics in the new schema |
|
|
|
|
|
|
When both properties are enabled, the new schema metrics with the lifecycle.name tag are not recorded, so that they do not conflict with the legacy metrics of the same name. This rule also applies to jmix.ui.fragments, although they have no legacy counterpart. Spans are recorded in full.
To move to the new schema, switch dashboards and alert rules to the new tags, set jmix.ui.ui-observation-enabled=true and remove jmix.ui.legacy-monitoring-enabled.
Prometheus Endpoint
Add the Prometheus registry:
implementation 'org.springframework.boot:spring-boot-starter-actuator'
implementation 'io.micrometer:micrometer-registry-prometheus'
Expose the prometheus endpoint over the web:
management.endpoints.web.exposure.include=health,prometheusThe monitoring system scrapes the /actuator/prometheus endpoint periodically and stores the values. Besides Prometheus, other systems support this format too (VictoriaMetrics, Zabbix, OpenTelemetry Collector and others).
If the monitoring system does not scrape the application but receives metrics itself, add the Micrometer registry for this system (for example, micrometer-registry-datadog or micrometer-registry-influx) or use export over OTLP. The list of supported systems is given in Spring Boot Metrics.
Do not expose all endpoints with the * value: some of them show the settings and the internal state of the application. Configure access to Actuator endpoints in the security configuration of the application.
Export over OTLP
If the application already sends traces through OpenTelemetry (see Export through OpenTelemetry), metrics can be sent to the same collector:
management.otlp.metrics.export.url=http://localhost:4318/v1/metricsThe default value is http://localhost:4318/v1/metrics, so with a local collector on the standard port, metrics are sent even without this property.
With export over OTLP, the series names in Prometheus differ from the names produced by the /actuator/prometheus endpoint. For example, for the jmix.ui.views Timer in the grafana/otel-lgtm stack:
/actuator/prometheus |
OTLP |
|---|---|
|
|
|
|
|
None |
|
|
The PromQL queries on this page are written for the /actuator/prometheus endpoint. With export over OTLP, replace _seconds with _milliseconds in them; duration values will be in milliseconds.
Exemplars are not sent over OTLP either, so you cannot go from a metric graph to a trace.
The application sends metrics at the interval set by the management.otlp.metrics.export.step property, 1m by default. The window of the rate() and increase() functions in queries must cover at least two exports, that is, at least 2m with the 1m interval. Otherwise the graph shows "No data".
Metrics of Business Operations
Application metrics are registered through the same MeterRegistry as Jmix metrics and are exported together with them. Inject MeterRegistry into a bean and create the meter you need: a Counter for the number of events, such as placed orders; a Timer for the duration of operations; a Gauge for a current value, such as a queue length. See Micrometer Meters.
If an operation should be visible both in metrics and in traces, wrap it in an Observation: Micrometer creates a timer and a span for it at the same time, as for Jmix observations. See the example in Spans of Business Operations.
Name metrics with dots and an application prefix, for example sales.orders.confirmed, and use only values from a small fixed set as tags. Entity IDs, usernames and free text in tags create a separate series for every value, and the number of stored series grows with the number of users or entities.
An example of business metrics is the number of active users of the application per day, week and month (DAU, WAU, MAU): the Monitoring Active Users in Enterprise Applications with Jmix article and the jmix-app-usage-metrics-sample example application with a Grafana dashboard.
Visualization in Grafana
Grafana connects to Prometheus as a data source. A Grafana dashboard consists of visualizations. Each visualization has a PromQL query and a display type: a time series graph, a table, a single number. Dashboard variables, such as a list of applications or views, are filled with label values and substituted into the queries of visualizations: when you select a view in the list, you see data for that view only.
To browse metrics without writing queries, open Drilldown → Metrics: Grafana shows graphs of all metrics in Prometheus and lets you narrow the selection by labels. This is how you find the metric you need and its labels before building a graph.
In Prometheus, dots in tag names are replaced with underscores: the view.id tag becomes the view_id label, lifecycle.name becomes lifecycle_name.
The ten views with the highest average duration of the beforeShow stage over the last 5 minutes:
topk(10,
  sum by (view_id) (rate(jmix_ui_views_seconds_sum{lifecycle_name="beforeShow"}[5m]))
  /
  sum by (view_id) (rate(jmix_ui_views_seconds_count{lifecycle_name="beforeShow"}[5m]))
)
The 95th percentile of data loading duration by loader. The query requires the histogram enabled for jmix.ui.data:
histogram_quantile(0.95,
  sum by (le, view_id, loader_id) (rate(jmix_ui_data_seconds_bucket{lifecycle_name="load"}[5m]))
)
A dashboard of four graphs based on such queries is shown in the Percentiles section. Its metrics are sent over OTLP, so the queries use the _milliseconds series.
If the metrics of several applications are stored in one Prometheus, add a common tag with the application name to all metrics of the application. Dashboards use this tag to separate applications:
management.metrics.tags.application=salesExemplars
An exemplar is the value of a single metric measurement together with the IDs of the trace and span in which the measurement was made. Grafana shows exemplars as points over the metric graph. A point shows the duration of a particular operation and opens its trace: from a spike on the graph, you can go directly to the request that caused it.
If tracing is enabled in the application, the Prometheus registry attaches exemplars to timer series, including Jmix timers: to the _count series and, with the histogram enabled, to the _bucket series as well. A histogram is not required for exemplars. The /actuator/prometheus endpoint returns exemplars only in the OpenMetrics format; Prometheus 3 requests this format by default.
Going from a graph to a trace requires three settings:
-
Prometheus is started with the
--enable-feature=exemplar-storageflag. Without it, the received exemplars are not stored. -
In the settings of the Prometheus data source in Grafana, the Exemplars section has a link: the
trace_idlabel and the trace data source, for example Tempo. -
The Exemplars switch is turned on in the query of the visualization.
An exemplar leads only to a trace; logs and the profile are opened from the trace. The Logs for this span button in the span details shows the log lines of this trace if the Tempo data source has the link to logs configured (Trace to logs), see Moving Between Log Lines and Traces. The Profiles for this span button of the root span of a request opens the CPU profile for the time of this span if linking profiles to spans is configured.
The Micrometer OTLP registry does not send exemplars. To link metrics with traces sent over OTLP, metrics are collected from the /actuator/prometheus endpoint, while traces are still sent over OTLP.
For example, on the graph of the average loading duration of petclinic_Owner, about 40 ms, an exemplar point stands above the line: one loading of this entity that took 168 ms (the value 0.168 in seconds). The Trace link in the tooltip of the point opens the trace of this loading in Explore. Ctrl+click on the link opens the trace in a new tab, and the dashboard stays open.
Ready-Made Dashboards
The standard Jmix dashboards for Grafana are published in the jmix-grafana-dashboards repository. A dashboard is stored in a JSON file and is loaded into Grafana through Dashboards → New → Import; select the Prometheus data source during import. You can use a dashboard as is, take it as a sample for your own visualizations, or adapt it: change queries, remove unneeded visualizations, add visualizations with metrics of your application.
The "Jmix 3 Monitoring" dashboard shows the metrics that Prometheus collects from the /actuator/prometheus endpoint. It is built on the new tag schema metrics and expects jmix.ui.ui-observation-enabled and jmix.core.data-observation-enabled to be enabled. Applications are distinguished by the common application tag, see Visualization in Grafana. The dashboard does not need histograms: it shows the duration of operations by the average and maximum value of the timer. The maximum is the longest operation in the last few minutes; it shows rare slow operations that the average hides.
The top row selects the data source, application, instance, views, data loaders and entities. Sections of the dashboard:
-
Overview: the view opening rate, active HTTP sessions, the rate of
DataManageroperations, HTTP 5xx responses and Jmix operations that ended with an error, the average view opening time, the maximum view closing time, the average and maximum time of data loaders. -
Views: the opening rate, average and maximum opening time by view, the average and maximum time of opening stages, the views with the longest opening time, the average and maximum closing time by view. The opening time is the sum of the average times of the opening stages, each averaged over its own number of calls. The opening rate is counted by the
readystage, so for a layout view it includes every navigation, see jmix.ui.views. -
Data loaders: the average and maximum loading time by loader, the loading rate, the loaders with the longest loading time, the average and maximum time of loader stages. The
preLoadandpostLoadstages are thePreLoadEventandPostLoadEventhandlers in the application code, andloadis the loading itself. -
Fragments: the average and maximum time of fragment stages. The
readystage of a fragment is recorded with theN/Avalue of theview.idtag, so the view filter does not narrow this stage. -
Actions: the rate, average and maximum time of action execution.
-
Data access: the rate, average and maximum time of
DataManagerloading by entity, the rate, average and maximum time of saving, the database connection pool. -
HTTP and JVM: HTTP requests by outcome, CPU usage, memory, the share of time spent in garbage collection pauses, threads by state.
-
Operations in progress: operations that have started and not yet finished: their number and the duration of the longest one. The section is based on LongTaskTimer metrics (
*.active), see Timers and Their Series. A hung operation is visible here until it finishes. If LongTaskTimers are disabled by themanagement.metrics.observations.ignored-meters=long-task-timerproperty, the section stays empty.
Panels you do not need are removed in the dashboard edit mode, and a whole section is collapsed by clicking its title.
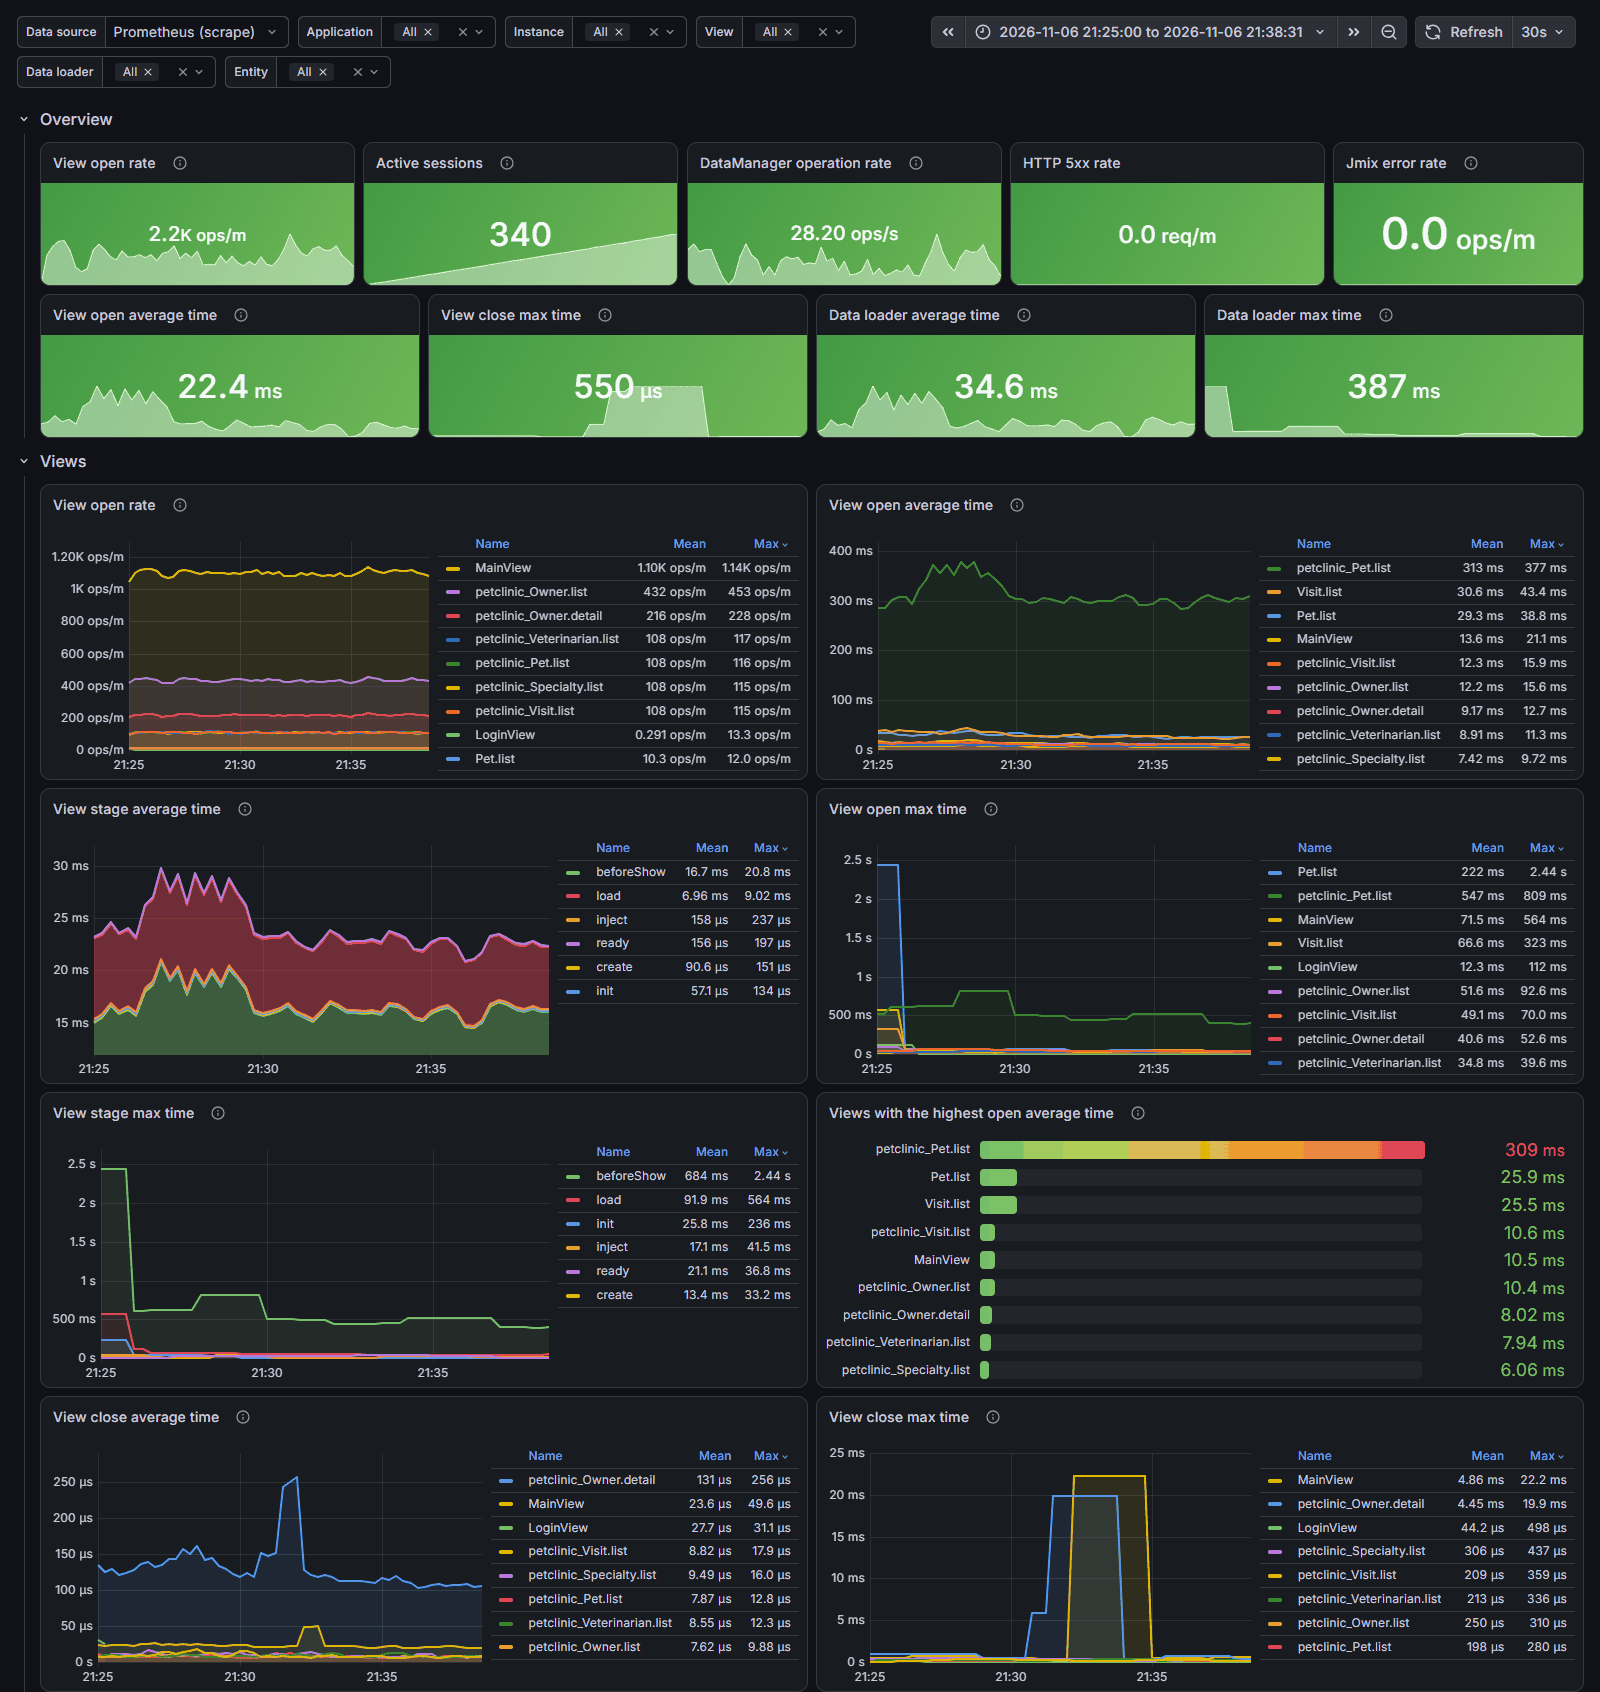
The "Jmix 3 Full Observability" dashboard adds traces, logs and profiles to the metrics. Its metric sections are the same as in "Jmix 3 Monitoring", and the graphs show exemplars that open the trace of an operation. The dashboard takes metrics from Prometheus, which collects them from the /actuator/prometheus endpoint and stores exemplars, traces from Tempo, logs from Loki and profiles from Pyroscope (see Profiling). All four data sources are selected during import. Metrics are selected by the application tag, while traces, logs and profiles are selected by the OpenTelemetry service name, which equals spring.application.name by default, so the top row has two filters: Application and Service.
Sections that "Jmix 3 Monitoring" does not have:
-
Traces: slow requests, traces with errors, slow view lifecycle stages and slow
DataManagerloads with the entity name and the JPQL query. The duration threshold is set by the Min duration filter; a trace or span ID in the table opens the trace, and Ctrl+click on it opens the trace in a new tab. -
Logs: the number of log records per minute by level, warnings and errors, the log with filters by level, user (the
jmixUserMDC value, see Username in MDC) and record text. The link in the tooltip of a bar segment on the record count graph sets the Level filter to the level of this segment, and selecting a range of the graph with the mouse narrows the time range of the whole dashboard. -
Profiles: flame graphs of CPU time, memory allocation and lock waiting.
The links in the panel titles of the Traces, Logs and Profiles sections open the Drilldown → Traces, Logs and Profiles apps in a new tab with the same time range: for the service from the Service filter or for all services. There you continue the investigation beyond what the dashboard covers: in Profiles, you export a profile to pprof to hide service frames (see Hiding Service Frames) and compare the profiles of two intervals on the Diff flame graph tab.
The links between signals are configured not in the dashboard but in the Grafana data sources, and they are not transferred when the JSON file is imported:
| Link | Where it is configured |
|---|---|
The Trace link in the exemplar tooltip |
The Prometheus data source, the Exemplars section, see Exemplars |
The Logs for this span button in a trace |
The Tempo data source, Trace to logs |
The Profiles for this span button in a trace |
The Tempo data source, Trace to profiles, see Linking Profiles to Spans |
The trace link in the details of a log record |
The Loki data source, Derived fields |
The trace window with the span tree, the span details and the span profile are standard Grafana features (Explore), not part of the dashboard. In the grafana/otel-lgtm image, the built-in data sources have all links configured except Trace to profiles. The Prometheus data source that scrapes the /actuator/prometheus endpoint is added separately, and the Trace link for exemplars is set in it manually.
The flame graphs of the Profiles section start with Tomcat, Spring and Vaadin frames; how to read them is described in Reading a Profile.
For applications that use the legacy schema (jmix.ui.legacy-monitoring-enabled=true), the repository has the "Jmix 2.x" dashboard. It expects metrics collected through /actuator/prometheus and shows only views and data loaders.
Alerts
An alert rule in Grafana is a PromQL query and a condition; when the condition is met, Grafana sends a notification: by email, to a messenger or to an external system. The query can be taken from a dashboard visualization. For example, the rule fires if the 95th percentile of data loading stays above 500 ms for five minutes:
histogram_quantile(0.95, sum by (le) (rate(jmix_ui_data_milliseconds_bucket{lifecycle_name="load"}[2m]))) > 500The query expects metrics sent over OTLP; when collecting through /actuator/prometheus, use the jmix_ui_data_seconds_bucket series and the 0.5 threshold. Step-by-step rule setup is shown in the monitoring guide.
Configuration for Production
-
Observation groups are enabled separately: the jmix.core.data-observation-enabled and jmix.ui.ui-observation-enabled properties are independent, and individual metrics are disabled by the
management.metrics.enableproperty. -
LongTaskTimers of observations are disabled by the
management.metrics.observations.ignored-meters=long-task-timerproperty; this almost halves the number of series, see Disabling and Filtering. -
Histograms are enabled only for the metrics used for percentiles and alerts, see Percentiles.
-
With export over OTLP, the
management.otlp.metrics.export.stepexport interval is set to at least1m. -
The number of tag values determines the number of series: each combination of values gives a separate series. Jmix combines loaders without an ID into one
<generated>series; in your own metrics, IDs and usernames are not used as tags. In applications with multitenancy, thejmix.user.tenantIdtag multiplies the number of series by the number of tenants; if the breakdown by tenant is not needed, the tag is removed by aMeterFilter.ignoreTags("jmix.user.tenantId")bean. -
The retention period of metrics in Prometheus is set by the
--storage.tsdb.retention.timestartup flag (15dby default). Metrics are compact and are needed for comparison with past periods, so they are kept longer than logs, traces and profiles. -
Only the needed Actuator endpoints are exposed over the web (
management.endpoints.web.exposure.include), for examplehealth,prometheusandloggers, and they are closed to anonymous access, for example by moving them to a separate port with themanagement.server.portproperty.