Performance Diagnostics
Investigation Order
An investigation usually goes from general to specific, and each step uses its own signal:
| Step | Signal | What it shows |
|---|---|---|
Detection |
Metrics and alerts |
Which view or operation became slow and since when |
Finding the request |
Traces |
Particular slow requests and the longest operations inside them |
Operation details |
Logs with trace and span IDs |
SQL statements, warnings and errors written during the operation |
Finding the method |
Span or service profile |
Methods that used CPU time and allocated memory |
The investigation needs Jmix observations enabled (the jmix.core.data-observation-enabled and jmix.ui.ui-observation-enabled properties), tracing, and logs sent with trace IDs. Profiles and SQL output are added when details are needed.
An investigation starts from the symptom, and the sections below follow this order. If a view opens slowly, its trace shows where the time went: to data access, to calls to other services or to code execution, see Slow View. These causes are described in the Data Access, Calls to Other Services and CPU Load sections. Growing memory consumption and waiting threads are separate symptoms, described in the Memory and Garbage Collection and Locks and Waiting Threads sections.
Slow View
The jmix.ui.views metric shows the duration of the lifecycle stages of each view. If the histogram is enabled for it, the 95th percentile by view is calculated by the query:
histogram_quantile(0.95, sum by (le, view_id, lifecycle_name) (rate(jmix_ui_views_seconds_bucket[5m])))The lifecycle_name tag shows which stage of the view is slow. The jmix.ui.data metric shows the data loading time of the view by loader, and jmix.data.load shows the time of data operations by entity. The "Jmix 3 Monitoring" dashboard shows the same data in a ready-made form.
Then slow traces are found by the view ID. For example, openings of the Visit.list view that took longer than 500 ms:
{ name = "view lifecycle" && span.view.id = "Visit.list" && duration > 500ms }The trace shows which child span took most of the time:
-
data loader and data loading spans (
data loader lifecycle,load list of entities): the problem is in data access, see Data Access; -
outgoing HTTP request spans: the time went to a call to another service, see Calls to Other Services;
-
no child spans or only short ones: the time went to the code of the view itself, see CPU Load.
Data Access
If data loader and data loading spans take most of the time in the trace of a slow view, the delay occurred in data access. A data loading operation passes several layers, and a delay or extra work can occur in any of them:
-
The application code or the view data loader builds a JPQL query and chooses a fetch plan.
-
DataManagerapplies access constraints and passes the query to the data store. -
EclipseLink builds an SQL query from the JPQL query, adding Jmix conditions such as the soft deletion condition, and creates entities from the result. Reference attributes from the fetch plan are loaded in the same SQL query or in separate ones.
-
The HikariCP connection pool provides a database connection. If there are no free connections, the operation waits.
-
The database executes the SQL query.
A data loading span, such as load list of entities, covers the whole DataManager operation, from the second layer to the fifth. Other sources show what happens inside the span:
| What you need to know | Where it is visible |
|---|---|
Which JPQL query was executed and with which parameters |
The |
How long the whole operation took |
The span duration; the jmix.data.load and jmix.data.save metrics |
Which SQL queries EclipseLink built and how many |
Log lines of the |
How long each SQL query ran |
The |
How long the operation waited for a database connection |
HikariCP connection pool metrics, see Database Connection Pool |
Which methods used CPU time and memory |
The root span profile, see Linking Profiles to Spans |
In Grafana, the Logs for this span button in the span details opens the log lines of this trace written during the span, including SQL queries.
For example, a load values span took 10.6 ms, and the log lines of this span contain the SQL query with parameter values and its execution time, see SQL Statements in the Trace Context. The JPQL query in the span attributes and the SQL query in the log show how EclipseLink translated the query: the petclinic_Visit entity became the PETCLINIC_VISIT table, the assignedNurse reference became the ASSIGNED_NURSE_ID column, and Jmix added the DELETED_DATE IS NULL soft deletion condition. The SQL query itself ran for 1 ms; the rest of the span time went to getting a connection and processing the query and the result in Jmix and EclipseLink.
Extra Queries (N+1)
The N+1 problem occurs when, for a list of N records, one query loads the list itself and one more query is executed for each record. In a Jmix application, it occurs at three levels, and each level is detected in its own way:
| Level | Sign in the trace | Sign in the SQL log |
|---|---|---|
The application code loads data in a loop |
Many |
One SQL query per span |
The code accesses a reference that is not in the fetch plan |
Many |
One SQL query per span |
EclipseLink loads references with separate queries |
One loading span, no signs in the trace |
Many SQL queries with the ID of one span |
The examples below use the same data set: a view loads the last 20 visits and then accesses the related pets or owners.
Loading in a Loop
The code gets a list of visits and then loads the pet owner for each visit with a separate DataManager call:
for (Visit visit : visits) {
    dataManager.load(Owner.class) (1)
            .query("select p.owner from Pet p where p = :pet")
            .parameter("pet", visit.getPet())
            .optional()
            .ifPresent(owners::add);
}| 1 | A separate load through DataManager for each visit. |
In the trace, under the view lifecycle span (393 ms), there are the list loading span and 20 load entity spans of 12–37 ms each, executed one after another:
view lifecycle                     393 ms
├── load list of entities
├── load entity                    12–37 ms each
│   ... 20 load entity spans in total, one after another
└── load entity
All these spans have the same jpql.query attribute and different jpql.parameters values. Such loading is replaced with one query for all records, for example with the where p in :pets condition, or the related data is added to the fetch plan of the original query.
Accessing a Reference Outside the Fetch Plan
If a reference attribute is not in the fetch plan, Jmix loads it on first access through DataManager by ID, see Lazy Loading. A UI table column bound to a reference that is not in the loader fetch plan behaves the same way. Code that reads such a reference for each record of a list performs a separate load for each record:
List<Visit> visits = dataManager.load(Visit.class)
        .query("select v from Visit v order by v.visitStart desc")
        .maxResults(20)
        .fetchPlan(FetchPlan.BASE) (1)
        .list();
List<String> petNames = new ArrayList<>();
for (Visit visit : visits) {
    petNames.add(visit.getPet().getName()); (2)
}| 1 | The pet reference is not in the fetch plan. |
| 2 | Accessing the reference loads the pet by ID. |
The trace looks similar to loading in a loop: 20 load entity spans, here for the petclinic_Pet entity:
view lifecycle
├── load list of entities          petclinic_Visit
├── load entity                    petclinic_Pet
│   ... 20 load entity spans in total, without jpql.query
└── load entity                    petclinic_Pet
The difference is that these spans have no jpql.query attribute, because the entity is loaded by ID. The reference is added to the fetch plan of the original query, and then the pets are loaded together with the visits.
Separate Queries Inside EclipseLink
How a reference attribute from the fetch plan is loaded is set by the fetch attribute of the fetch plan property (the FetchMode enumeration): AUTO lets the framework choose, JOIN joins tables in the same SQL query, BATCH uses one separate query for all related entities, UNDEFINED follows the JPA rules, that is, a separate query for each reference. In the UNDEFINED mode, EclipseLink executes an SQL query for every loaded reference. The trace does not show this: all the work is done inside one DataManager call.
For example, a load list of entities span took 82 ms. Its log lines show that besides the list query, EclipseLink executed separate SELECT … FROM PETCLINIC_PET WHERE (ID = ?) and SELECT … FROM PETCLINIC_OWNER WHERE (ID = ?) queries for each pet and owner, 17 SQL queries in total. Such loads are found by a LogQL query that counts SQL queries by span ID, see SQL Statements in the Trace Context. The cause is found in the fetch plan: the loading mode of the reference and the set of attributes.
Other Data Access Problems
| Sign | Probable cause | What to check |
|---|---|---|
The |
An error in the loader query or in the code |
The loader query or the |
The span takes long, while the SQL query time ( |
Waiting for a connection from the pool, or processing a large number of records |
Connection pool metrics, the number of loaded records, the span profile |
The SQL query time ( |
A slow query in the database: no suitable index, a poor execution plan |
The execution plan of the SQL query from the log in the database, for example with the |
Waiting for a Database Connection
If all pool connections are in use, data access operations wait until a connection is released. The waiting time is included in the duration of data loading spans, but not in the time of SQL queries in the log. Signs in the HikariCP metrics:
-
hikaricp.connections.pendingis greater than zero: there are threads waiting for a connection; -
hikaricp.connections.activeequalshikaricp.connections.max: all connections are in use; -
hikaricp.connections.acquiregrows: the time of getting a connection; -
hikaricp.connections.timeoutgrows: operations did not get a connection in time and ended with an error.
The pool can be exhausted by slow SQL queries, long transactions, calls to other services inside a transaction, or a too small pool size. For more about pool metrics, see Database Connection Pool.
Calls to Other Services
If outgoing HTTP request spans, including REST DataStore requests, take most of the time in the trace of a slow view, the time went to a call to another service. If the second application also sends traces and the trace context is passed, its spans are included in the same trace, see Context Propagation Between Services. The trace shows how much time the processing in the second application took and how much the transfer of the request and response took.
The response time of other services, grouped by uri, method and status, is shown by the Spring Boot http.client.requests metric.
CPU Load
If a span takes long while it has no child spans or only short ones, the time went to the code inside the span itself. Which methods executed it is shown by the CPU profile of the root span of the request, see Linking Profiles to Spans. For load not related to a particular request, such as background tasks, the CPU profile of the whole service for the selected interval in Drilldown → Profiles is used.
The CPU usage of the application and the server is shown by the Spring Boot process.cpu.usage and system.cpu.usage metrics.
Comparing the span duration with the CPU time in its profile distinguishes two cases. If they are close, the request was computing. If the CPU time is noticeably shorter, the request was mostly waiting: for the database response, a connection from the pool, another service or a lock to be released, see Locks and Waiting Threads.
Memory and Garbage Collection
Memory problems do not always show up as slow requests, so they are detected by JVM metrics. The state of JVM memory is shown by Spring Boot metrics:
| Metric | What it shows |
|---|---|
|
Used memory by area |
|
The share of the long-lived heap area used after the last garbage collection. If it grows from collection to collection, the application retains more and more objects, see Memory Leak |
|
The duration and frequency of garbage collection pauses |
|
The share of CPU time spent on garbage collection |
Frequent garbage collections are caused by intensive memory allocation. Where memory is allocated is shown by the memory allocation profile: for a single request, the root span profile; for the application as a whole, the service profile in Drilldown → Profiles. The memory allocation profile is enabled in the Pyroscope Java agent, see Configuration for Production.
Memory Leak
A memory leak occurs when references remain to objects that the application no longer needs, and the garbage collector cannot remove them. Used memory grows gradually, and when it runs out, the application ends operations with an OutOfMemoryError.
The sign of a leak in metrics is growing jvm.memory.usage.after.gc under constant load: after each garbage collection, more objects remain in the long-lived heap area than after the previous one. Together with it, the frequency of jvm.gc.pause pauses and the jvm.gc.overhead share grow. Memory growth with growing load is not a leak, so memory is compared over periods with the same load.
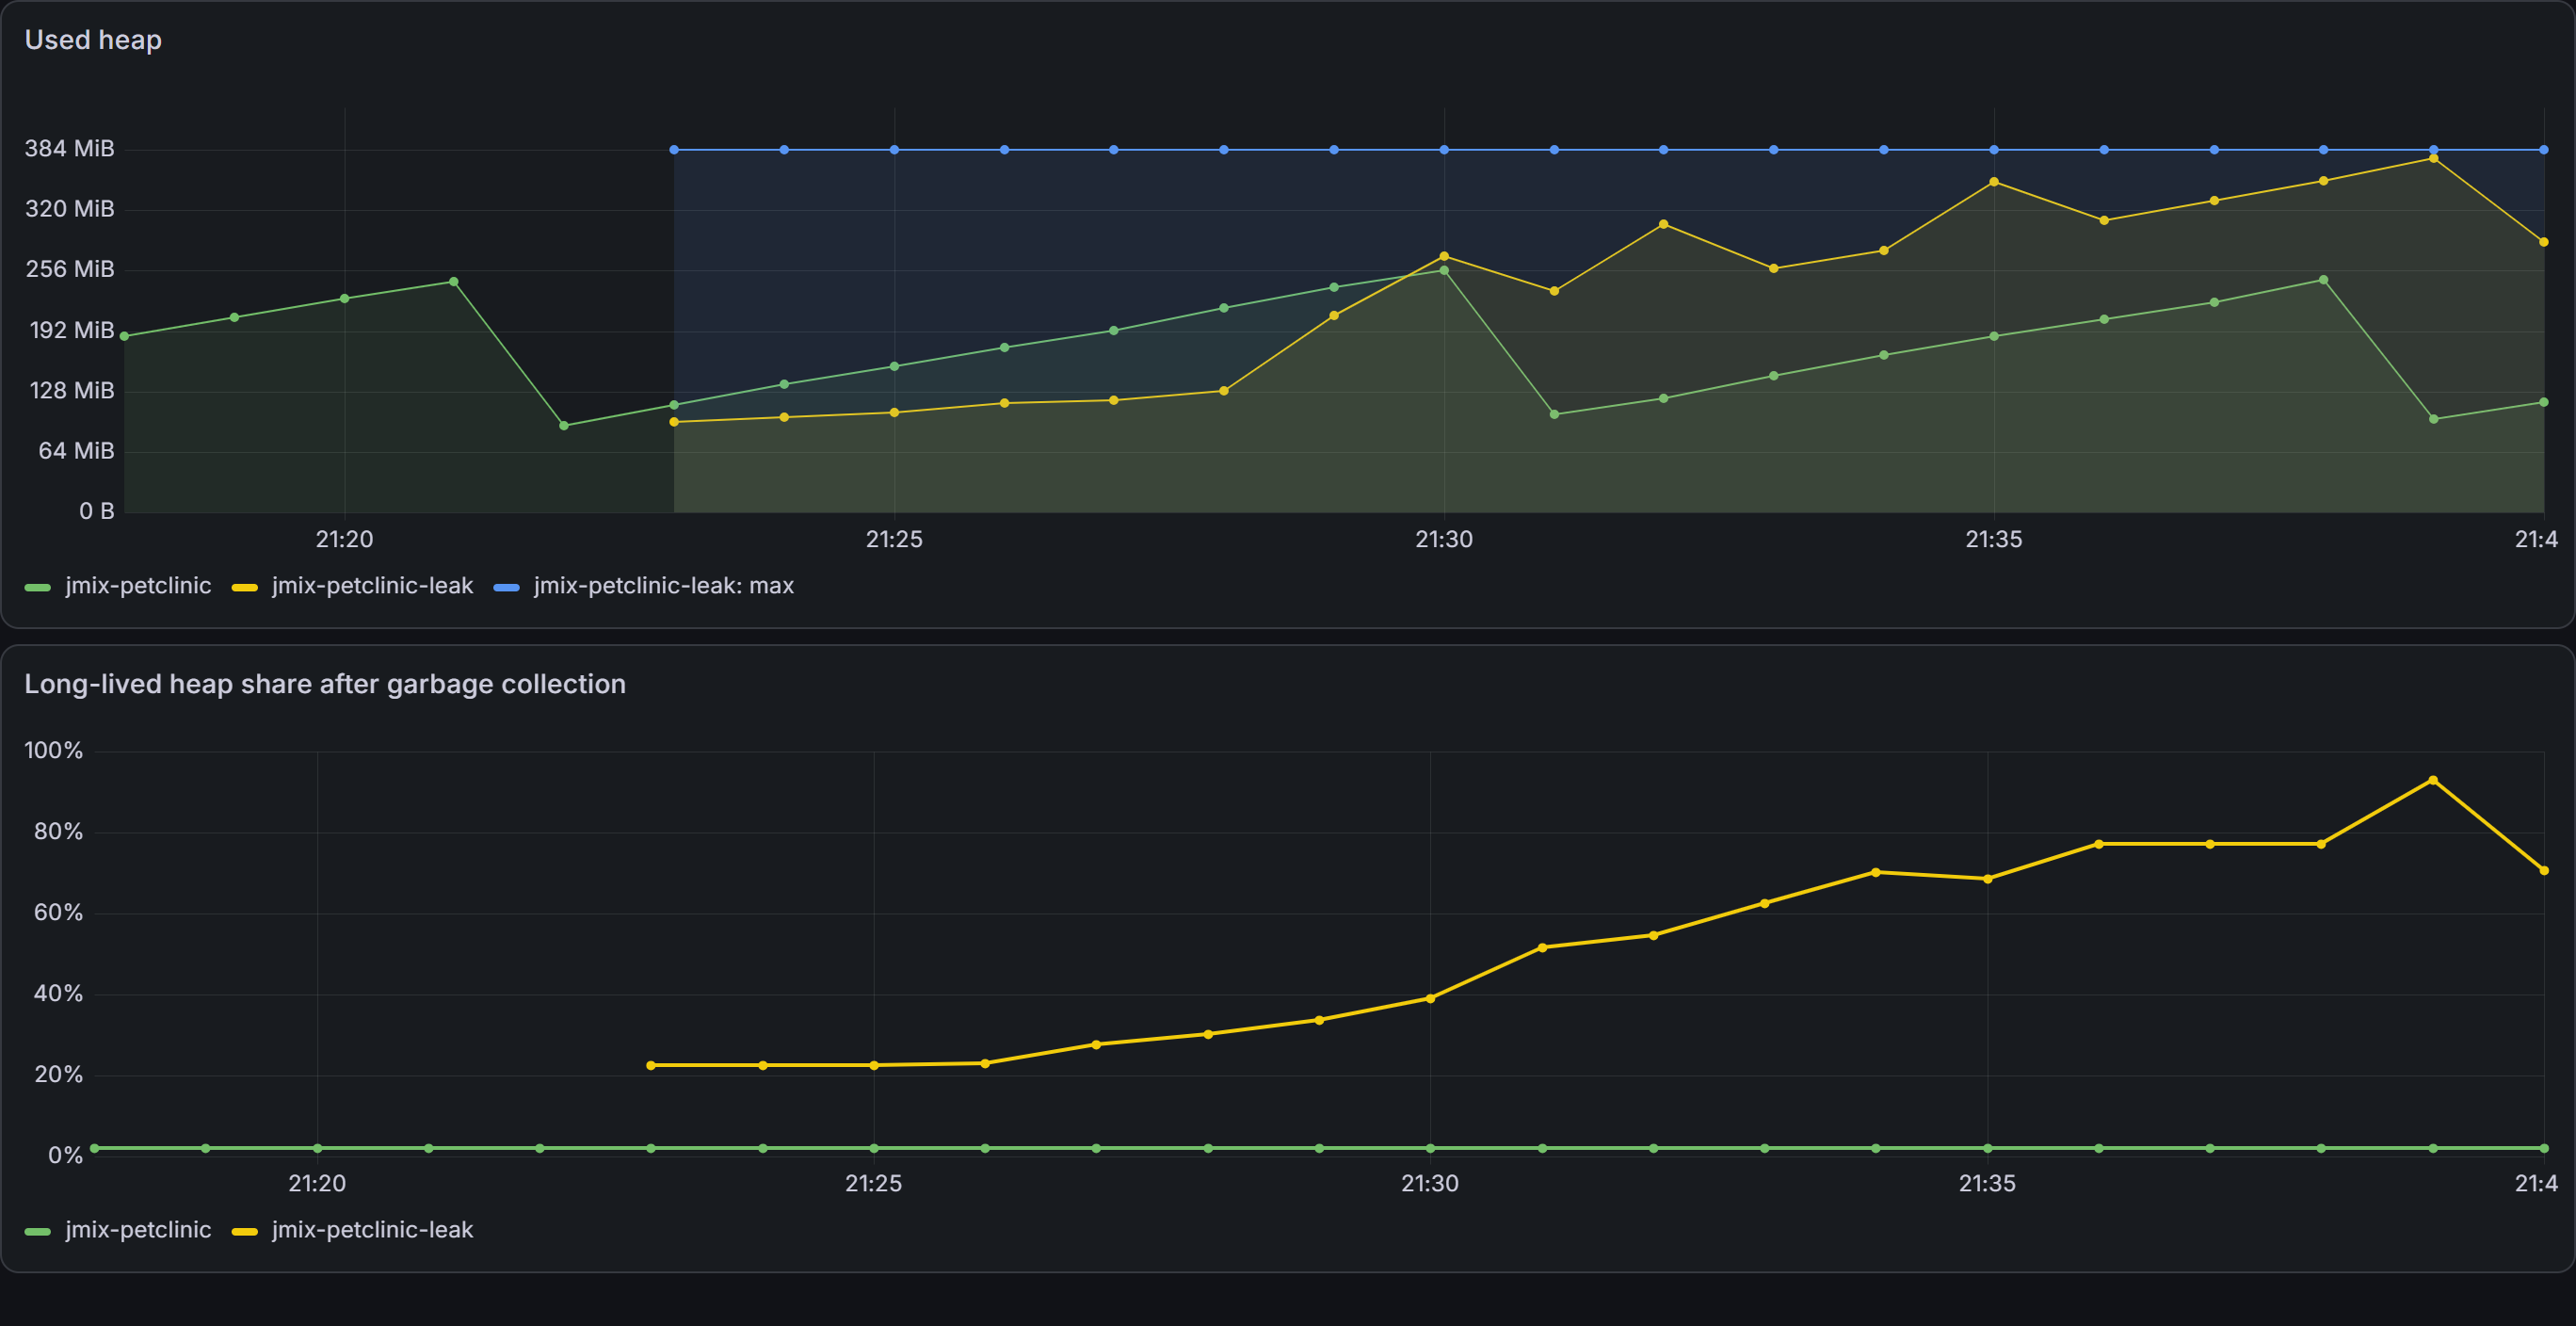
For example, two Petclinic instances run at the same time under the same load. A cache without a size limit was added to the jmix-petclinic-leak instance as an example. In the application without a leak, the used heap returns to about 100 MiB after each garbage collection, and the share of the long-lived area after collection does not change. In the instance with the leak, each next minimum of the used heap is higher than the previous one, and the share of the long-lived area after collection grew from 22 to 93% in 15 minutes with a heap limit of 384 MiB. Three minutes later, an OutOfMemoryError appeared in the application log.
Comparing memory growth with the number of active HTTP sessions shows where to look. The number of sessions is the tomcat.sessions.active.current metric, which is published with server.tomcat.mbeanregistry.enabled=true. If memory grows together with the number of sessions, the objects are retained by the state of user sessions, including open views. If there is no relation to sessions, check caches, static collections and ThreadLocal variables.
The memory allocation profile shows where memory is allocated, but not which objects remain in the heap. A method that allocates a lot of memory is not necessarily the cause of a leak: the objects it allocates can be removed at the next garbage collection.
A heap dump shows which objects are retained and which references prevent their removal. It is taken from the Actuator heapdump endpoint or automatically on an error, with the -XX:+HeapDumpOnOutOfMemoryError JVM option. The dump is written while the application is stopped and takes about as much disk space as the used heap. The dump is opened in a heap analyzer, for example Eclipse Memory Analyzer: the dominator tree shows the objects that retain the most memory, and the path to the garbage collection roots shows the chain of references that keeps an object from being removed.
A heap dump contains all data from the application memory, including personal data and passwords. By default, the heapdump endpoint is not exposed over the web; if it is exposed, access to it is restricted the same way as to other Actuator endpoints, see Configuration for Production.
Locks and Waiting Threads
The jvm.threads.states metric shows the number of threads in each state. Growth of the number of threads in the blocked and waiting states under constant load means that threads wait for each other or for external resources.
Where exactly threads wait is shown by the Pyroscope lock profile. In Grafana, it is represented by two types: mutex for waiting on synchronized monitors, and block for waiting on java.util.concurrent locks, such as ReentrantLock. The agent records waits longer than the threshold set by the PYROSCOPE_PROFILER_LOCK variable, see Configuration for Production.
One of the sources of waiting in the Jmix UI is the Vaadin session lock: the requests of one user session are handled one at a time, and a long operation in a view handler delays the other requests of this session. How this looks in a profile and how to avoid it is described in the Vaadin Session Lock section.
See Also
-
Observability: an overview of observability and the links between signals
-
Observability in Production: configuring observability for continuous operation
-
Fetching Data: fetch plans and reference loading modes
-
Observability: Monitoring: an example of finding a slow view by metrics