Observability: Distributed Tracing
This guide demonstrates how to add distributed tracing to two Jmix applications using Micrometer and OpenTelemetry. We will follow requests from the Petclinic Portal to the Backend, inspect the observations that Jmix creates automatically, and add a custom span for a business operation.
Requirements
Implementing this guide step by step requires the following:
-
Complete the Centralized Logging Guide to understand the logging setup and the two Petclinic applications used in this guide.
-
Get the completed sample project, which includes all the examples used in this guide.
-
The source repository is available as a ZIP archive.
-
Or clone it and switch to the
release_3branch:git clone https://github.com/jmix-framework/jmix-observability-tracing-sample cd jmix-observability-tracing-sample git checkout release_3
-
What We are Going to Build
In this guide, we enhance the Petclinic Backend and Portal applications from the centralized logging guide with distributed tracing.
First, we will enable the tracing support provided by Jmix and Spring Boot. When a pet owner opens the visit list, the Portal loads the data from the Backend through the REST DataStore. We will inspect how the resulting trace connects UI processing, data loading, the HTTP exchange, and Backend persistence.
Next, we will add a custom observation to user registration. The custom registerUser span will group the automatically created persistence and HTTP spans under one business operation.
The final application includes:
-
Local Observability Stack: Grafana OpenTelemetry LGTM collects and displays the telemetry.
-
Automatic Tracing: Spring Boot and Jmix create spans for HTTP requests, UI processing, and data access.
-
Cross-Service Propagation: The trace context travels from the Portal to the Backend.
-
Log and Trace Correlation: Application logs link to the corresponding traces in Grafana.
-
Custom Business Tracing: A custom span represents the complete user-registration operation.
How Distributed Tracing Works
When a pet owner opens the visit list in the Portal, one user interaction causes work in multiple parts of the system:
-
The Portal opens the Jmix view and loads its data.
-
The REST DataStore sends an HTTP request to the Backend.
-
The Backend authenticates the request and loads visits from the database.
-
The response returns to the Portal, which renders the visit cards.
The centralized logging setup from the previous guide shows messages from both applications in one place. However, timestamps alone do not reliably tell us which Portal and Backend operations belong to the same interaction, especially when many requests run concurrently.
Distributed tracing connects this work in a trace. A trace represents one request or interaction and consists of spans. Each span represents an individual operation, records its duration and attributes, and refers to the trace it belongs to. Parent-child relationships between spans show which operation caused the next one.
The Petclinic Portal uses Vaadin Flow, which runs the UI logic on the server. Opening a view or interacting with it sends an HTTP request from the browser to the Portal. The browser in this sample is not instrumented for tracing and therefore does not add a traceparent header to these requests.
Spring Boot observes the incoming HTTP request before Vaadin and Jmix process it. Its server instrumentation checks for an incoming trace context. Because the browser request does not contain one, Spring Boot starts a new trace and creates the initial HTTP server span. If a request already contains a trace context, Spring Boot continues that trace instead.
While the request is processed, this server span is the current tracing context. Jmix does not need to inspect the HTTP headers or create the root trace itself. Its observations for the Vaadin view, fragments, actions, and data loaders become child spans of the active server span. A later Vaadin request without a traceparent header starts another trace; the trace context is not stored in the Vaadin session between requests.
When the REST DataStore calls the Backend during the same request, it uses a Spring Boot-configured HTTP client. The HTTP client instrumentation creates a client span from the active Portal context and injects that context into the standardized traceparent HTTP header defined by W3C Trace Context. The header carries identifiers and sampling information, not the collected spans themselves.
Spring Boot’s server instrumentation in the Backend extracts this context and continues the trace with new server and application spans. Both applications export their own spans to the OpenTelemetry Collector. Because the spans contain the same trace ID and their parent relationships, Tempo can assemble them into one distributed trace.
The shared trace context lets us follow the visit request across service boundaries. It also reveals where time was spent and which operation failed without having to reconstruct the request from timestamps.
Distributed tracing is also useful when the system consists of a single Jmix application. In that case, a trace connects the incoming browser request with the Jmix view lifecycle, UI actions, data loaders, and data-access operations executed during that request. When user-context enrichment is enabled, these spans also contain jmix.user.username, which shows which authenticated user initiated the observed operations. Propagating the context to another application extends this same model across a service boundary, but it is not a prerequisite for using tracing.
Trace data is intended for diagnostics, not as a complete audit history. Sampling and retention policies mean that not every user operation is necessarily available. Operations that must be recorded completely and retained for compliance purposes require an audit-specific mechanism.
Tracing in Jmix Applications
The Jmix tracing support uses Micrometer’s Observation API to instrument framework operations. When the corresponding application properties are enabled, Jmix creates observations for data access as well as Flow UI views, fragments, data loaders, and actions. It can also add the current user and tenant context to these observations.
Spring Boot contributes observations for incoming and outgoing HTTP requests. This is important for the Petclinic example because the Portal’s REST DataStore call and the corresponding Backend request become part of the same trace.
The spring-boot-starter-opentelemetry dependency connects these Micrometer observations to OpenTelemetry. It:
-
Configures the Micrometer observation and tracing infrastructure.
-
Translates observations into OpenTelemetry spans.
-
Exports the spans through the OpenTelemetry Protocol (OTLP).
|
Jmix framework code and custom application code use the same |
Setting Up Distributed Tracing
With the tracing foundation in place, the next step configures a local observability backend and connects both applications to it.
Running the Grafana OpenTelemetry LGTM Stack
The Centralized Logging Guide introduced the Grafana OpenTelemetry LGTM stack as the local observability environment. We will continue using this stack for tracing. It packages the OpenTelemetry Collector, Loki, Grafana, Tempo, Prometheus, and Pyroscope into a single Docker image.
The sample project’s Docker Compose configuration contains the same lgtm service:
lgtm:
  image: grafana/otel-lgtm:0.29.1
  ports:
    - "3000:3000" # Grafana
    - "4317:4317" # OTLP gRPC
    - "4318:4318" # OTLP HTTP
Port 4318 accepts OTLP over HTTP, port 4317 accepts OTLP over gRPC, and port 3000 exposes Grafana. Loki, Tempo, and Prometheus are already configured as Grafana data sources, so no separate Collector, Tempo, Loki, or Grafana configuration files are needed.
If an LGTM container from the logging guide is still running, stop it before starting this Compose project. Both project configurations expose ports 3000, 4317, and 4318.
|
The LGTM image is intended for development, demo, and testing environments. In production, applications typically send telemetry to dedicated managed or self-hosted observability backend services instead of running all components in a single container. |
Enabling Tracing in Petclinic Backend
Now we configure the Petclinic Backend application to export traces to the OpenTelemetry Collector included in the LGTM container.
First, add the required dependencies to the Backend’s build.gradle:
// -----------------------------------------------------------
// DISTRIBUTED TRACING
// -----------------------------------------------------------
// Provides Micrometer Tracing, the OpenTelemetry bridge, and OTLP export.
implementation 'org.springframework.boot:spring-boot-starter-opentelemetry'
The spring-boot-starter-opentelemetry dependency provides the Micrometer Tracing bridge, the OpenTelemetry SDK integration, and OTLP export.
Next, configure the tracing export settings in application.properties:
###############################################################################
# Tracing Configuration
###############################################################################
# ----- Sampling -----
# Sets the probability for trace sampling. A value of 1.0 means 100% of traces are recorded (for dev purposes, on prod might be 0.1 e.g.).
management.tracing.sampling.probability=1.0

# ----- Jmix Observations -----
jmix.core.data-observation-enabled=true
jmix.ui.ui-observation-enabled=true

# ----- OTLP Tracing Export -----
# These settings enable exporting distributed traces to local OpenTelemetry Collector.
management.opentelemetry.tracing.export.otlp.endpoint=http://localhost:4318/v1/traces-
Sampling probability:
1.0records every trace so that all interactions performed in this guide are available for inspection. Spring Boot’s default is0.1. -
Jmix observations:
jmix.core.data-observation-enabledrecords data operations andjmix.ui.ui-observation-enabledrecords Flow UI operations. -
OTLP tracing export:
management.opentelemetry.tracing.export.otlp.endpointsends completed spans to the LGTM Collector over HTTP.
Distributed tracing can produce a large amount of telemetry. Production systems therefore usually use sampling and retain only a subset of all traces. As a result, the tracing backend normally does not contain a complete history of every request processed by the application.
The management.tracing.sampling.probability property controls sampling in the Jmix application. For example, 0.1 records approximately ten percent of traces. Making the decision in the application reduces the amount of data sent over the network and processed by the Collector.
Sampling can also take place in the OpenTelemetry Collector. A Collector can apply one sampling policy centrally or use tail sampling to retain traces based on information from the complete trace, such as errors or high latency. If the Collector should make the sampling decision, the applications must first export the relevant traces. A trace discarded by the application never reaches the Collector and cannot be selected there.
|
The |
Enabling Tracing in Petclinic Portal
The Portal application requires the same tracing configuration to participate in distributed traces and track requests from the frontend perspective.
Add the tracing dependencies to the Portal’s build.gradle:
// -----------------------------------------------------------
// DISTRIBUTED TRACING
// -----------------------------------------------------------
// Provides Micrometer Tracing, the OpenTelemetry bridge, and OTLP export.
implementation 'org.springframework.boot:spring-boot-starter-opentelemetry'
Configure the Portal’s tracing export settings in application.properties:
###############################################################################
# Tracing Configuration
###############################################################################
# ----- Sampling -----
# Sets the probability for trace sampling. A value of 1.0 means 100% of traces are recorded (for dev purposes, on prod might be 0.1 e.g.).
management.tracing.sampling.probability=1.0

# ----- Jmix Observations -----
jmix.core.data-observation-enabled=true
jmix.ui.ui-observation-enabled=true

# ----- OTLP Tracing Export -----
# These settings enable exporting distributed traces to local OpenTelemetry Collector.
management.opentelemetry.tracing.export.otlp.endpoint=http://localhost:4318/v1/traces
Both applications use the same configuration so that the Portal can propagate the W3C trace context to the Backend and both services can contribute spans to the same trace.
Keeping Log and Trace Correlation
The spring-boot-starter-opentelemetry dependency configures tracing, metrics, and the OpenTelemetry SDK, but it does not capture Logback events. Spring Boot deliberately does not include an OpenTelemetry Logback or Log4j appender.
Keep the OpenTelemetry Logback appender dependency from the logging setup:
// -----------------------------------------------------------
// LOGGING EXPORT (LOGBACK)
// -----------------------------------------------------------
// OpenTelemetry Logback Appender:
// This appender sends log events (including MDC attributes such as trace_id, span_id, etc.)
// to the OpenTelemetry Collector.
implementation 'io.opentelemetry.instrumentation:opentelemetry-logback-appender-1.0:2.28.1-alpha'
The OpenTelemetry appender in logback-spring.xml converts Logback events into OpenTelemetry log records. It also adds the active trace and span identifiers, which enables navigation from a log record to its trace in Grafana.
<?xml version="1.0" encoding="UTF-8"?>
<configuration>

    <!-- Console Appender:
         Outputs logs to the console. The pattern includes a timestamp, thread,
         log level, logger name, and prints all MDC (Mapped Diagnostic Context) key/value pairs using %X.
    -->
    <appender name="console" class="ch.qos.logback.core.ConsoleAppender">
        <encoder>
            <pattern>
                %d{HH:mm:ss.SSS} [%thread] [%X] %-5level %logger{36} - %msg%n
            </pattern>
        </encoder>
    </appender>

    <!-- OpenTelemetry Appender:
         Sends log events to an OpenTelemetry Collector with all MDC attributes are captured.

         OpenTelemetryAppender automatically puts trace_id and span_id into the logs so that it is possible to correlate them with traces
    -->
    <appender name="OpenTelemetry" class="io.opentelemetry.instrumentation.logback.appender.v1_0.OpenTelemetryAppender">
        <captureMdcAttributes>*</captureMdcAttributes>
    </appender>

    <!-- Root Logger:
         Configures logging at INFO level and routes log events to both the console and OpenTelemetry appenders.
    -->
    <root level="INFO">
        <appender-ref ref="console"/>
        <appender-ref ref="OpenTelemetry"/>
    </root>

</configuration>
The appender needs the OpenTelemetry instance managed by Spring Boot. Install it after the application context has created that instance:
package io.jmix.petclinic.portal.config;

import io.opentelemetry.api.OpenTelemetry;
import io.opentelemetry.instrumentation.logback.appender.v1_0.OpenTelemetryAppender;
import org.springframework.beans.factory.InitializingBean;
import org.springframework.stereotype.Component;

/**
 * "The OpenTelemetryAppender for both Logback and Log4j requires access to an OpenTelemetry instance to function properly.
 * This instance must be set programmatically during application startup."
 * See also logback-spring.xml:
 *     <appender name="OpenTelemetry" class="io.opentelemetry.instrumentation.logback.appender.v1_0.OpenTelemetryAppender" />
 * see: <a href="https://docs.spring.io/spring-boot/reference/actuator/loggers.html">Spring Boot Actuator Loggers</a>
 */
@Component
class OpenTelemetryAppenderInitializer implements InitializingBean {

	private final OpenTelemetry openTelemetry;

	OpenTelemetryAppenderInitializer(OpenTelemetry openTelemetry) {
		this.openTelemetry = openTelemetry;
	}

	@Override
	public void afterPropertiesSet() {
		OpenTelemetryAppender.install(this.openTelemetry);
	}

}|
The Logback appender belongs to the OpenTelemetry Java instrumentation project and currently uses an |
Configuring the Docker Environment
When running the applications in Docker containers, the tracing endpoints need to be configured to point to the internal Docker network addresses. The docker-compose.yaml file includes environment variables that override the local development settings:
MANAGEMENT_OPENTELEMETRY_LOGGING_EXPORT_OTLP_ENDPOINT: http://lgtm:4318/v1/logs
MANAGEMENT_OPENTELEMETRY_TRACING_EXPORT_OTLP_ENDPOINT: http://lgtm:4318/v1/traces
MANAGEMENT_OTLP_METRICS_EXPORT_URL: http://lgtm:4318/v1/metrics
These environment variables override the application.properties settings when running in Docker. The applications use the internal Docker hostname lgtm instead of localhost. The three endpoints send logs, traces, and metrics to the same Collector.
Verifying the Tracing Setup
With all components configured, the distributed tracing setup can now be verified.
-
Start PostgreSQL and the LGTM service from the sample project root:
docker compose -f docker/docker-compose.yaml up -d -
Start both the Petclinic Backend and Portal applications from Jmix Studio. Their local configuration sends telemetry to
localhost:4318.Alternatively, build both application JAR files and start all services with the Compose
appprofile:docker compose -f docker/docker-compose.yaml --profile app up --build -d -
Open Grafana at http://localhost:3000 (username:
admin, password:admin) -
Navigate to Connections > Data sources and verify that Loki, Tempo, and Prometheus appear as configured data sources.
-
Go to Explore and select Tempo from the data source dropdown.
If the setup works correctly, Tempo appears without any manual data source configuration. The applications send traces to the Collector inside the LGTM container, which forwards them to Tempo for storage and querying.
The next section shows the tracing information available without application-specific tracing code, using the visit list as a scenario.
Automatic Tracing with Jmix
With the infrastructure and configuration in place, the visit list provides the first tracing scenario. Viewing it in the Petclinic Portal triggers a REST API call to the Backend and demonstrates what Jmix and Spring Boot trace automatically.
Loading the Visit List
When a pet owner logs into the Petclinic Portal and navigates to the visits list, the Portal application needs to fetch the visit data from the Backend through the REST DataStore.
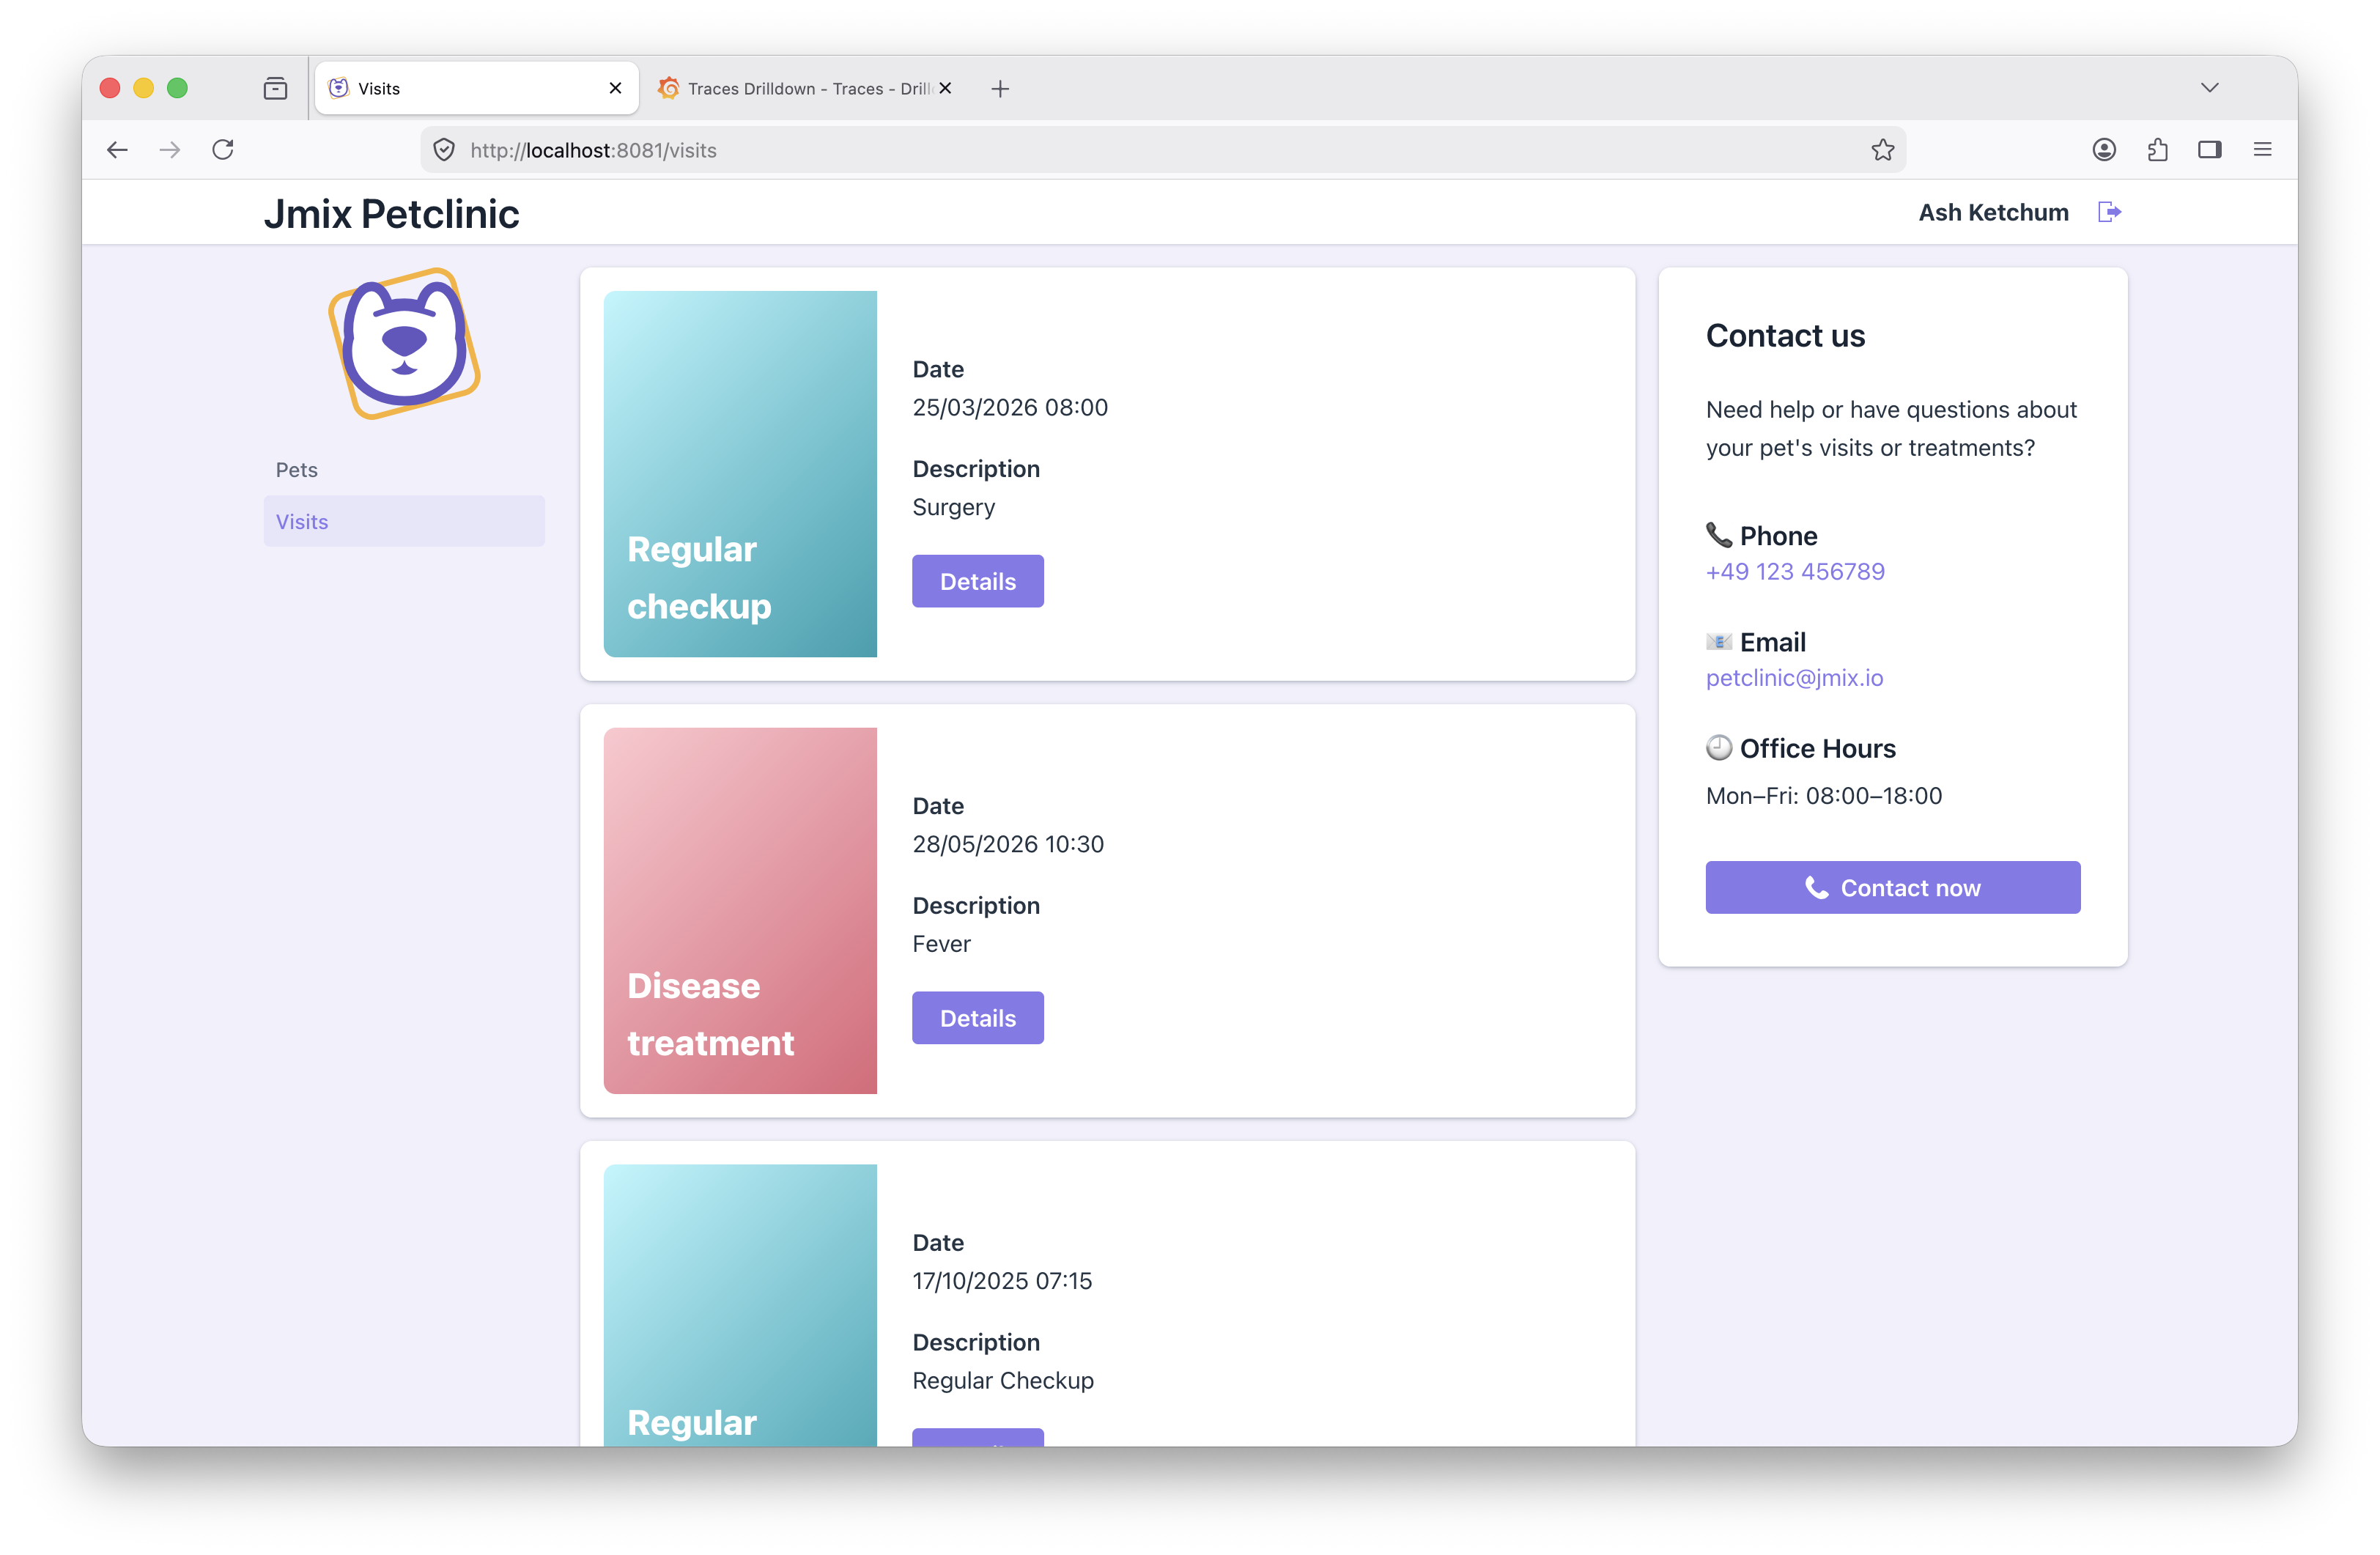
This user action triggers a chain of operations across both services:
-
The Portal handles the UI interaction and creates observations for the view and data loading operations.
-
The REST DataStore calls the Backend API and propagates the active trace context in the W3C
traceparentHTTP header. -
The Backend extracts the trace context and creates child spans for the incoming request, security filters, and Jmix data access.
-
Both services export their spans to the OpenTelemetry Collector, which forwards them to Tempo.
Without trace propagation through HTTP headers, each service would generate isolated traces with no connection between them.
Finding the Trace from Application Logs
In Grafana’s Drilldown > Logs view, filter for logs from the jmix-petclinic-portal service to see what happens when loading visits:
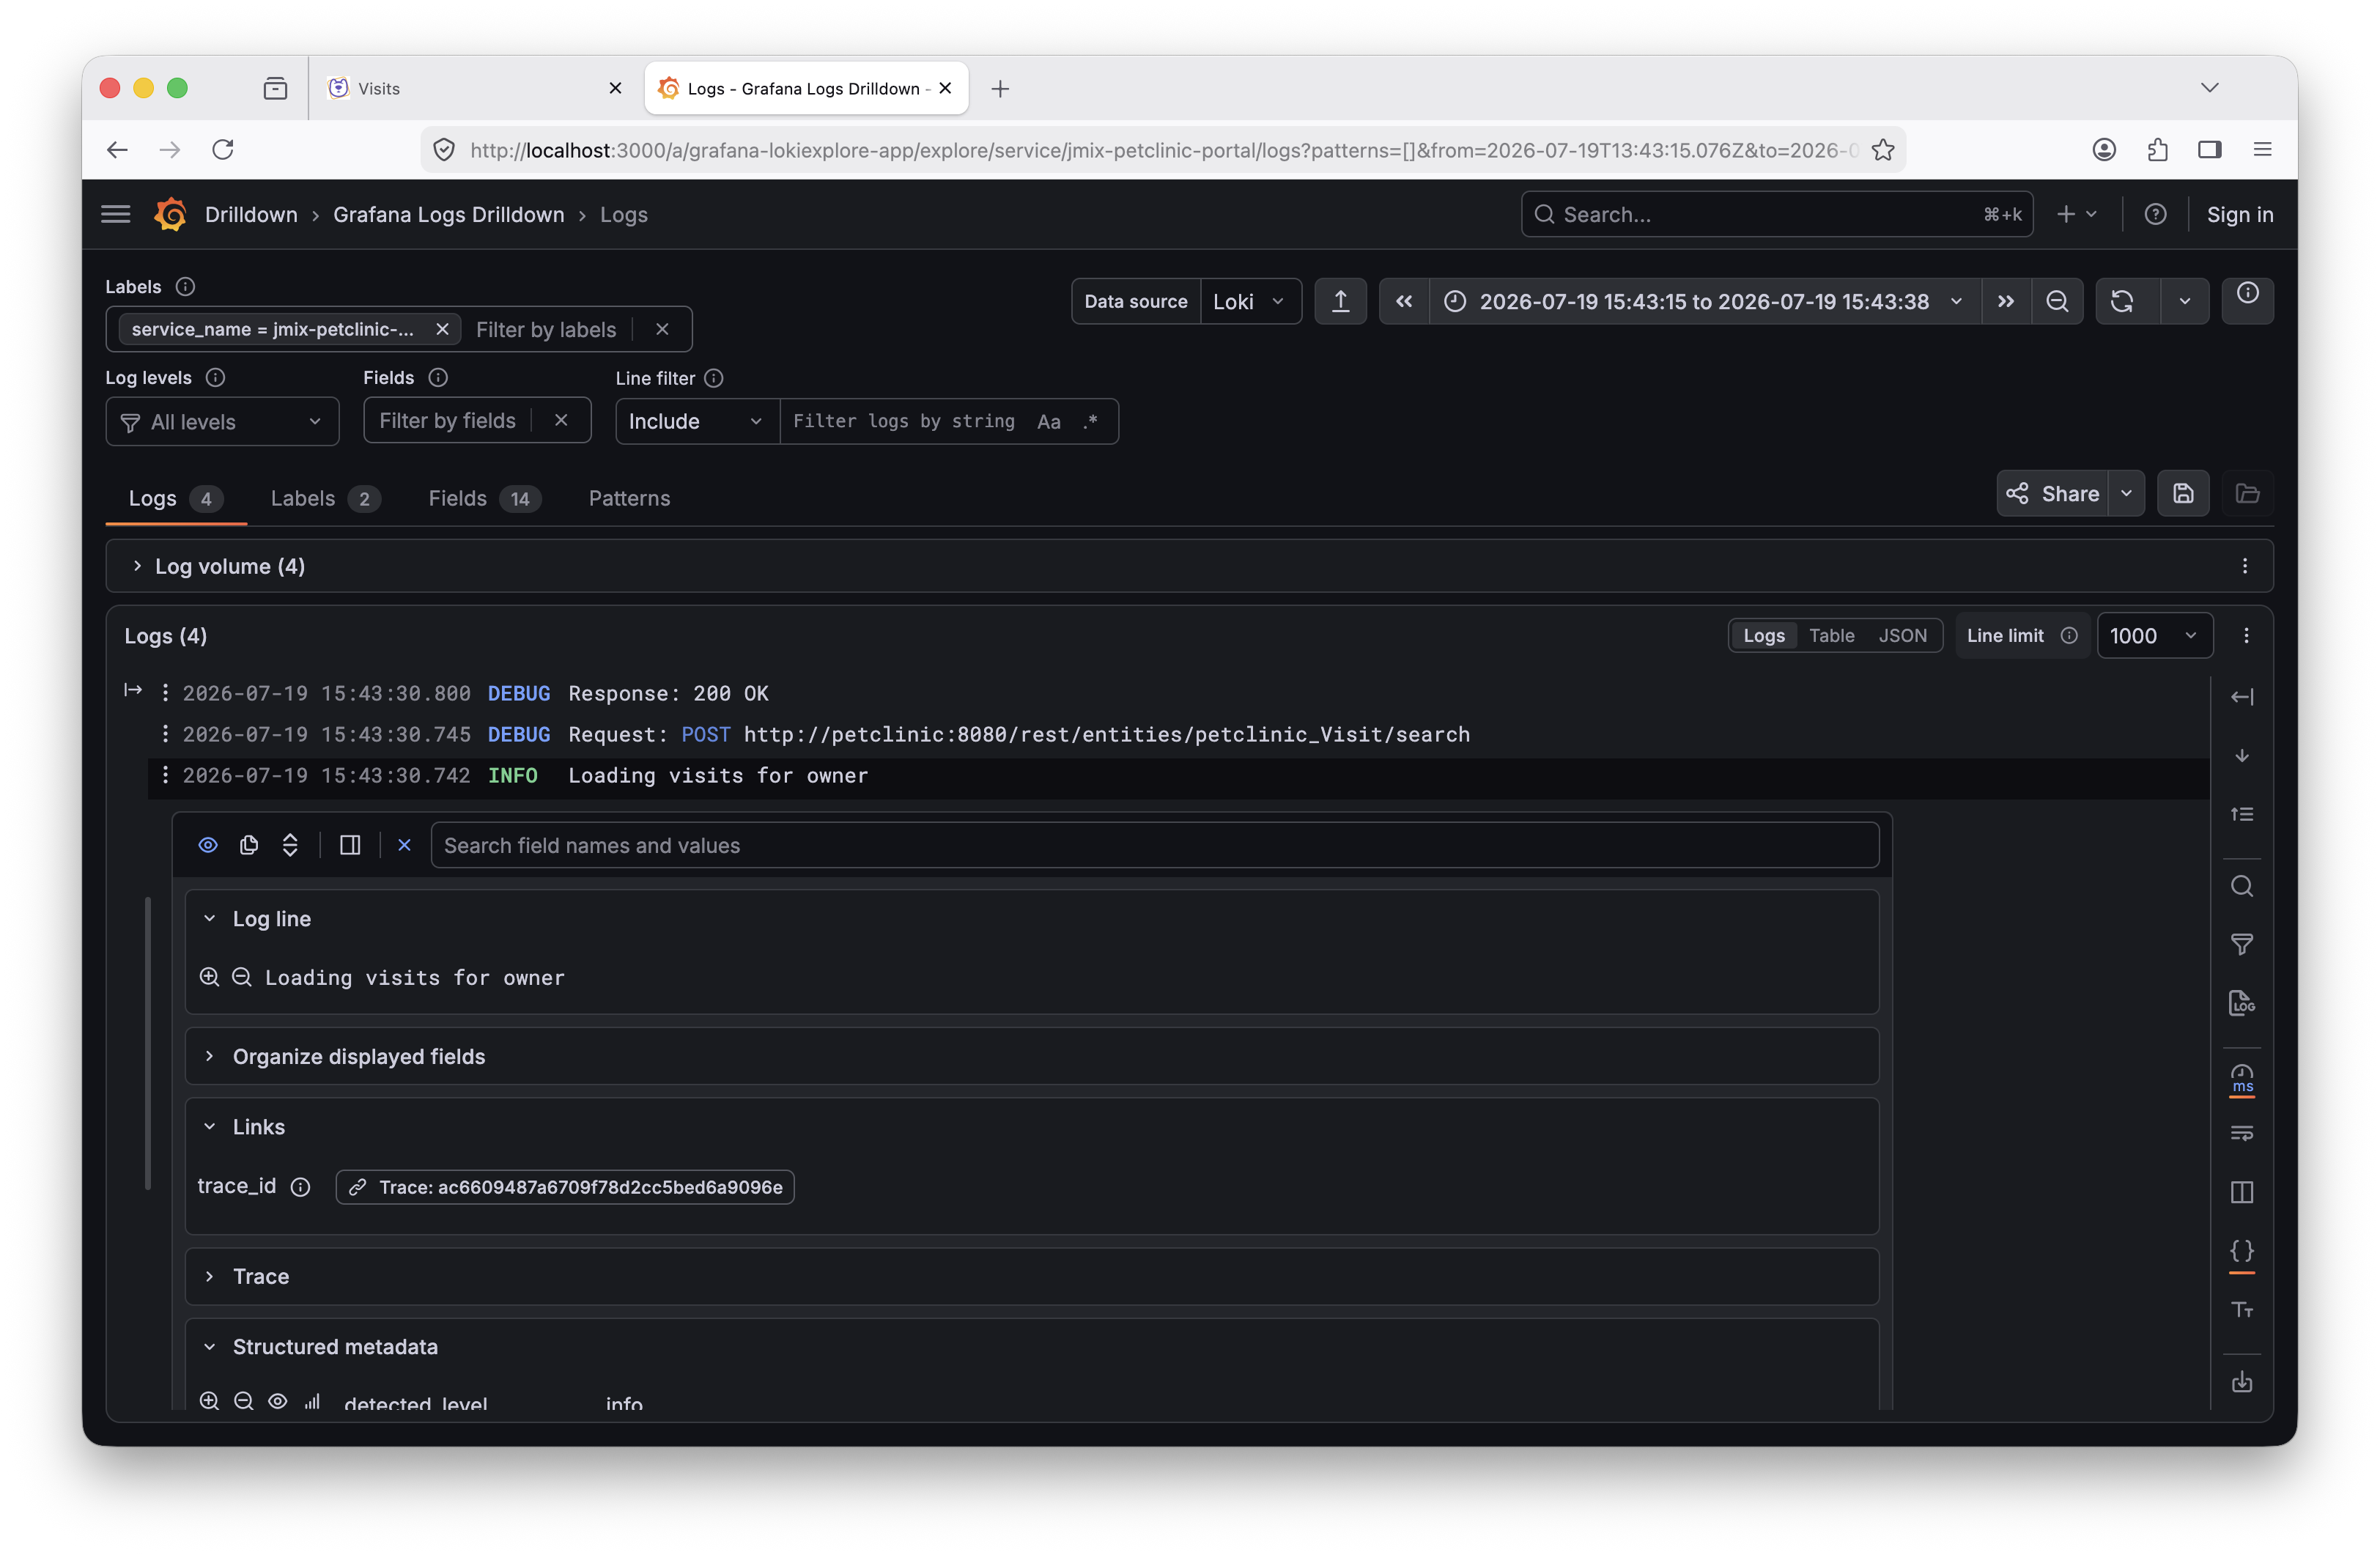
The first log entry, "Loading visits for owner", includes the trace_id for the interaction. A second log message from the UI controller contains the same value because both log records were created while the same trace was active.
The OpenTelemetry Logback appender adds the active trace and span identifiers to each exported log record. This is the correlation mechanism that connects logs from different services to one trace.
Clicking the trace link opens the complete distributed trace in Tempo:
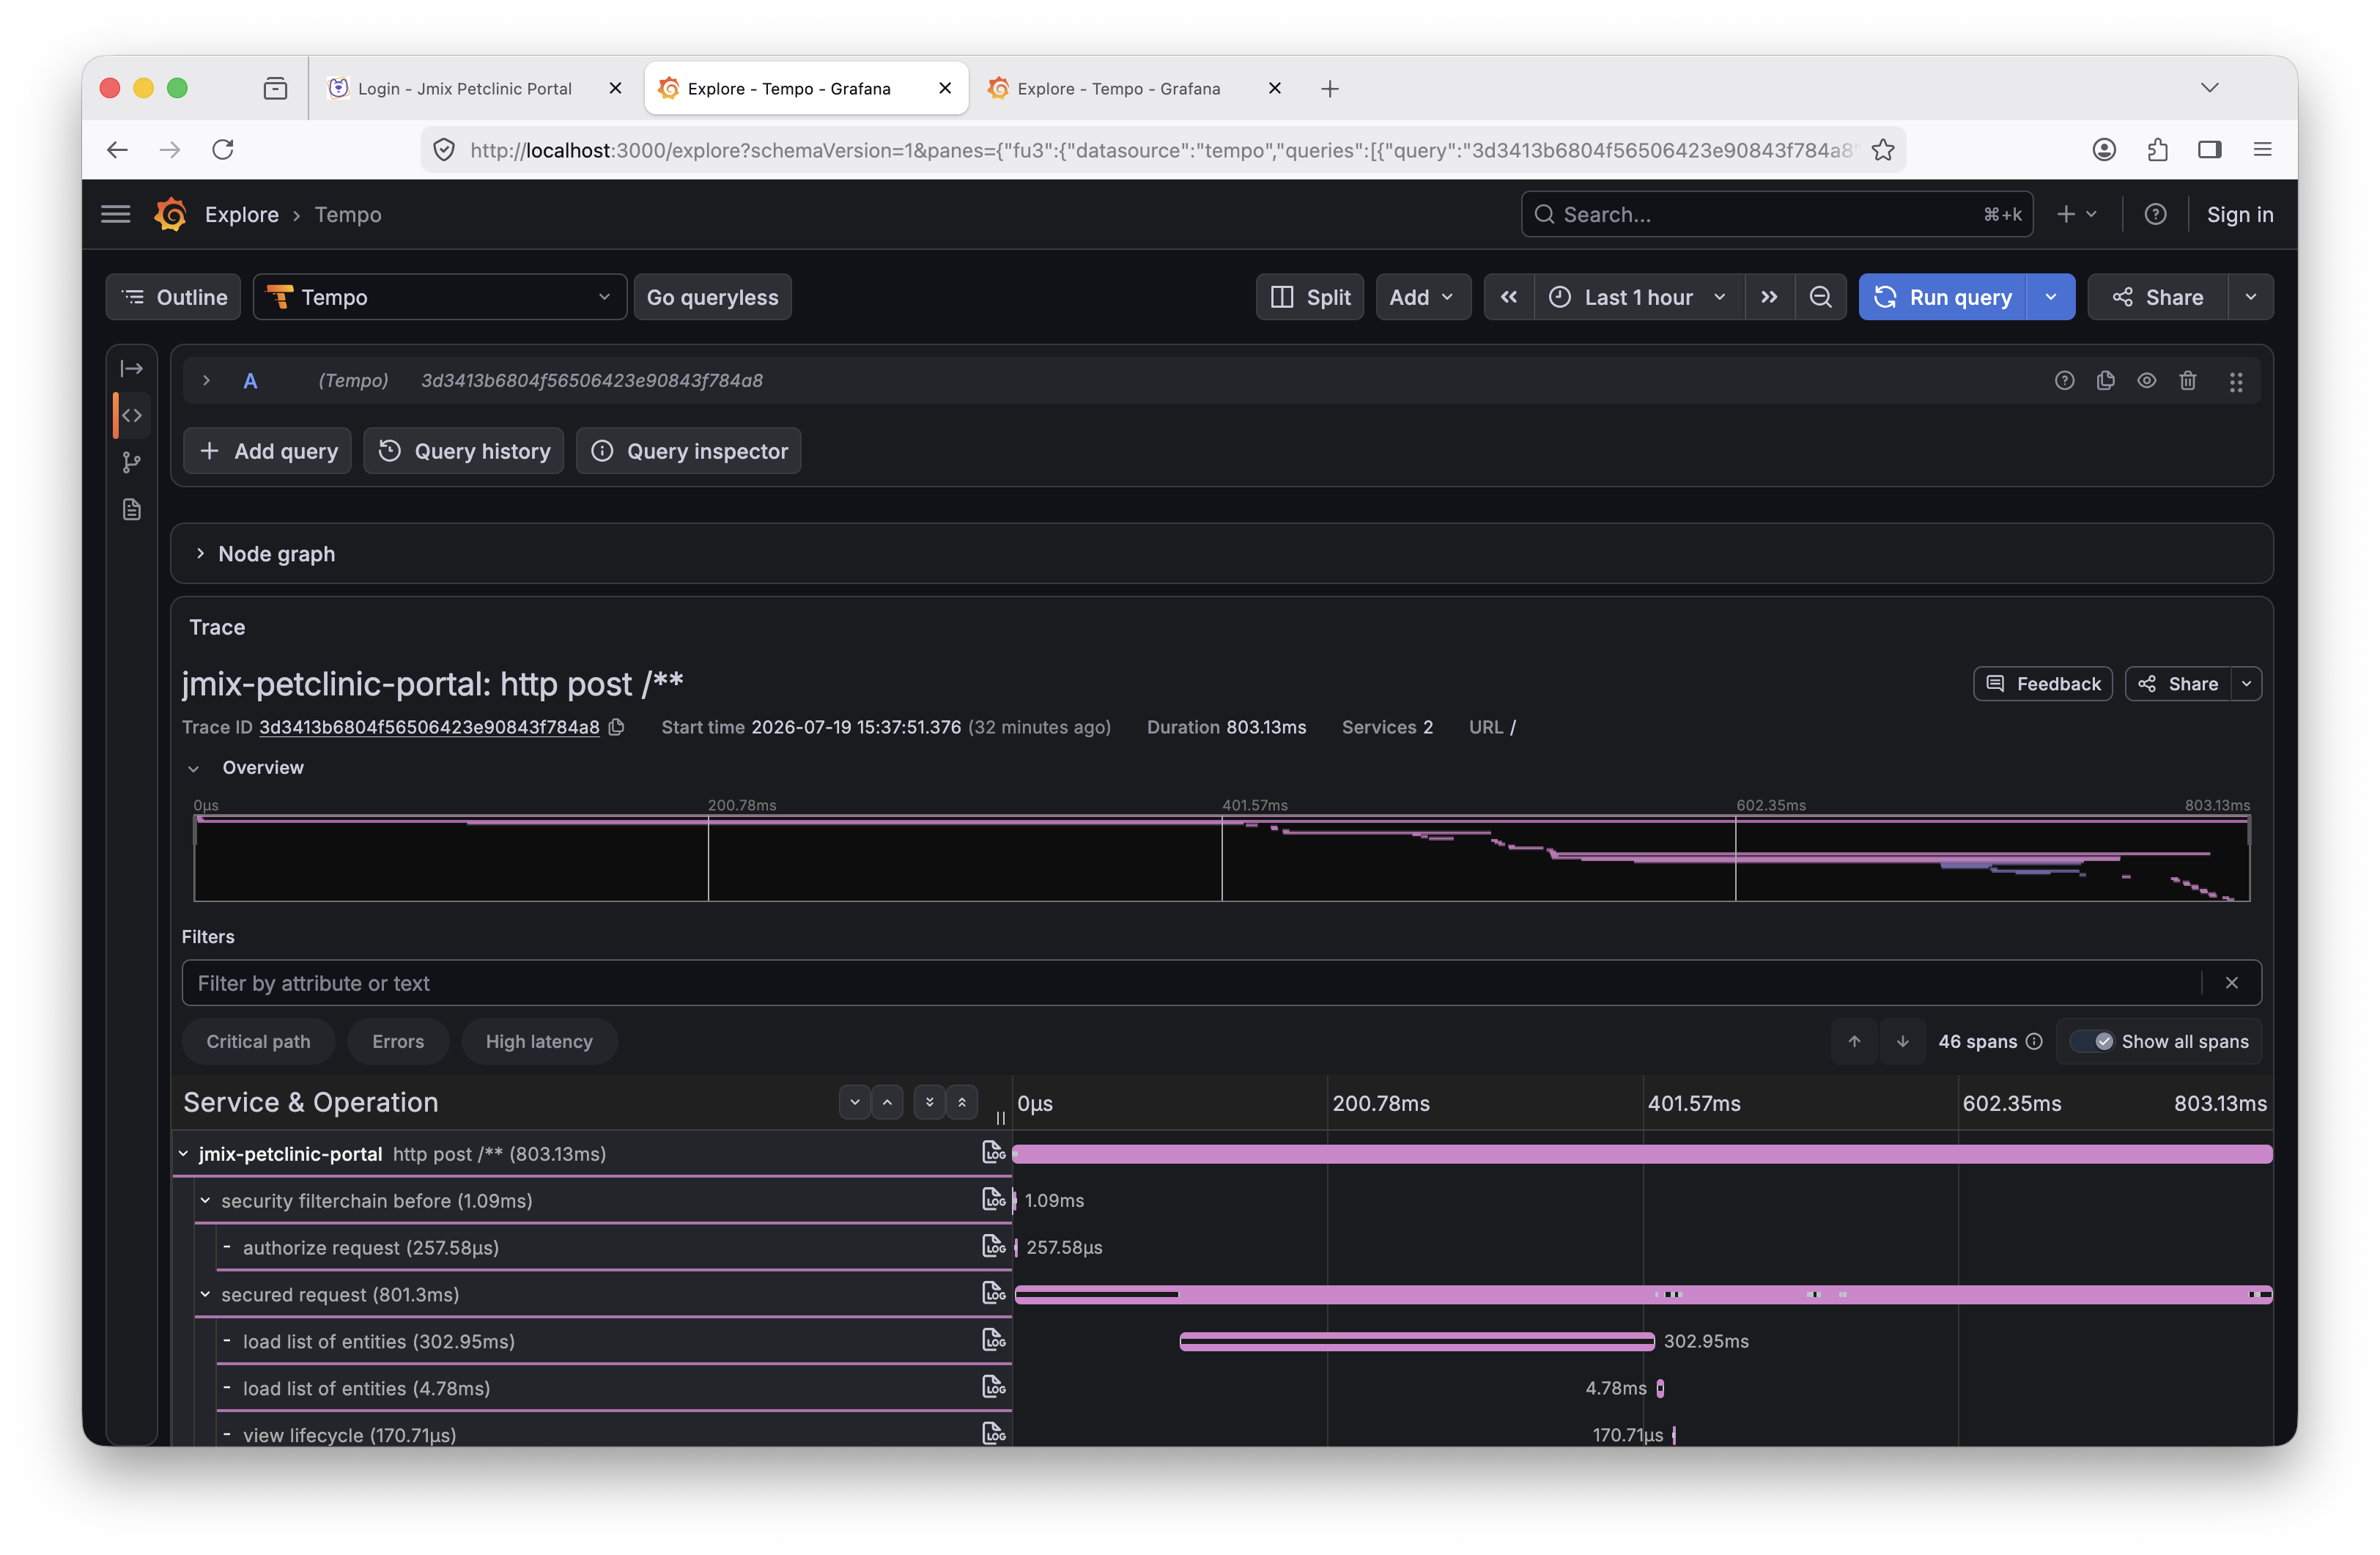
The trace view shows the complete request flow across both services. It includes jmix-petclinic-portal and the jmix-petclinic Backend.
The entries in the tree represent the spans in the trace. In the next steps, we will first inspect what happened in the Portal UI and then follow the data access into the Backend.
Inspecting Jmix UI Observations
Near the beginning of the Portal part of the trace, a view lifecycle span represents the visit list. Its view.id, view.class, and lifecycle.name attributes identify the Jmix view and the lifecycle phase. These spans appear because jmix.ui.ui-observation-enabled is enabled in the Portal configuration.
The visit list renders each result using a VisitCard fragment. Its initialization appears as fragment lifecycle spans in the same trace. Their attributes identify the fragment class and instance, its parent view, and the observed lifecycle phase.
Farther down the trace, data loader lifecycle spans show the preLoad, load, and postLoad phases that Jmix runs while the view obtains its data. They mark the boundary between UI processing and data access.
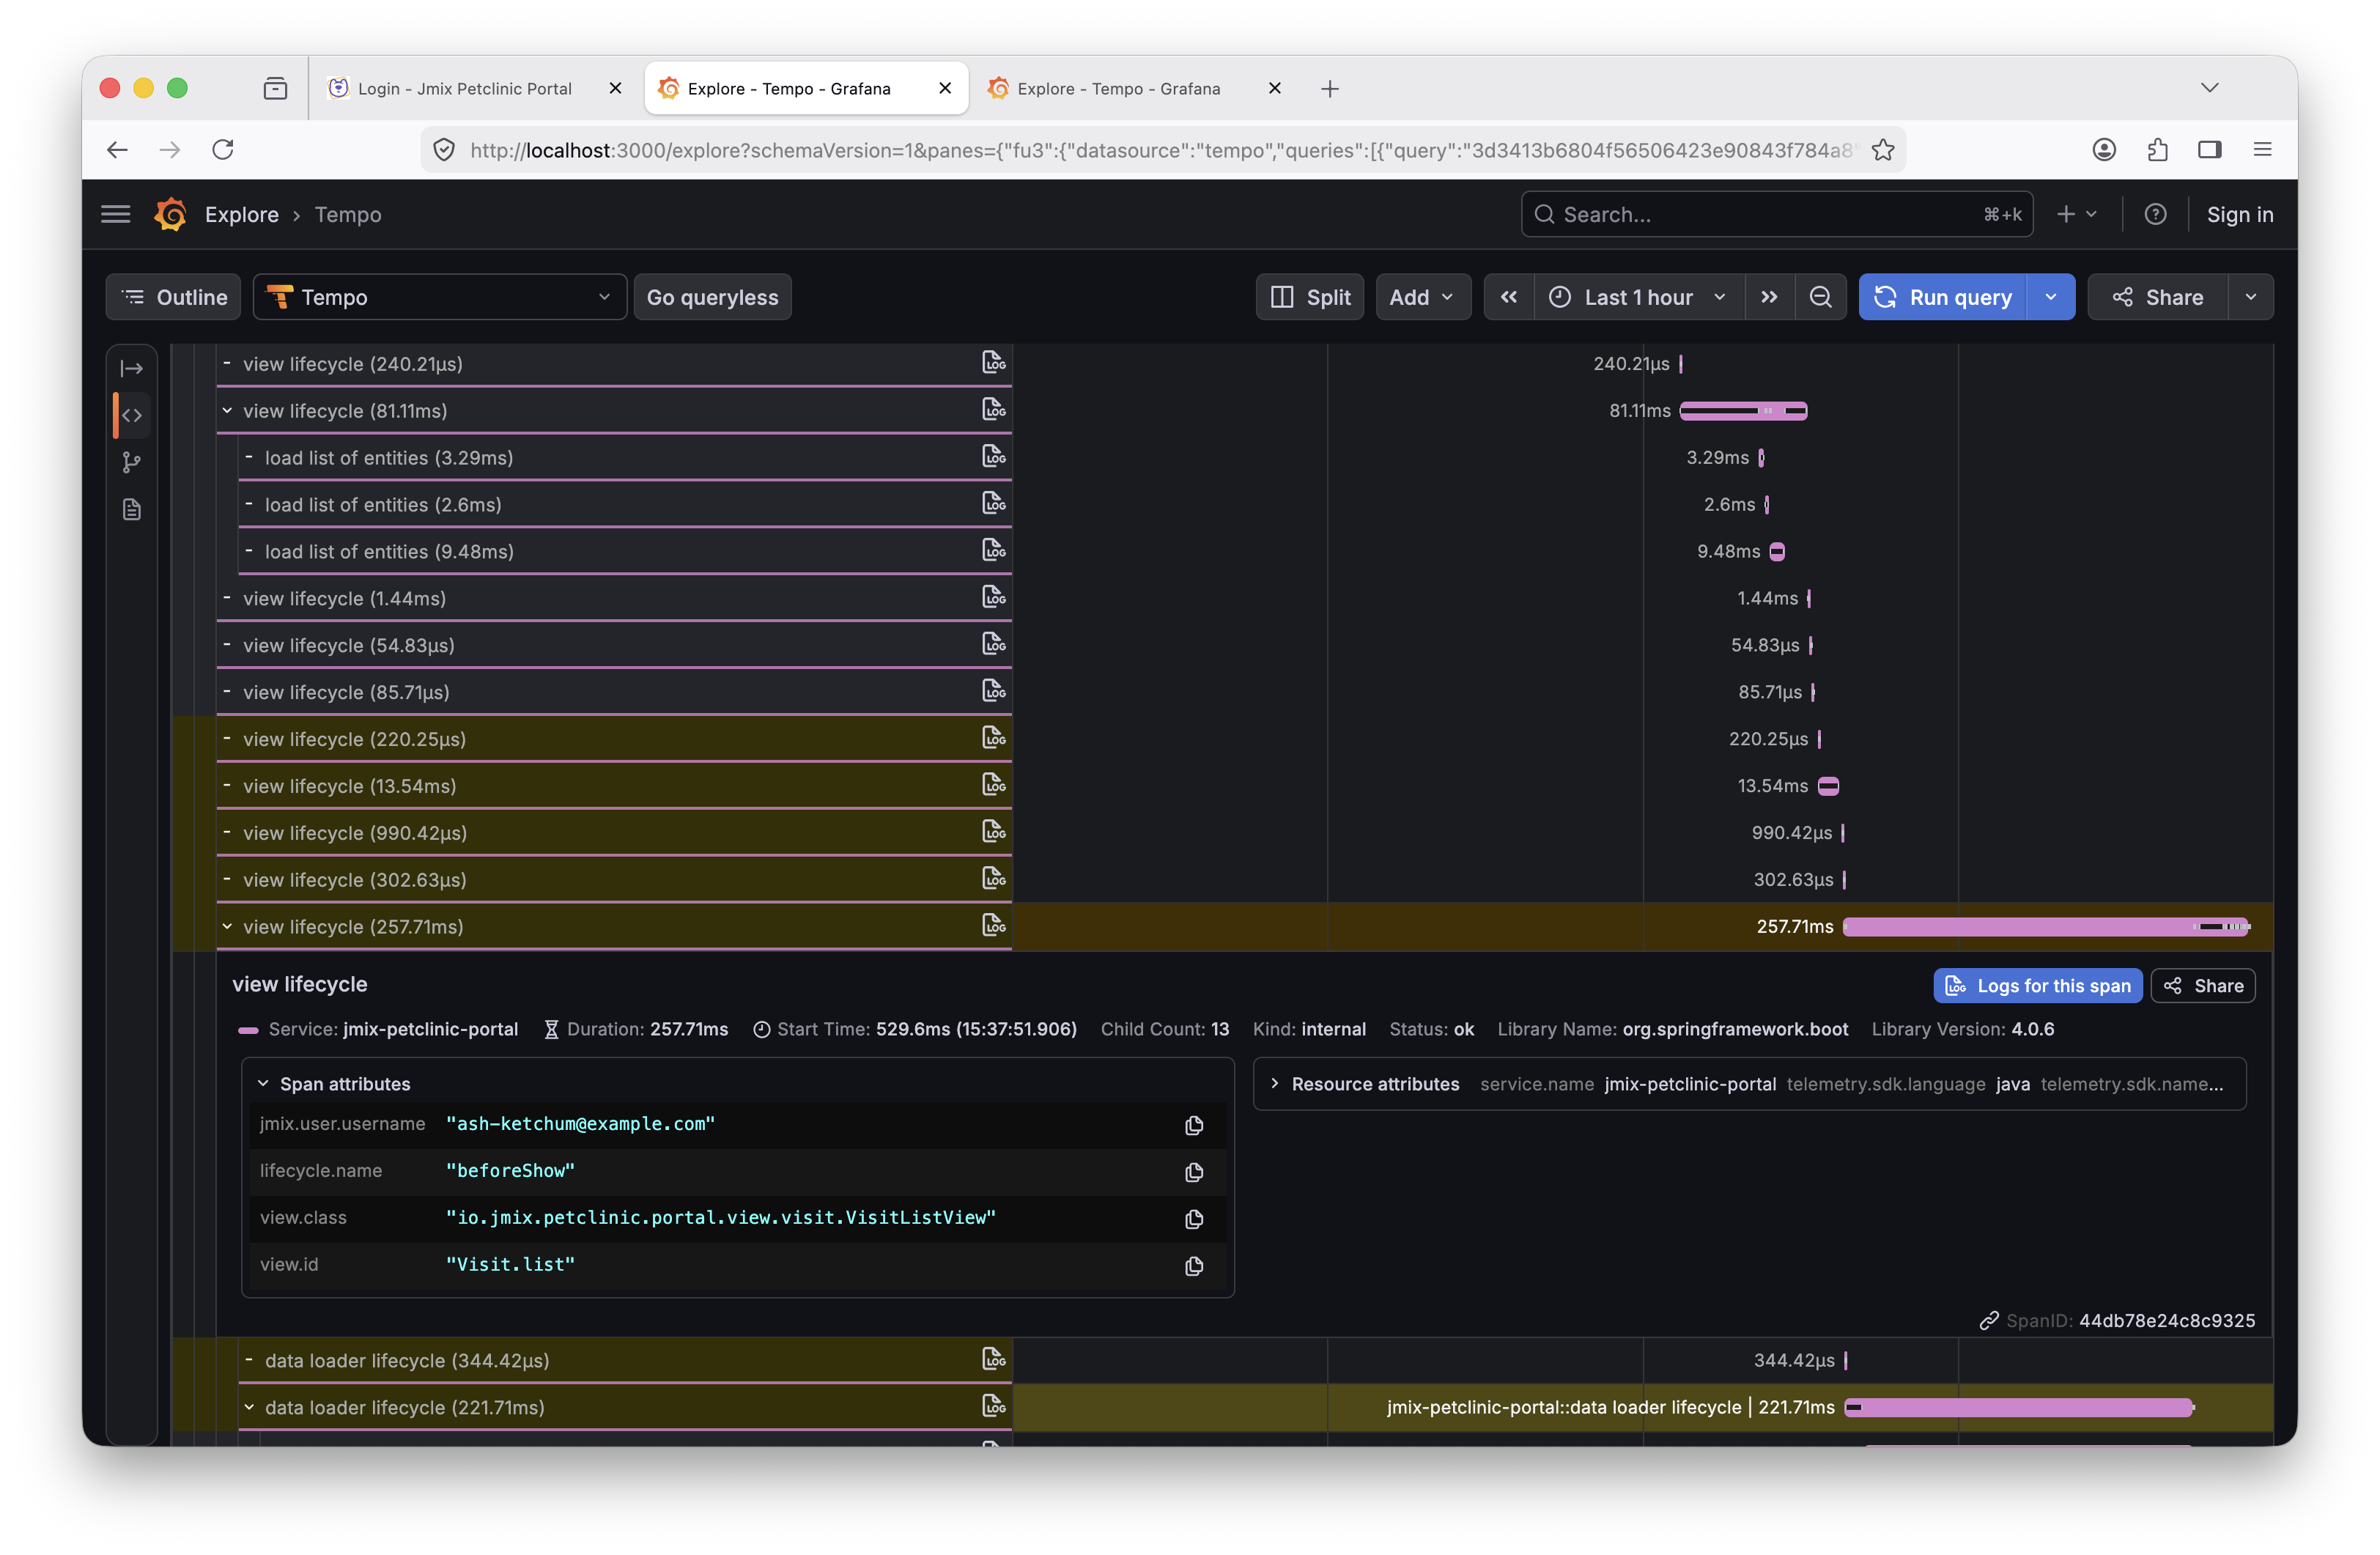
Opening Details on one of the visit cards produces an execute action span in the Portal trace. Its action.id identifies the card’s detailsAction, while the view and fragment attributes locate the action in the UI. The subsequent view lifecycle spans show Jmix opening the visit detail view.
These built-in Jmix tracing observations cover view and fragment lifecycle phases, data-loader phases, and action execution. The same visit-list trace continues from the data loader into the data-access layer.
Following Data Access Through the REST DataStore
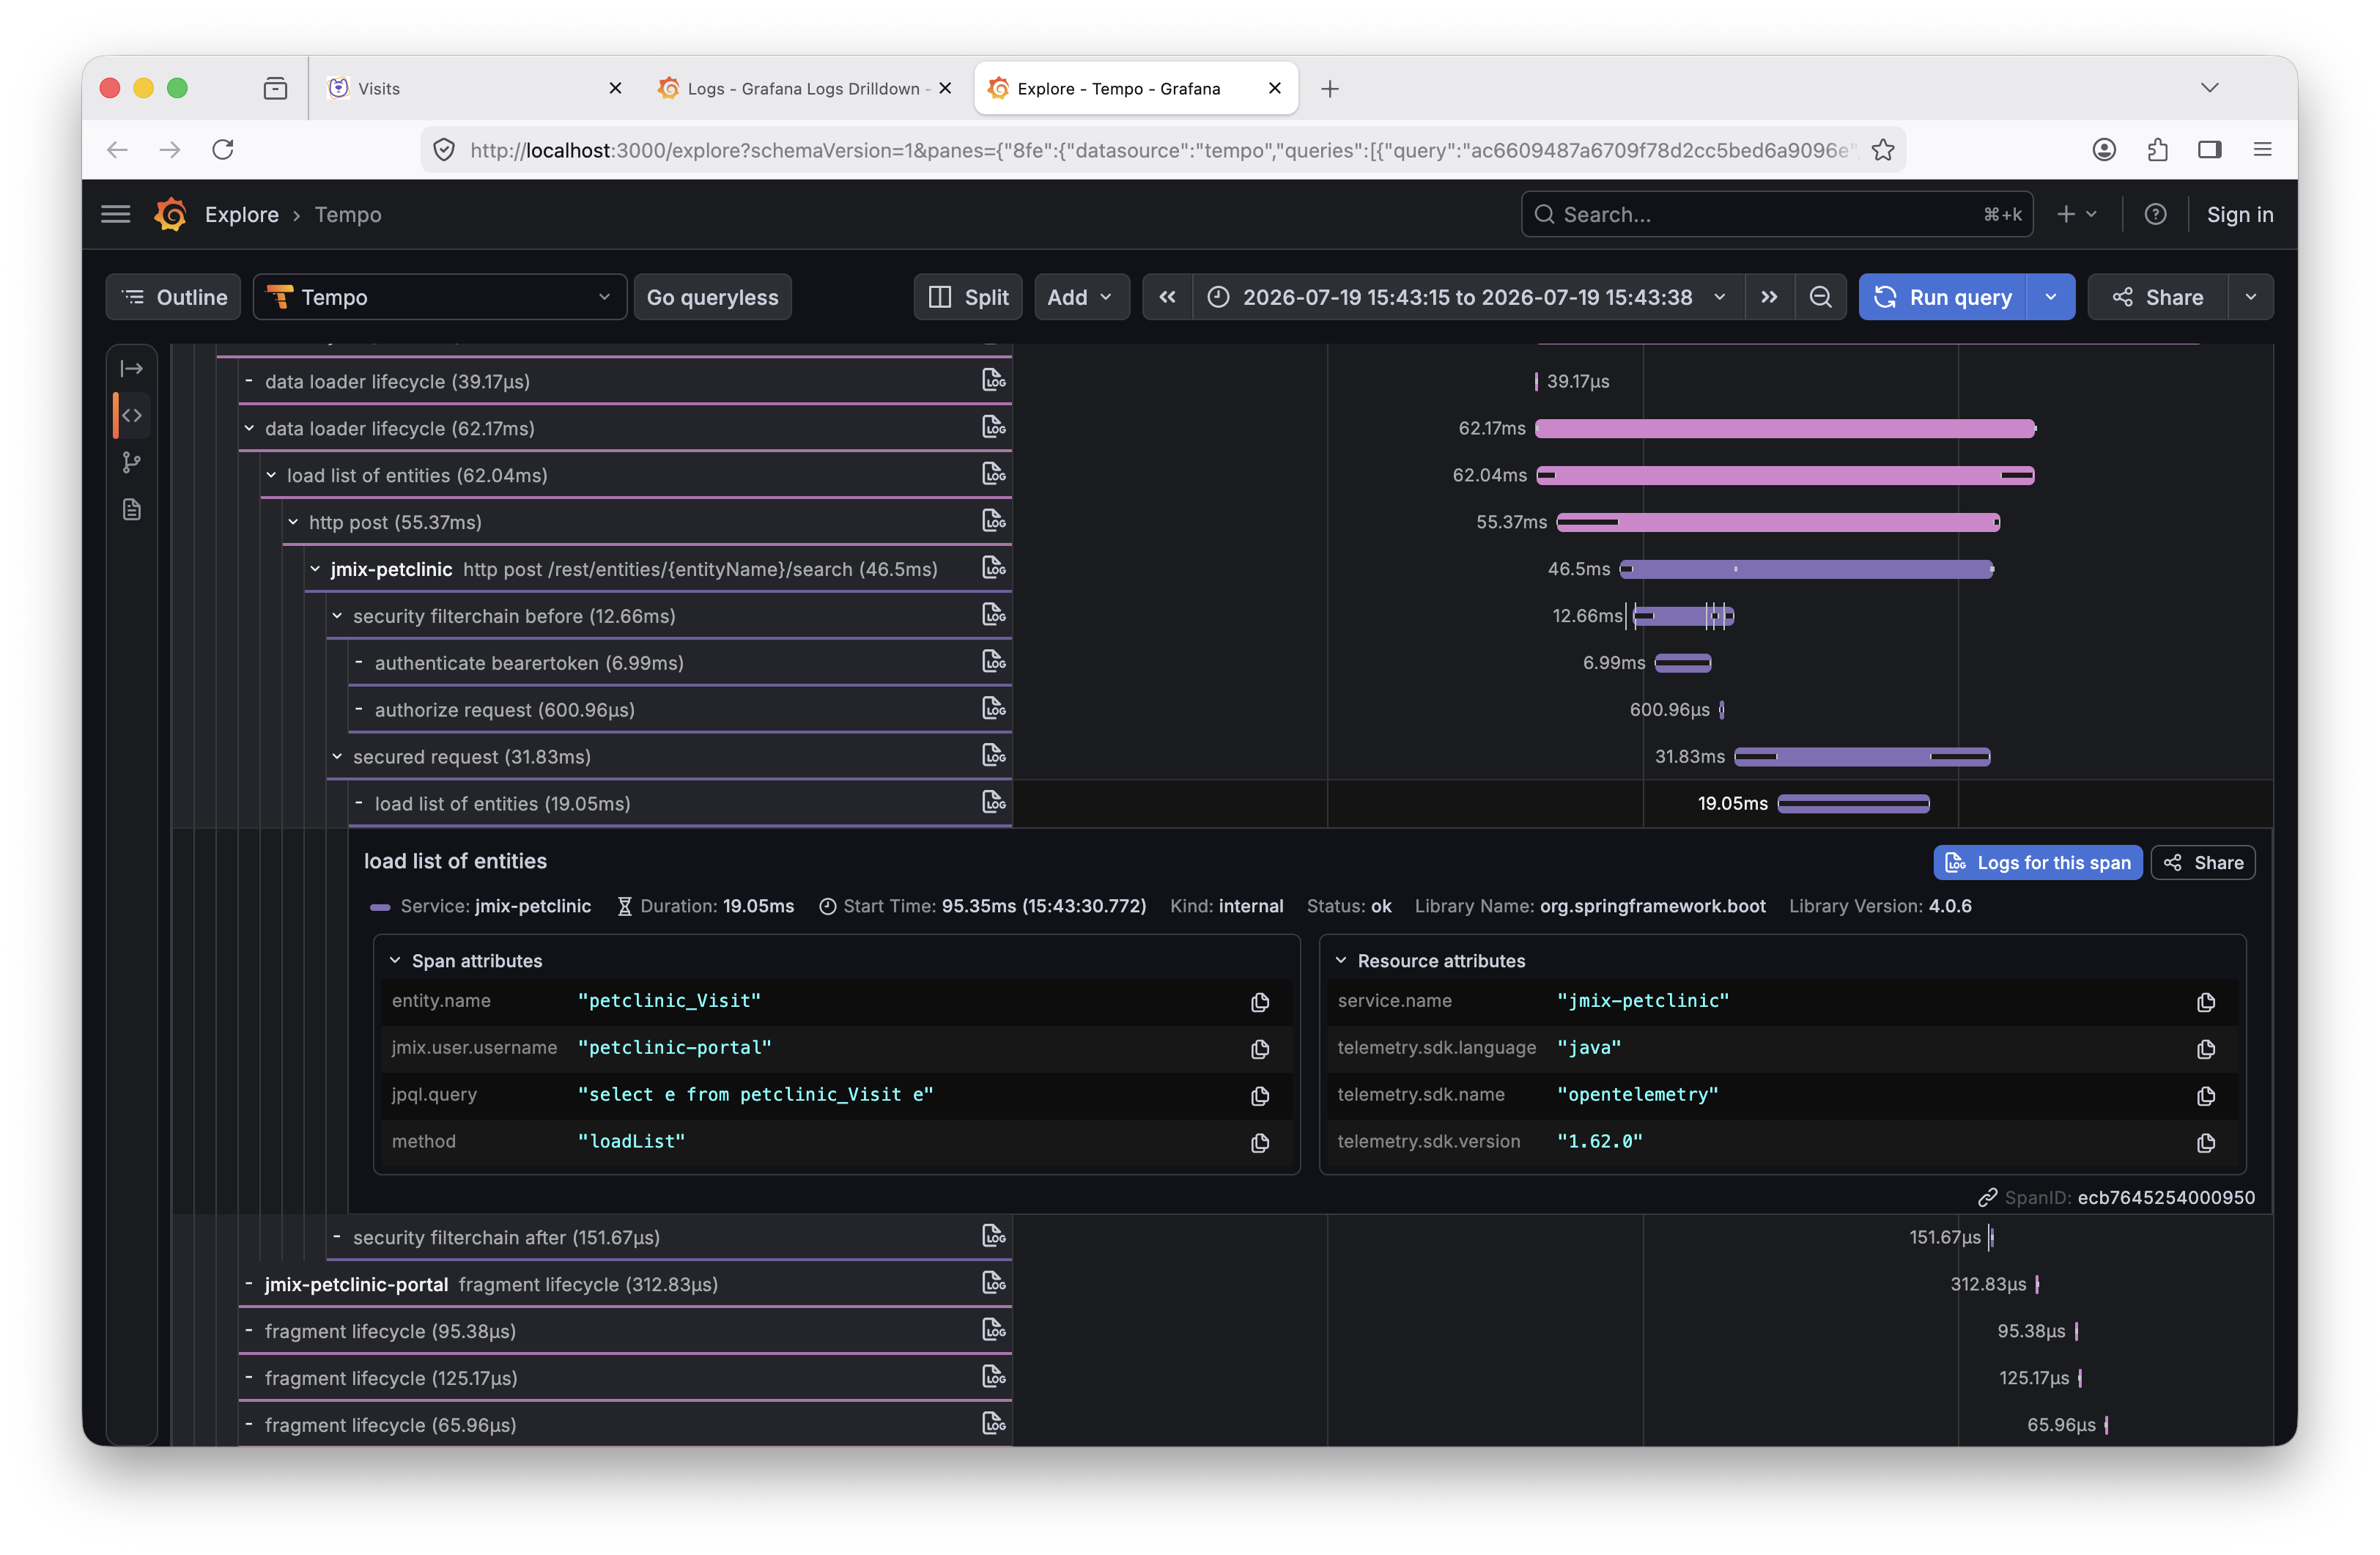
The data loader asks the Jmix data layer for the visit entities. The corresponding load list of entities span includes an entity.name attribute and is created because jmix.core.data-observation-enabled is enabled.
The Portal does not store the visits locally. Its DataManager delegates the load operation to the REST DataStore. The Portal’s outgoing http post span below load list of entities is connected to the Backend’s incoming http post /rest/entities/{entityName}/search span. Both belong to the same trace because the REST DataStore propagates the active trace context.
In the Backend part of the trace, another load list of entities span shows where Jmix loads the visit entities from the Backend database. The trace therefore connects the data operation in the Portal with the corresponding data operation in the Backend.
The jmix.user.username attributes differ between the two services. The Portal spans contain the logged-in pet owner, while the Backend spans contain the technical user used by the Portal’s REST DataStore. Jmix adds this current-user context by default, so the trace shows not only where the request went, but also under which security identity each application processed it.
|
User names make this development trace easier to understand, but observation attributes leave the application and are stored in the observability backend. Production configurations need to account for whether user and tenant identifiers, query text, query parameters, or other data attributes are appropriate for the environment. Setting |
Inspecting the Complete Automatic Trace
The visit trace therefore grows naturally from framework-level observations:
view lifecycle                                 jmix-petclinic-portal
└── data loader lifecycle                      jmix-petclinic-portal
    └── load list of entities                  jmix-petclinic-portal
        └── http post                          jmix-petclinic-portal
            └── http post /rest/entities/...   jmix-petclinic
                └── load list of entities      jmix-petclinic
The exact nesting and number of spans can vary as the UI lifecycle and security processing evolve. In the trace view, span names, service names, and attributes identify the request flow even when the tree structure changes.
The trace we just followed required no tracing code in the application. Spring Boot with Micrometer created the incoming and outgoing HTTP spans. Jmix contributed the view, fragment, action, data-loader, and entity-loading spans that explain what the applications were doing inside those HTTP operations.
These automatic spans answer technical questions: which view was opened, which data was loaded, which service was called, how long each operation took, and where an error occurred. They also make service dependencies visible and separate network latency from application processing time.
The visit-list trace reveals the complete technical flow without application-specific tracing code. We will now look at a different use case and add business meaning that the framework cannot infer automatically.
Adding a Custom Business Span
The visit-list trace showed the technical detail provided by automatic tracing. We will now trace user registration, which consists of several technical operations that together form one business operation.
Registering a Portal User
During registration, we will compare the technical spans created automatically with a custom span that represents the complete business operation.
What Automatic Tracing Shows
Registering a Portal user involves:
-
Saving the Portal user and assigning the owner role.
-
Calling a custom REST service in the Backend.
-
Creating and saving the corresponding Backend owner.
Jmix and Spring Boot already create spans for the individual persistence and HTTP operations. However, the framework cannot infer that these steps belong to one user-registration operation. What is missing is a parent span that names and measures the complete business operation.
We will call this span registerUser and place the existing technical spans underneath it.
Creating the registerUser Observation
Inject ObservationRegistry into UserRegistrationService and wrap the complete registration operation in an Observation:
@Authenticated
public User registerUser(UserRegistrationForm userRegistrationForm) {
    return Observation.createNotStarted("registerUser", observationRegistry)
            .observe(() -> performRegisterUser(userRegistrationForm));

}
Observation.createNotStarted() creates an observation named registerUser. Calling observe() starts the observation, executes the supplied operation, and stops it in a finally block. When tracing is configured, Micrometer turns this observation into an OpenTelemetry span.
The observation surrounds both the Portal persistence operation and the remote Backend call. Their automatically created spans therefore become descendants of the registerUser span. If registration throws an exception, observe() records it and marks the custom span as failed.
|
Stable, low-cardinality span names such as |
Inspecting the Extended Trace
To create and inspect the custom span:
-
Open the Portal at http://localhost:8081.
-
Select Register on the login page and complete the registration form.
-
Open Explore in Grafana and select the Tempo data source.
-
Use the query builder to filter by the
jmix-petclinic-portalservice and theregisterUserspan name. -
Open the matching trace.
The trace contains a hierarchy similar to the following:
registerUser                                     jmix-petclinic-portal
├── save entities                                jmix-petclinic-portal
└── http post                                    jmix-petclinic-portal
    └── http post /rest/services/{serviceName}/{methodName}
        ├── security and authentication spans    jmix-petclinic
        └── save entities                        jmix-petclinic
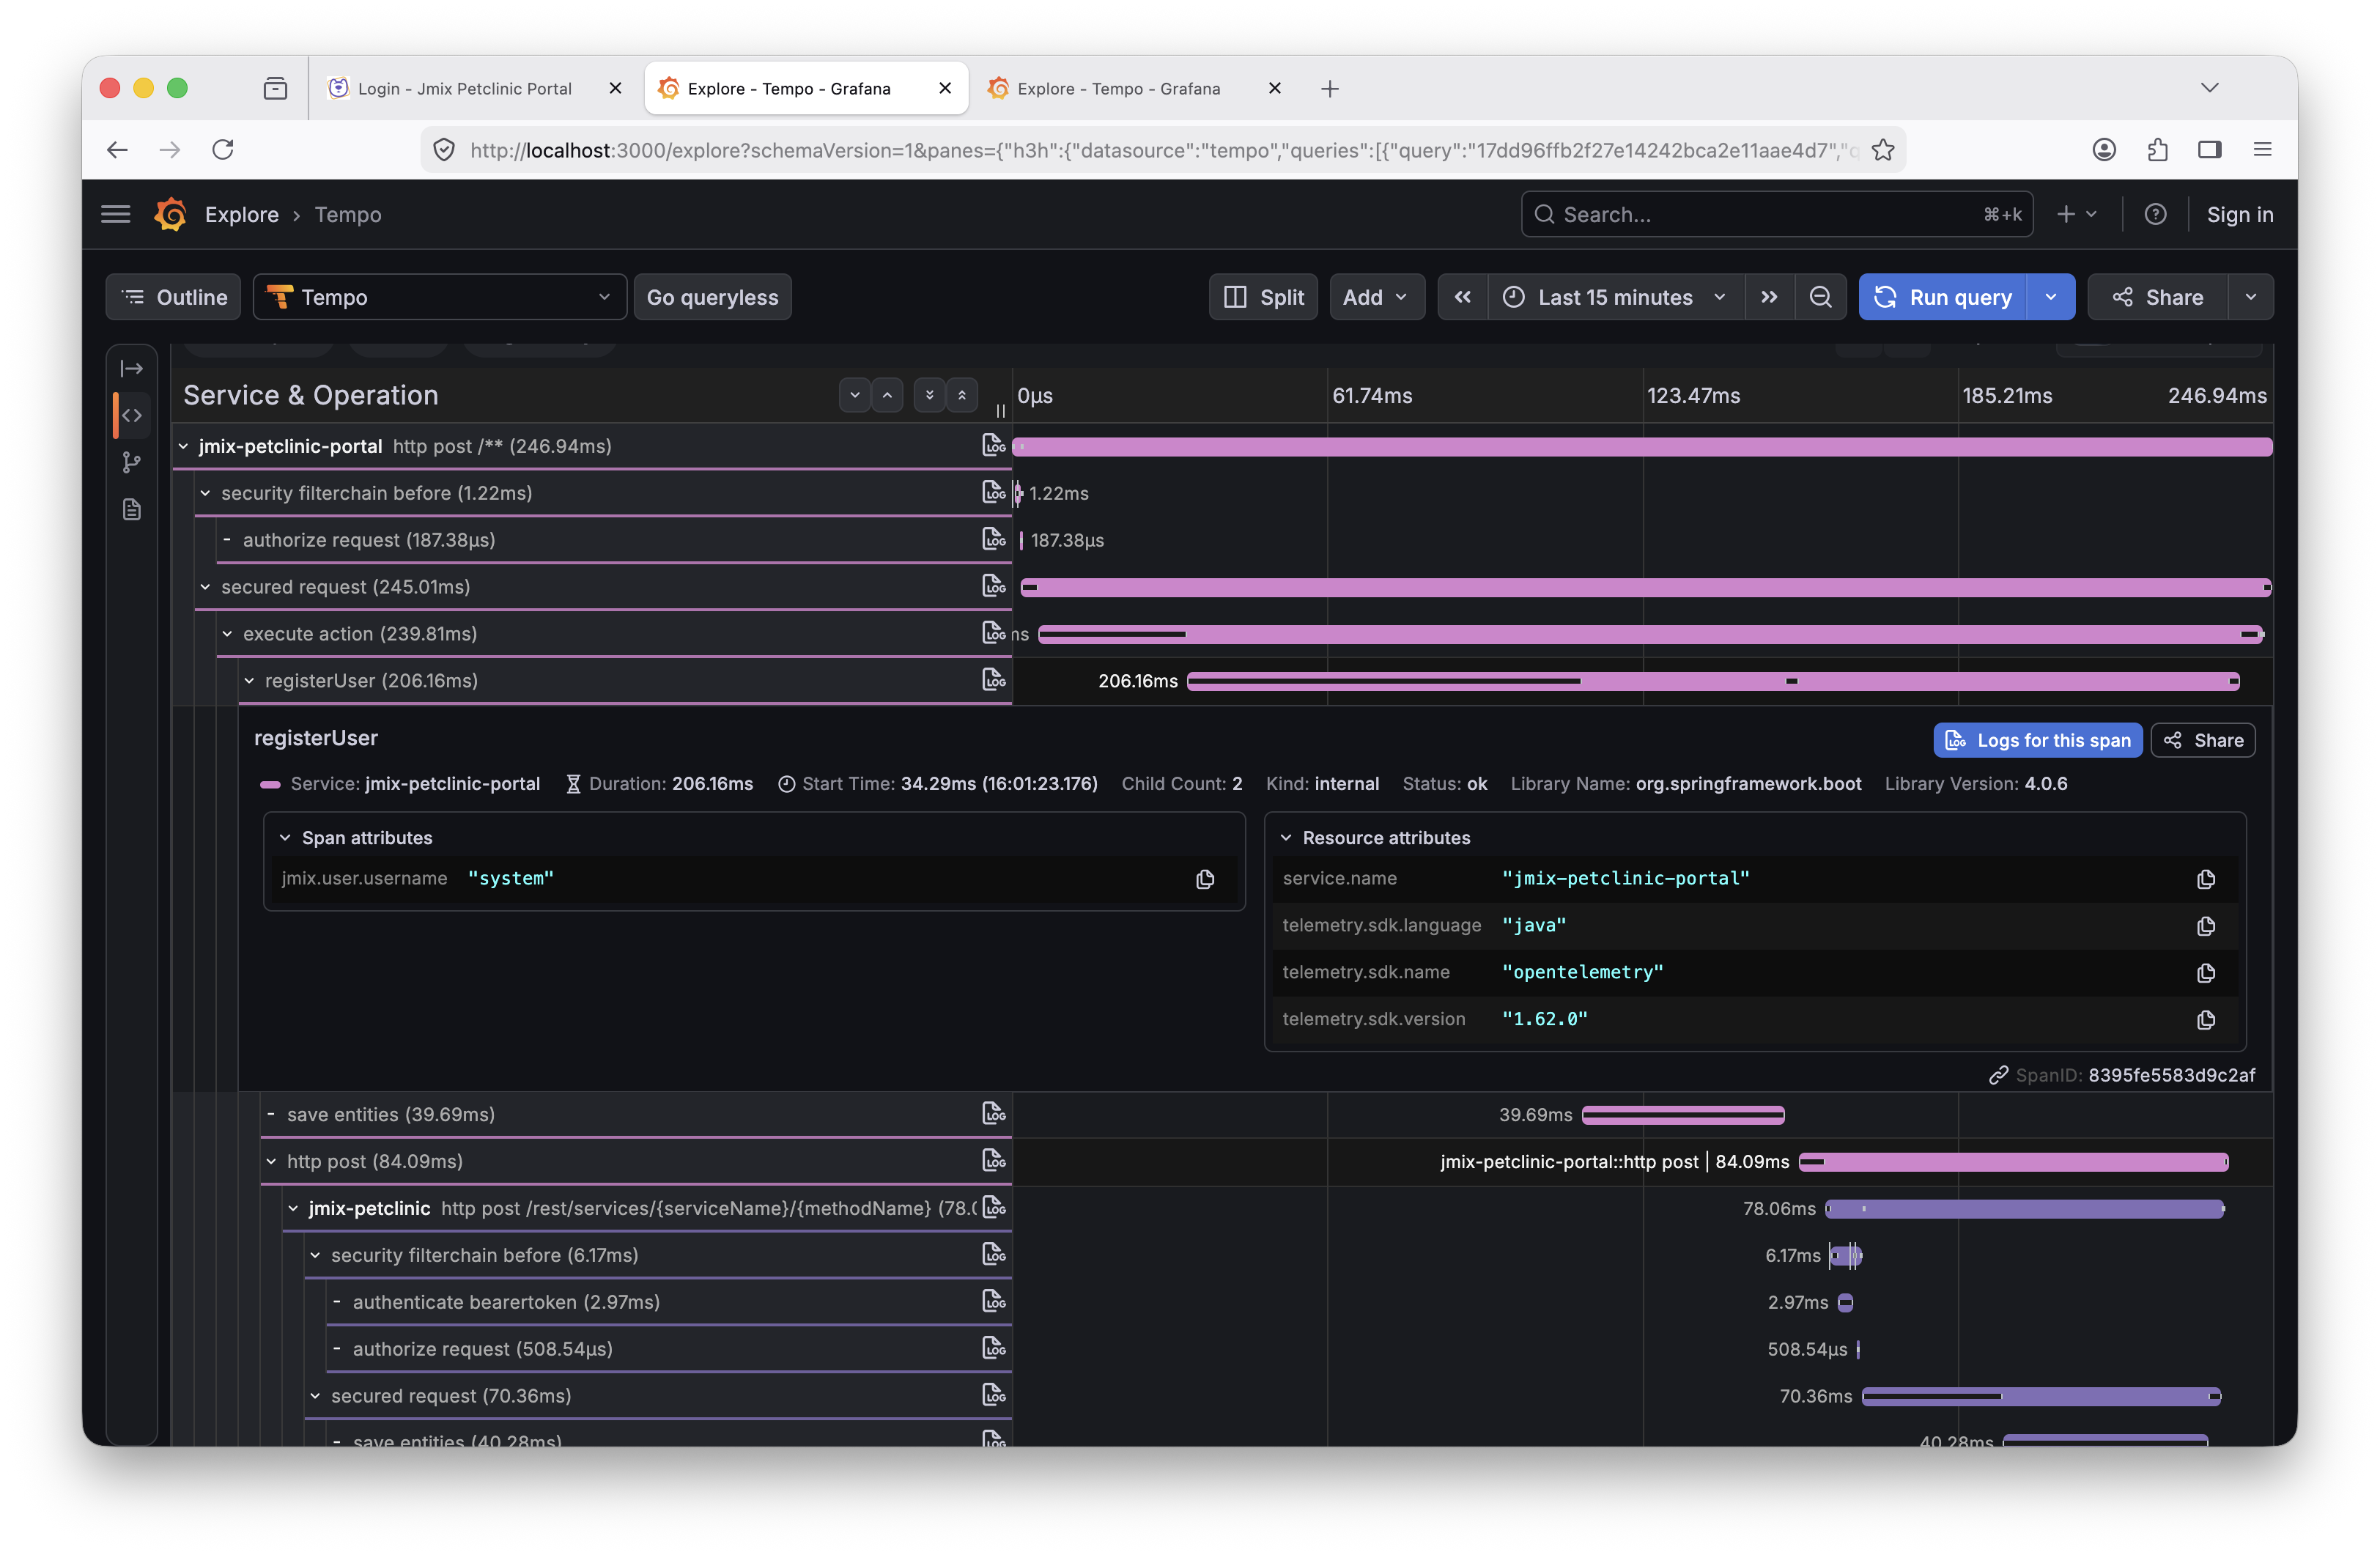
The registerUser span provides the business boundary. The child spans show where time is spent in the Portal, the network call, Backend security, and Backend persistence. All spans share one trace ID because Spring Boot propagates the trace context with the outbound HTTP request.
The exact number of spans can vary as Jmix and Spring Security instrumentation evolves. The parent-child relationship and the shared trace ID are more relevant than a fixed span count.
Custom Span Guidelines
Custom observations are most useful around meaningful business operations rather than every method. Automatic instrumentation already covers the technical details.
The following guidelines keep custom spans useful and manageable:
-
A custom span gives a group of technical spans a useful business name.
-
Span names remain stable and low-cardinality.
-
The observation surrounds the complete operation whose duration and outcome matter.
-
Exceptions propagate through
observe()so Micrometer can record the error. -
Personal or sensitive data requires careful handling and should not appear in span names.
Troubleshooting
No Traces in Tempo
The tracing setup depends on the following conditions:
-
Both applications include
spring-boot-starter-opentelemetry. -
management.opentelemetry.tracing.export.otlp.endpointpoints tolocalhost:4318/v1/tracesfor locally running applications orlgtm:4318/v1/tracesinside Docker. -
management.tracing.sampling.probabilityis greater than0. -
The LGTM container is running and port
4318is available.
Portal and Backend Appear as Separate Traces
Separate traces indicate that the HTTP client did not propagate the current trace context. Spring Boot instruments clients created from its auto-configured builders. The Jmix REST DataStore used by this sample participates in that instrumentation and sends the W3C traceparent header automatically.
Custom HTTP integrations need to obtain RestClient.Builder, RestTemplateBuilder, or WebClient.Builder from Spring Boot’s auto-configuration so that trace context propagation remains active.
Traces Exist but Logs are not Correlated
The OpenTelemetry starter does not include a logging appender. Log and trace correlation requires the following configuration:
-
The OpenTelemetry Logback appender dependency is present.
-
logback-spring.xmlreferencesOpenTelemetryAppender. -
OpenTelemetryAppender.install(openTelemetry)runs during application startup. -
management.opentelemetry.logging.export.otlp.endpointpoints to the Collector’s/v1/logsendpoint.
An outdated appender version can also cause class loading errors when its OpenTelemetry API version does not match the version managed by Jmix. The sample project provides the compatible version.
Summary
In this guide, we added distributed tracing to the Petclinic Backend and Portal applications. The Grafana OpenTelemetry LGTM stack provided the local Collector and tracing backend, while Spring Boot’s spring-boot-starter-opentelemetry connected Micrometer observations to OpenTelemetry and exported spans from both applications using OTLP.
Jmix contributed observations for Flow UI lifecycles, actions, data loaders, and data access without requiring tracing code in the application. Spring Boot added the HTTP spans and propagated the active trace context with the REST DataStore request. As a result, Tempo could assemble the incoming Portal request, UI processing, Backend security, and persistence operations into one distributed trace. Trace and span identifiers on the exported Logback records connected the same request flow with its application logs.
The custom registerUser observation added a business-level boundary around user registration. Its automatically created persistence and HTTP child spans showed how custom observations complement the technical detail provided by Jmix and Spring Boot. Together, automatic and custom tracing make request flows, latency, and failures visible while OTLP keeps the applications independent of a particular observability backend.