Radar Chart
In this section, you will:
-
Create a radar chart
-
Add
indicator, andtitleelements -
Bind data through a data container
Radar Chart Setup
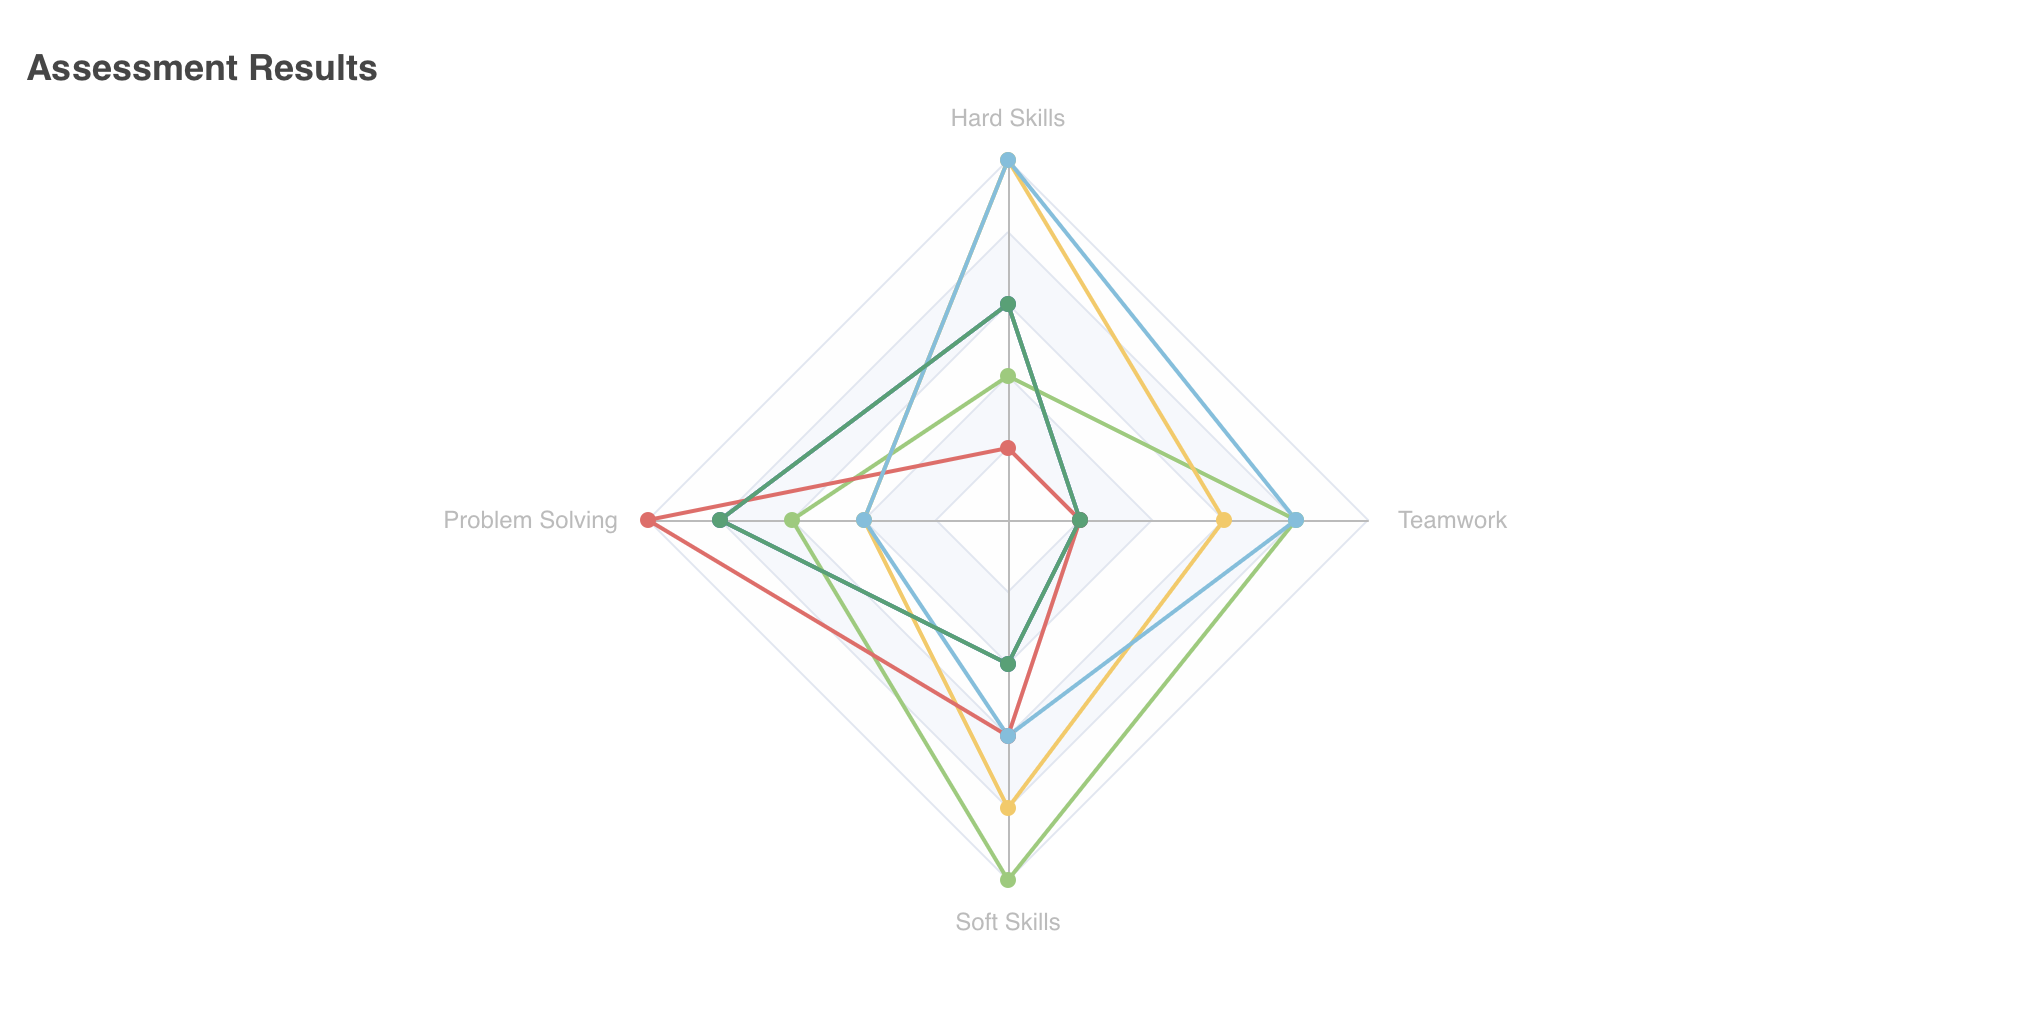
You will integrate a radar chart component to illustrate the employees' skill metrics, namely: hardSkills, problemSolving, softSkills and teamwork.
Setting Radar Chart Series
Let’s insert the chart component in user-list-view.xml.
First, click on the formLayout where the chart will be located.
Choose Add Component in the actions panel and select the Chart item to insert the <charts:chart/> element. Configure the id, height and width attributes as follows.
<charts:chart id="radar" width="40em" height="100%" minHeight="30em" alignSelf="STRETCH">Next, add a radar series to your chart. Click on the chart element in the Jmix UI structure panel or in the view XML descriptor, then click the Add button in the inspector panel. Choose Series → Radar from the drop-down list.
<charts:series>
    <charts:radar/>
</charts:series>
Adding Chart Properties
Indicators
A radar chart with multiple axes requires indicators within a separate radar element under chart. The indicators represent each metric’s axis.
To add indicators, create a <charts:radar/> element manually. Select the radar element and choose Add → Indicators → Indicator.
Define each skill as an indicator with name and max value attributes to represent the scale as follows.
<charts:radar>
    <charts:indicators>
        <charts:indicator name="Hard Skills" max="5"/>
        <charts:indicator name="Problem Solving" max="5"/>
        <charts:indicator name="Soft Skills" max="5"/>
        <charts:indicator name="Teamwork" max="5"/>
    </charts:indicators>
</charts:radar>Data Binding Using Data Container
For your radar chart, you can use the emloyeesDc data container you’ve set in the bar chart section.
To include the fetched data to the chart, select the chart component and add a dataSet attribute manually.
<charts:dataSet/>Inside the dataSet tag, choose the employeesDc container for your source attribute. The radar chart only needs a valueFields as its axes.
<charts:title text="Assessment Results"/>Once you complete these steps, your bar chart XML configuration will be as follows.
<charts:chart id="radar" width="40em" height="100%" minHeight="30em" alignSelf="STRETCH">
    <charts:title text="Assessment Results"/>
    <charts:dataSet>
        <charts:source dataContainer="employeesDc"
                       valueFields="hardSkills problemSolving softSkills teamwork"/>
    </charts:dataSet>
    <charts:radar>
        <charts:indicators>
            <charts:indicator name="Hard Skills" max="5"/>
            <charts:indicator name="Problem Solving" max="5"/>
            <charts:indicator name="Soft Skills" max="5"/>
            <charts:indicator name="Teamwork" max="5"/>
        </charts:indicators>
    </charts:radar>
    <charts:series>
        <charts:radar/>
    </charts:series>
</charts:chart>
This radar chart is set up to visually represent employees' skills.