RadarChart
The RadarChart component allows you to create radar/polar charts.
RadarChart
Components XML name: chart:radarChart.
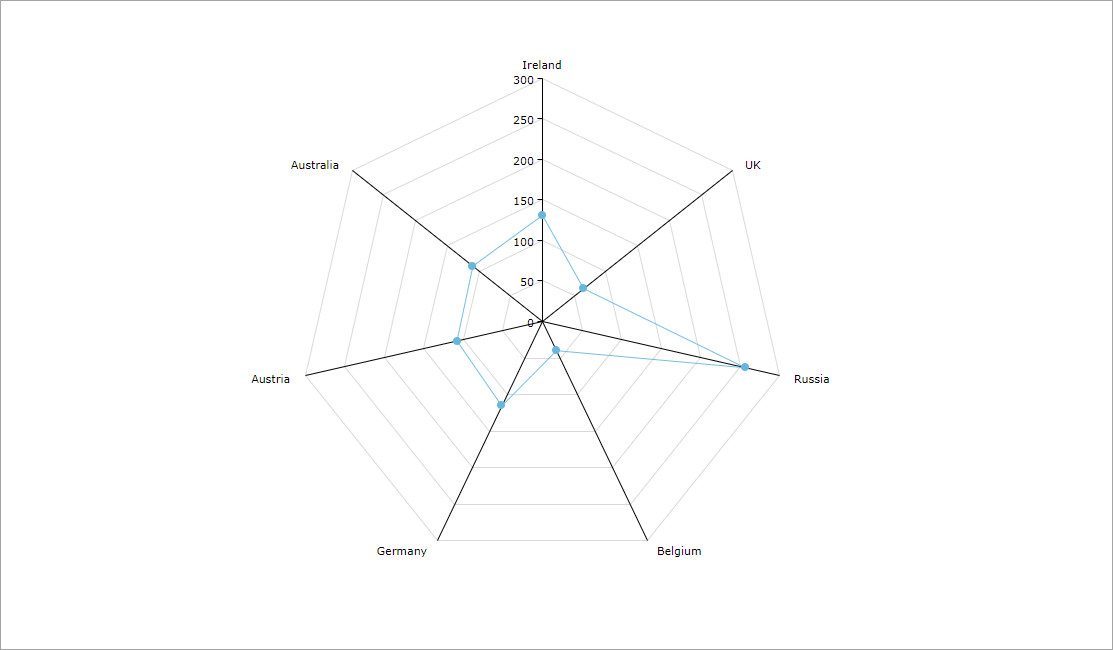
Data Binding
You can assign a CollectionContainer to the chart and then define the categoryField attribute for the radarChart element and valueField attribute for the nested graph element:
<chart:radarChart id="radarChart"
                  categoryField="country"
                  dataContainer="countryLitresDc"
                  height="100%"
                  startDuration="2"
                  theme="LIGHT"
                  width="100%">
    <chart:graphs>
        <chart:graph balloonText="[[value]] litres of beer per year"
                     bullet="ROUND"
                     valueField="litres"/>
    </chart:graphs>
</chart:radarChart>
Events and Handlers
|
To generate a handler stub in Jmix Studio, select the component in the screen descriptor XML or in the Component Hierarchy panel and use the Handlers tab of the Component Inspector panel. Alternatively, you can use the Generate Handler button in the top panel of the screen controller. |
For more details, see AmCharts documentation.
Was this page helpful?

Thank you for your feedback