Using ShowPivotAction
ShowPivotAction is a special action that enables exporting data from the components that extend ListComponent, such as Table, Tree, and DataGrid, to a pivot table.
The action should be created programmatically in the screen controller and used, for example, in a button:
@Autowired
private Actions actions;

@Autowired
private Button defaultShowPivotBtn;

@Autowired
private GroupTable<TipInfo> tipsTable;

@Subscribe
public void onInit(InitEvent event) {
    ShowPivotAction showPivotAction = actions.create(ShowPivotAction.class);
    showPivotAction.setTarget(tipsTable);
    defaultShowPivotBtn.setAction(showPivotAction);
}
ShowPivotAction has two modes for export: all rows and selected rows. If no rows are selected, all rows will be exported by default without confirmation.
The editable PivotTable component will be shown in a new tab. By default, all the attributes included in the component’s data container view will be displayed, except the following:
-
attributes of
Collectiontype; -
attributes of byte array type;
-
UUIDattributes; -
annotated with @SystemLevel.
If you want to exclude certain attributes or include only a part of them, use the PivotScreenBuilder Prototype Spring bean. It provides an API for configuring the PivotTable component in the opened screen.
@Autowired
private GroupTable<TipInfo> tipsTable;
@Subscribe("customShowPivotBtn")
public void onCustomShowPivotBtnClick(Button.ClickEvent event) {
PivotScreenBuilder builder = getApplicationContext()
.getBean(PivotScreenBuilder.class, tipsTable);
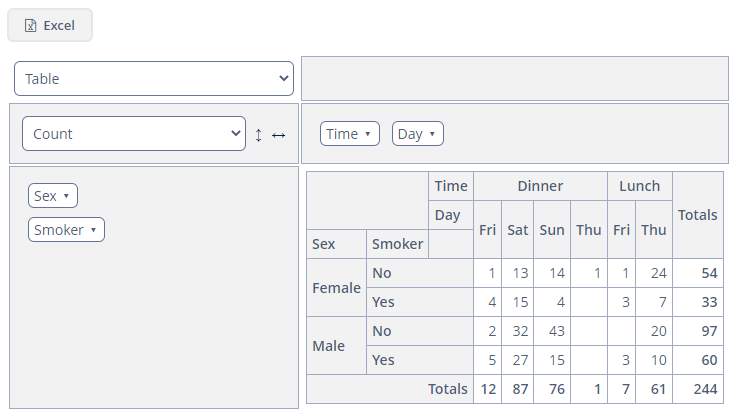
builder.withIncludedProperties(Arrays.asList("sex", "smoker", "time", "day")) (1)
.withNativeJson( (2)
"{"
+ " \"cols\": [\"Time\", \"Day\"],"
+ " \"rows\": [\"Sex\", \"Smoker\"],"
+ "\"renderers\": {"
+ " \"selectedRenderer\": \"table\","
+ " \"renderers\": [\"table\", \"tableBarchart\", \"heatmap\","
+ " \"rowHeatmap\", \"colHeatmap\"]"
+ " }"
+ "}")
.withItems((Collection) tipsTable.getItems().getItems())
.build()
.show();
}| 1 | The withIncludedProperties() method takes only included properties, the other properties will be ignored. To exclude properties, use the withExcludedProperties() method. |
| 2 | The withNativeJson() method is used to change the default configuration of the pivot table. Note that the localized property names should be used. |
Below is the JSON structure for a non-editable pivot table:
{
        "cols": ["localized property", "localized property"],
        "rows": ["localized property"],
        "editable": false,
        "renderer": "heatmap",
        "aggregation": {
                "id": "d8fc3fdf-730d-c94f-a0c8-72a9ce3dcb3a",
                "mode": "sumOverSum",
                "properties": ["localized property", "localized property"]
        }
}
And here’s the JSON structure for an editable pivot table:
{
        "cols": ["localized property"],
        "rows": ["localized property"],
        "editable": true,
        "renderers": {
                "selectedRenderer": "barChart"
        },
        "autoSortUnusedProperties": true,
        "aggregationProperties": ["localized property", "localized property"],
        "aggregations": {
                "selectedAggregation": "count",
                "aggregations": [{
                        "id": "647780f0-c6d0-6ade-a63a-542b5c8cdbd5",
                        "mode": "count",
                        "caption": "Count"
                }, {
                        "id": "c2663238-2654-67f0-2dec-add6962d867c",
                        "mode": "sumOverSum"
                }]
        }
}
You can export the displayed pivot data to Excel (if the current renderer is supported). The corresponding button will be displayed by default in the opened tab.