Sample Reports
Sample XLS Report
The example is based on the sample Library application, please follow the instruction to set up your project then create entities and screens.
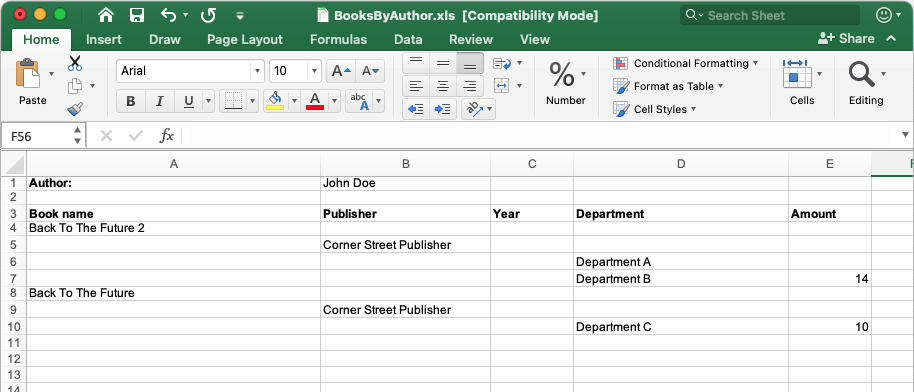
In this example, we will generate a report for a book author. Given an author, the report will list his books, the publisher of each book, in which library department the book was stored, and how many books were stored in each department. The result looks like this:
-
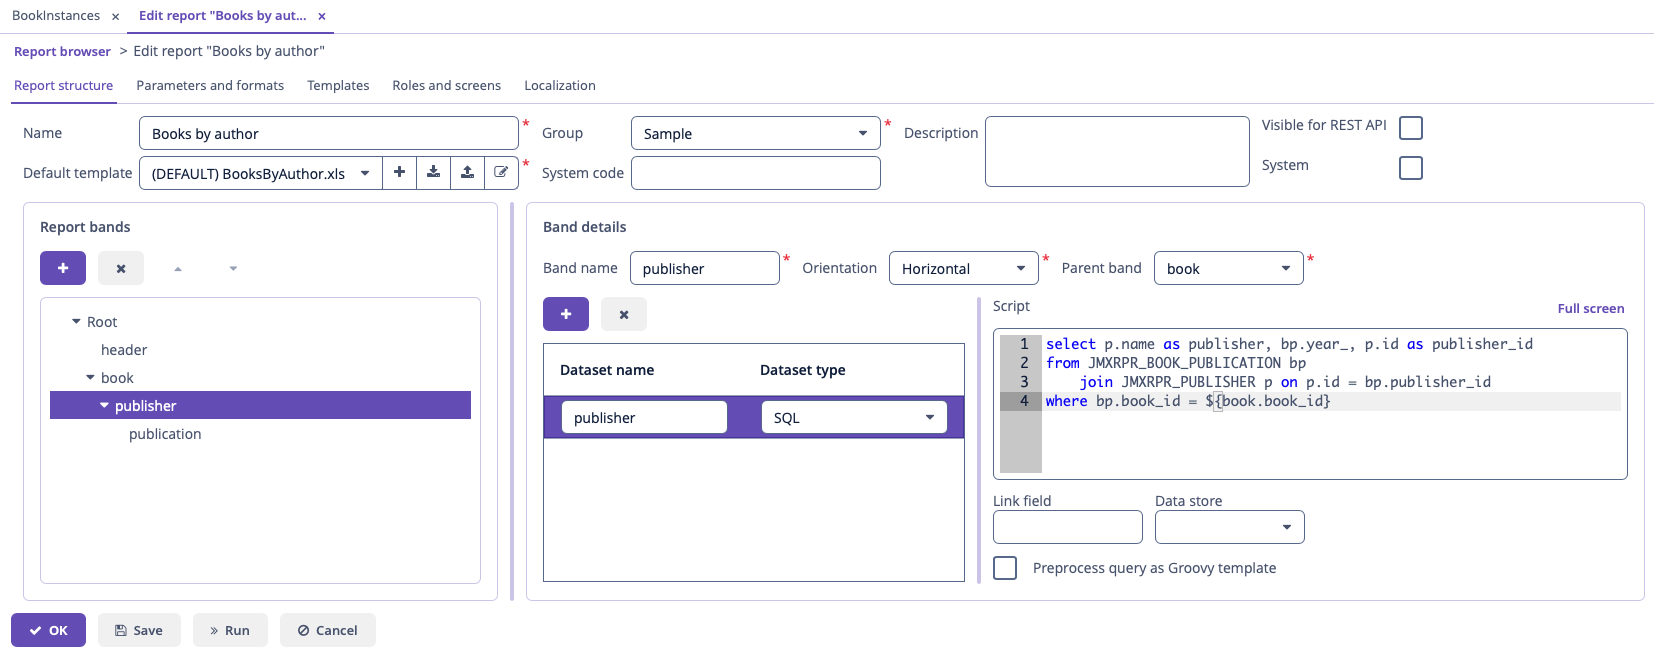 Figure 2. Report data structure
Let us consider report bands.
-
header band – report header. It contains the dataset with the Groovy script which outputs the report external parameters values:
[['authorName' : (params['author'].firstName + ' ' + params['author'].lastName)]] -
The book band outputs the list of books by running the following SQL query:
select b.name as book_name, b.id as book_id
from JMXRPR_BOOK b
    join JMXRPR_AUTHORS_BOOKS ba on ba.book_id = b.id
    join JMXRPR_AUTHOR a on a.id = ba.author_id
where a.id = ${author}
This query uses the external report parameter –
author. The parameter has the Entity type, however, in SQL queries you can compare it directly with entity identifier fields; the conversion will be done automatically. -
The publisher band, which is a child band of the book, outputs the book publishers by running the following SQL query:
select p.name as publisher, bp.year_, p.id as publisher_id
from JMXRPR_BOOK_PUBLICATION bp
    join JMXRPR_PUBLISHER p on p.id = bp.publisher_id
where bp.book_id = ${book.book_id}
This query uses the parent band field
book_idas a parameter. This provides dependency between the parent and child bands. -
The publication band, which is a child of the publisher band, outputs the book publications by running the following SQL query:
select ld.name as department, sum(bi.book_count) as amount
from JMXRPR_BOOK_INSTANCE bi
    join JMXRPR_BOOK_PUBLICATION bp on bp.id = bi.book_publication_id
    join JMXRPR_LIBRARY_DEPARTMENT ld on ld.id = bi.library_department_id
where bp.publisher_id = ${publisher.publisher_id} and bp.book_id = ${book.book_id}
group by ld.name
This query uses both parent bands fields as parameters –
book_idandpublisher_id.
-
-
Report parameters.
The Parameters and Formats tab contains one declared report external parameter –
Author: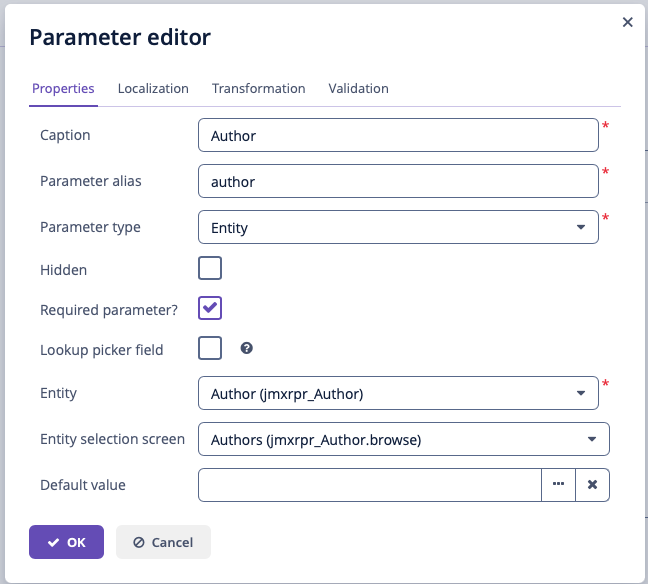 Figure 3. Report parameters
When running the report, the user will have to enter this parameter. The author selection will be performed via the
Author.browsescreen, available in the application. -
Report templates.
The Templates tab contains a single defined XLS template, loaded from BooksByAuthor.xls
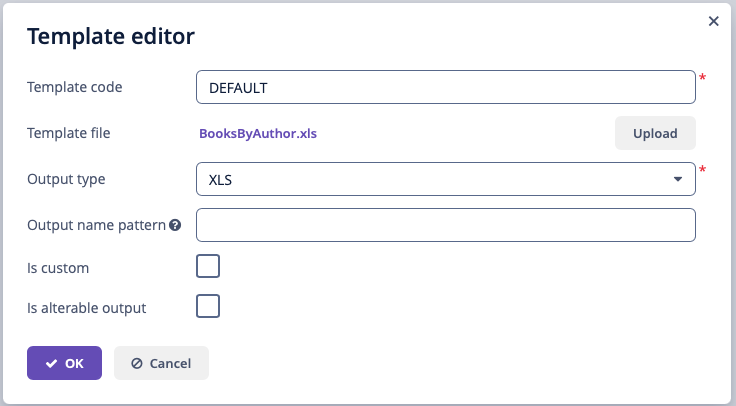 Figure 4. Report templates
 -
Report Name Localization.
The Localization tab contains the report name for the Russian locale:
ru = Книги по автору
You can run the report from the generic browser in the Reports → Run Reports screen.
Sample Crosstab Report
The example is based on the sample Library application, please follow the instruction to set up your project then create entities and screens.
In this example, we will create a crosstab report for the library departments, to list how many books each department purchased every month. The report is extended both vertically and horizontally and aggregates the book amounts for each department and each month:
To create the report, add a band and select Crosstab band orientation on the Report structure tab of the report editor. This orientation automatically adds three datasets to the band:
-
<band_name>_dynamic_header – the data from this dataset is copied to the right like a vertical band with table columns header. -
<band_name>_master_data – the data from this dataset is copied downwards like a horizontal band with table rows header. -
<band_name>– the dataset named the same as the band, it belongs to. It is the main content band that will fulfill the matrix cells.
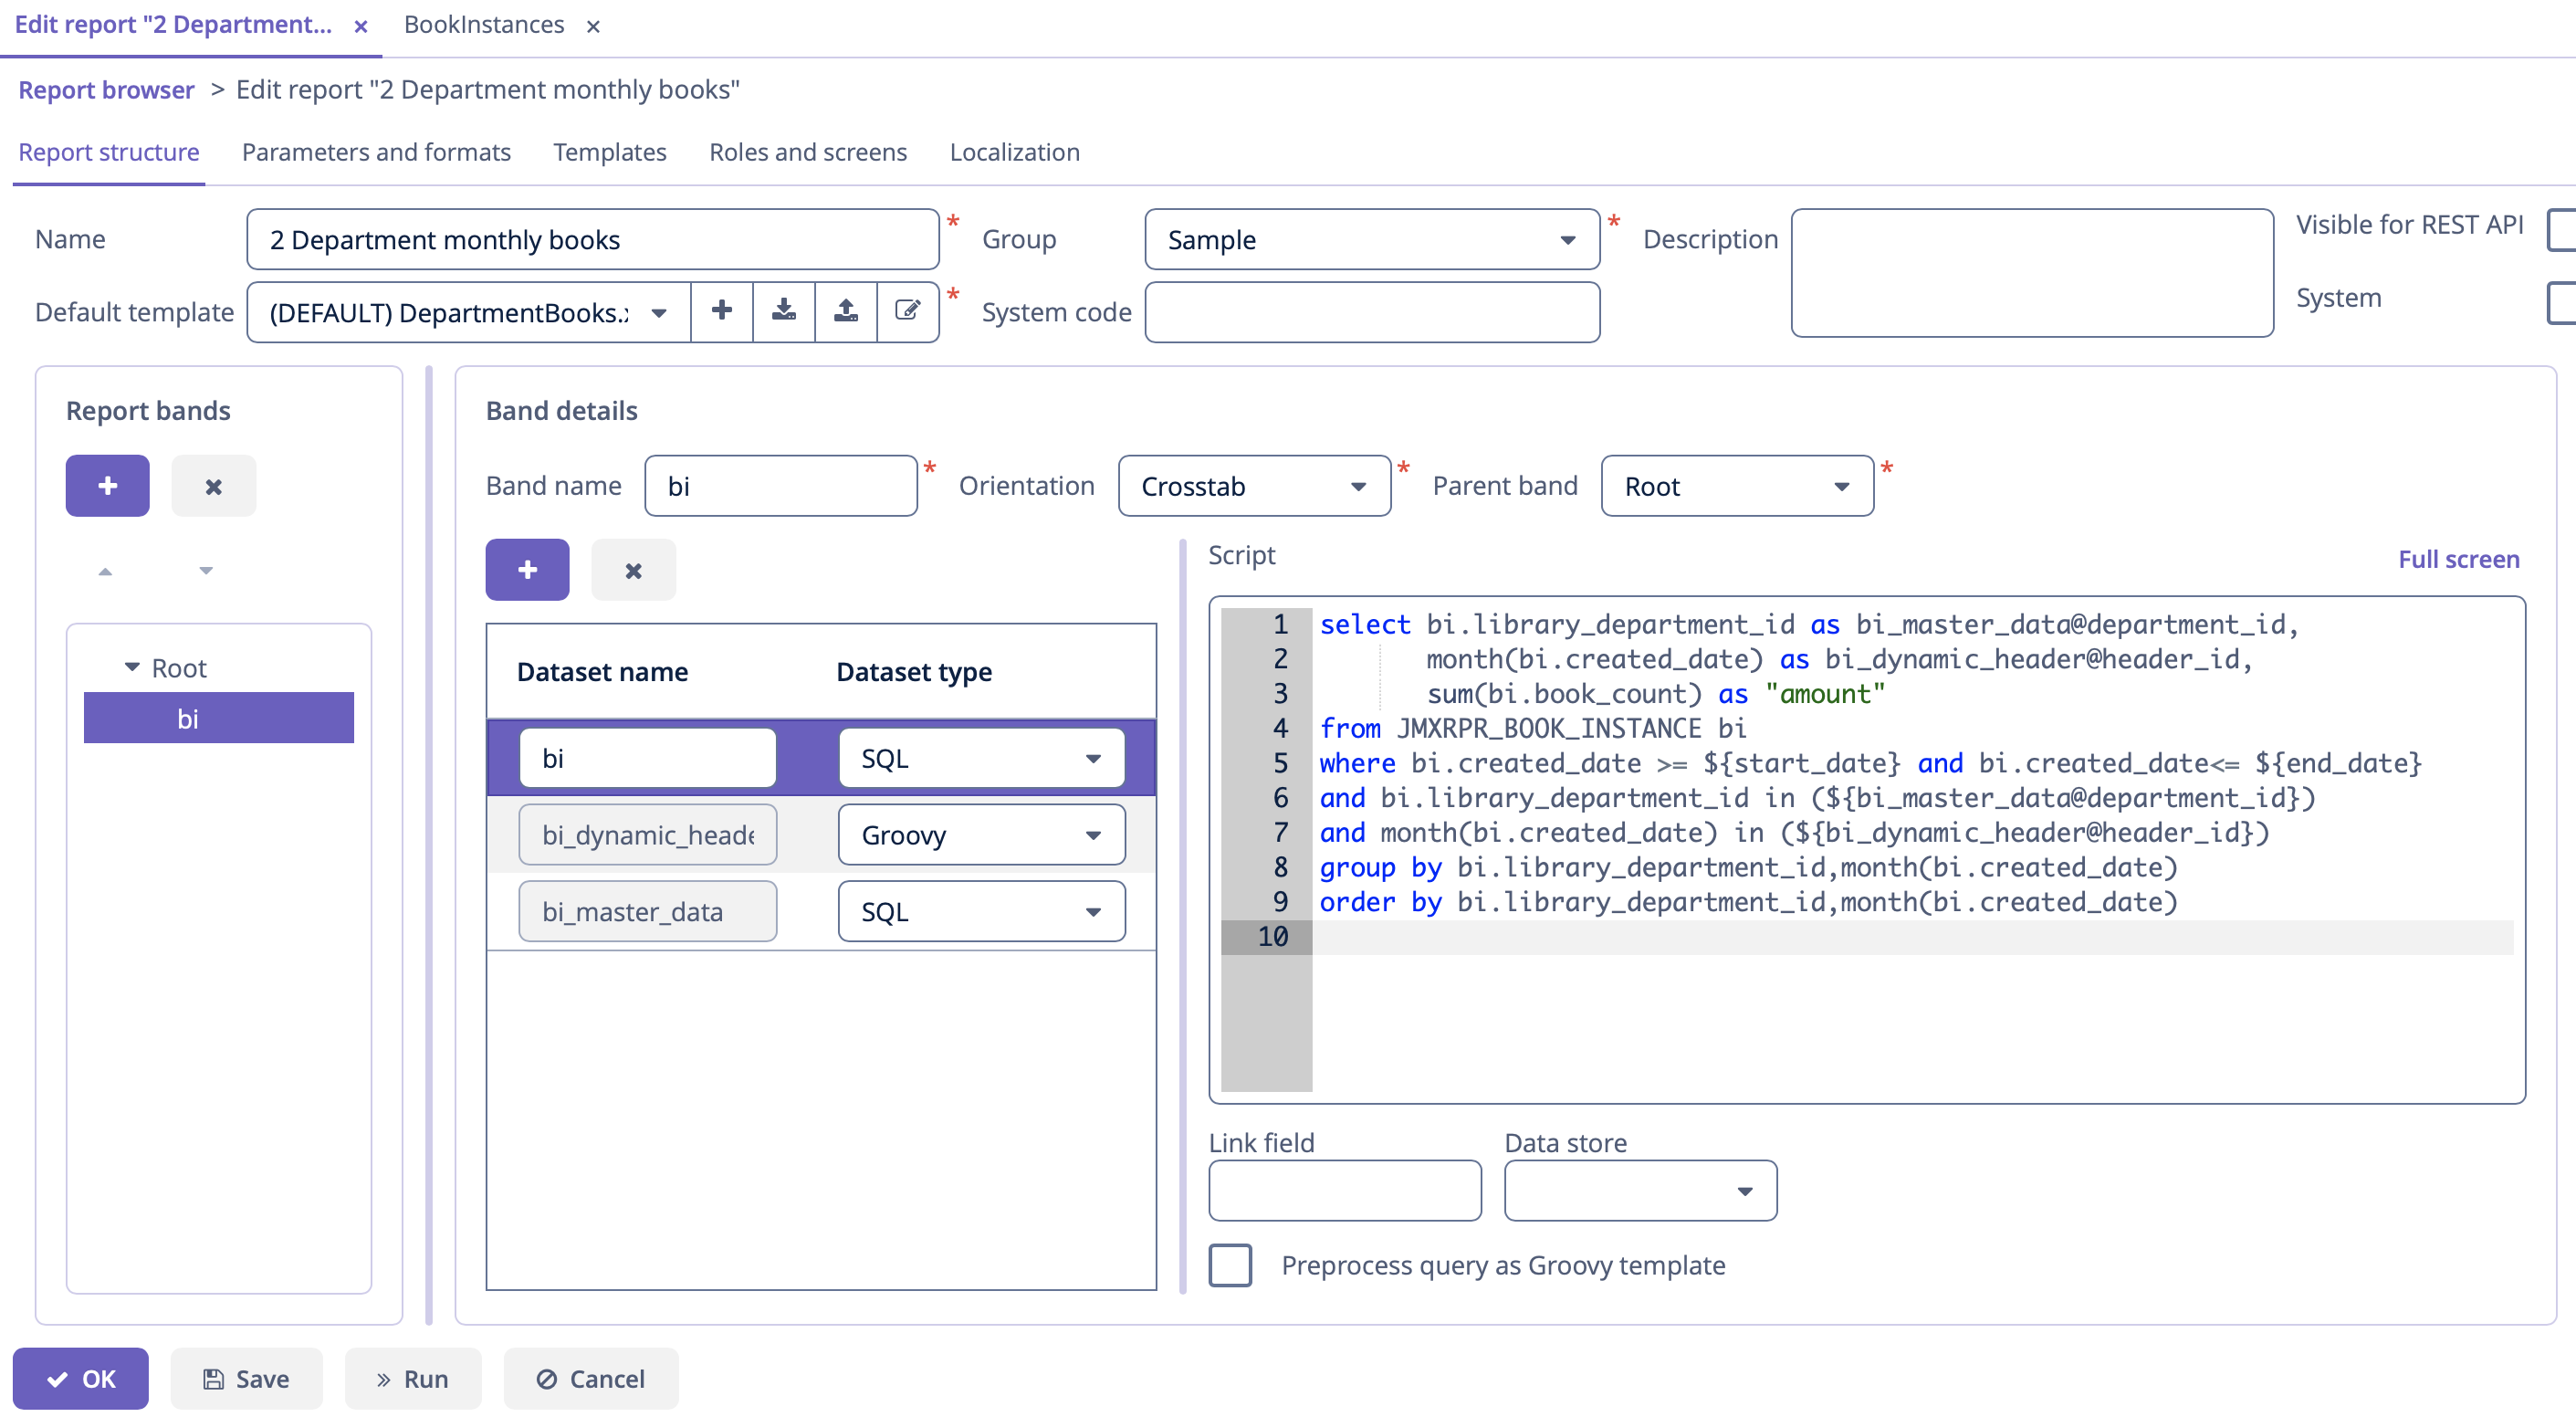
For example, a crosstab report for the BookInstance entity of the Library sample application has the following structure:
-
Report data structure. There are three datasets:
-
The
bi_dynamic_headerdataset will return the list of months names:bi_dynamic_header datasetimport java.text.DateFormatSymbols List result = new ArrayList() DateFormatSymbols dateFormatSymbols = DateFormatSymbols.getInstance(Locale.ENGLISH) for (i in 0..dateFormatSymbols.months.length - 1) { result.add(["header_id" : i + 1, "month_name" : dateFormatSymbols.months[i]]) } return result -
The
bi_master_datadataset returns names and identifiers of the library departments selected by the user as an external report parameter:bi_master_data datasetselect name as name, id as department_id from JMXRPR_LIBRARY_DEPARTMENT where id in (${selected_departments}) -
The
bidataset will provide data for the matrix cells, which is the book amounts sum for the particular month and department. It takesbi_master_data@department_id(the department id) as the vertical coordinate of the cell, andbi_dynamic_header@header_id(the month name) as the horizontal coordinate, and fills the matrix cell with theamountvalue.In the example below the report has two more external parameters: the
start_dateand theend_datethat define the range of book instance creation dates. It would be a good idea to set up cross-parameter validation to make sure the range makes sense.bi datasetselect bi.library_department_id as bi_master_data@department_id, month(bi.created_date) as bi_dynamic_header@header_id, sum(bi.book_count) as "amount" from JMXRPR_BOOK_INSTANCE bi where bi.created_date >= ${start_date} and bi.created_date<= ${end_date} and bi.library_department_id in (${bi_master_data@department_id}) and month(bi.created_date) in (${bi_dynamic_header@header_id}) group by bi.library_department_id,month(bi.created_date) order by bi.library_department_id,month(bi.created_date)
-
-
Report parameters.
The Parameters and Formats tab contains three declared report external parameters –
selected_departments,start_date,end_date: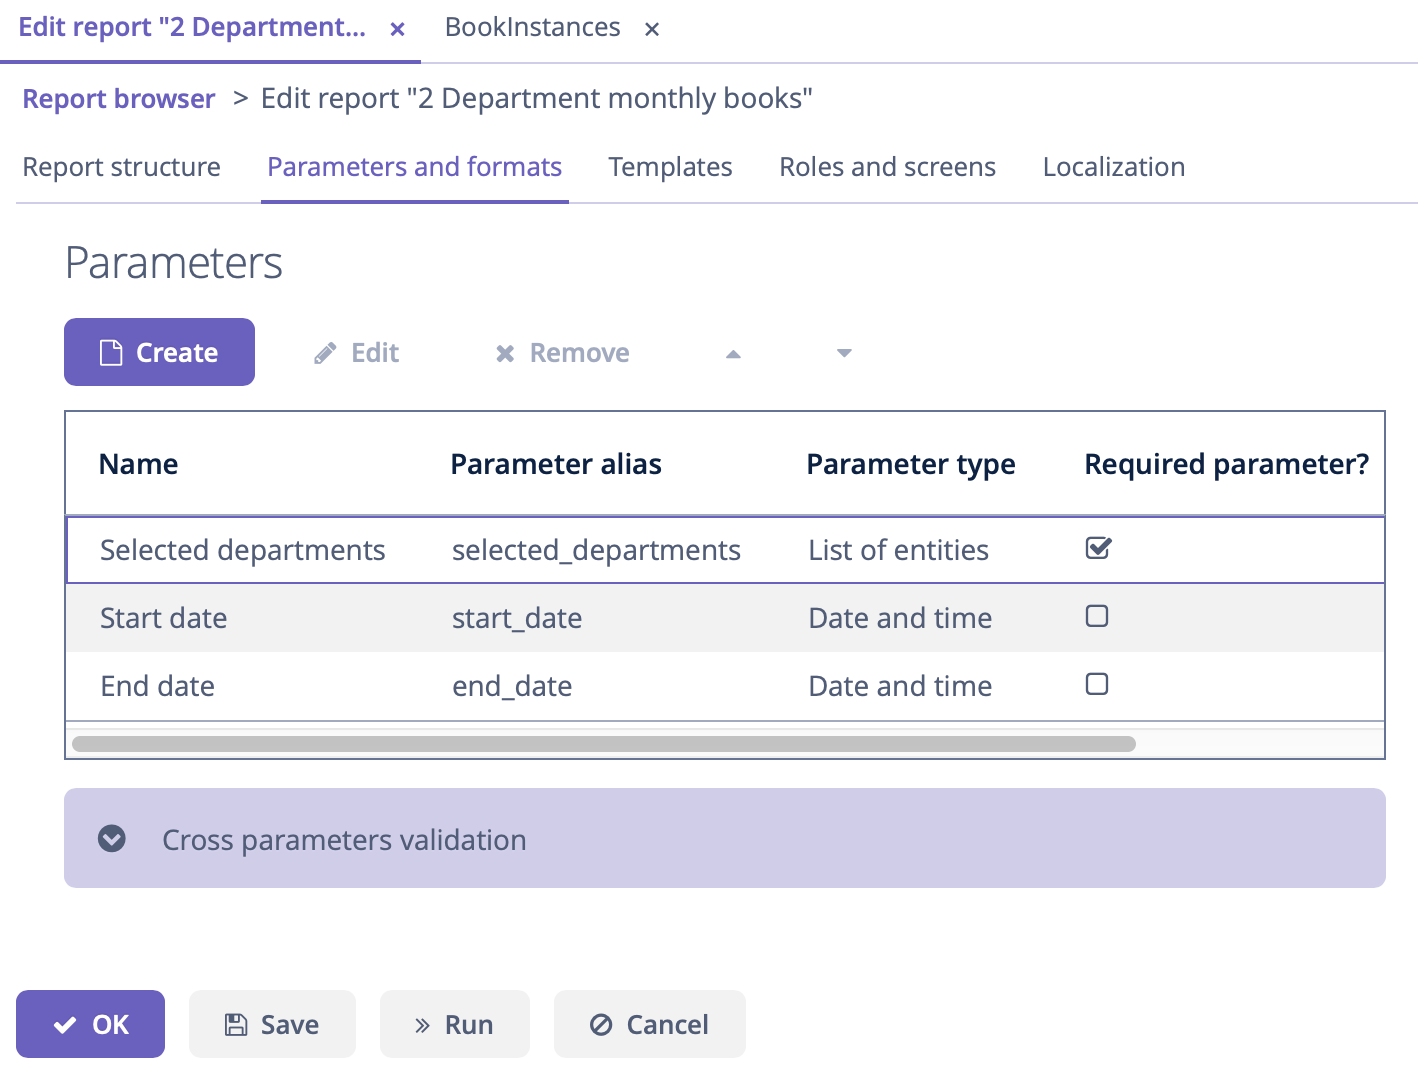 Figure 7. Report parameters
When running the report, the user will have to enter these parameters. The department selection will be performed via the
jmxrpr_LibraryDepartment.browsescreen, available in the application. -
Report template.
Then you can create a XLS report template using Microsoft Office or LibreOffice.
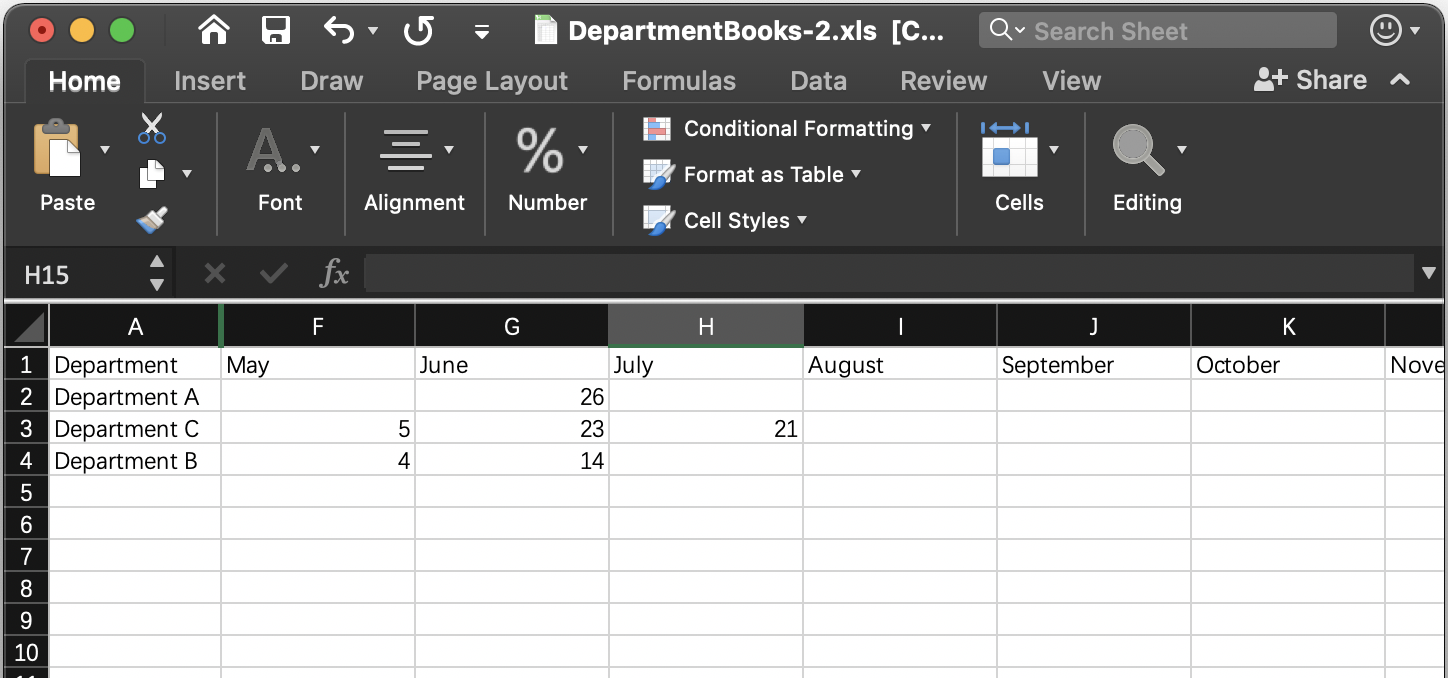
The DepartmentBooks.xls is an example of a template which outputs the list of
Departmentsvertically andBooksfor each department horizontally grouped by the months the books were created.This report template contains named regions for all three datasets of the crosstab band and, additionally, the named region for the column header:
<band_name>_header. In our case it isbi_header.
You can run the report from the generic browser in the Reports → Run Reports screen.
Sample JasperReports Report
The example is based on the sample Library application, please follow the instruction to set up your project then create entities and screens.
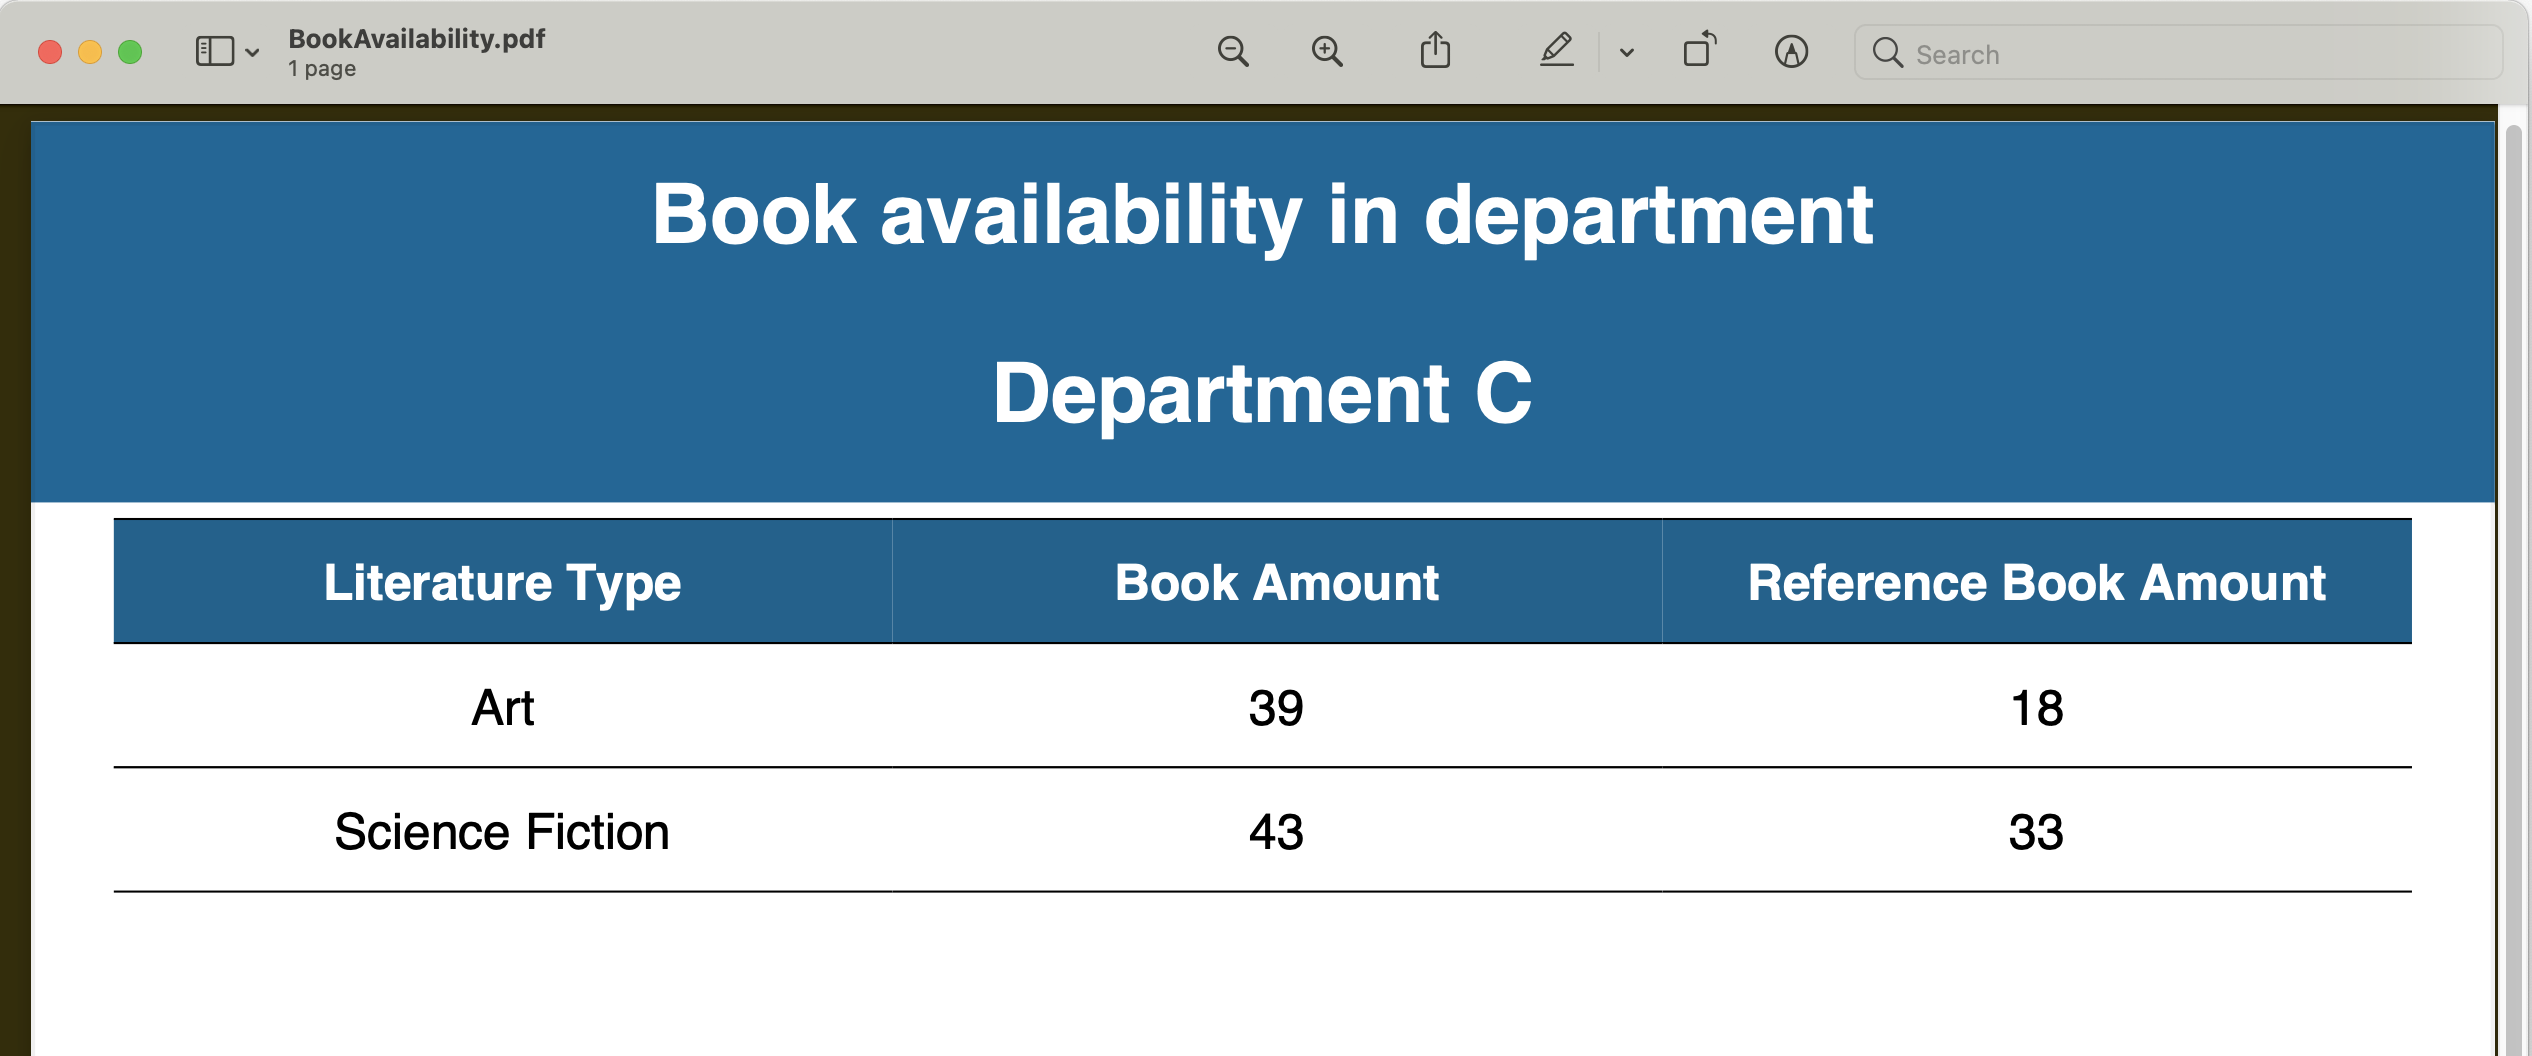
In this example, we will create a JRXML report to display the list of book publications in the selected department:
-
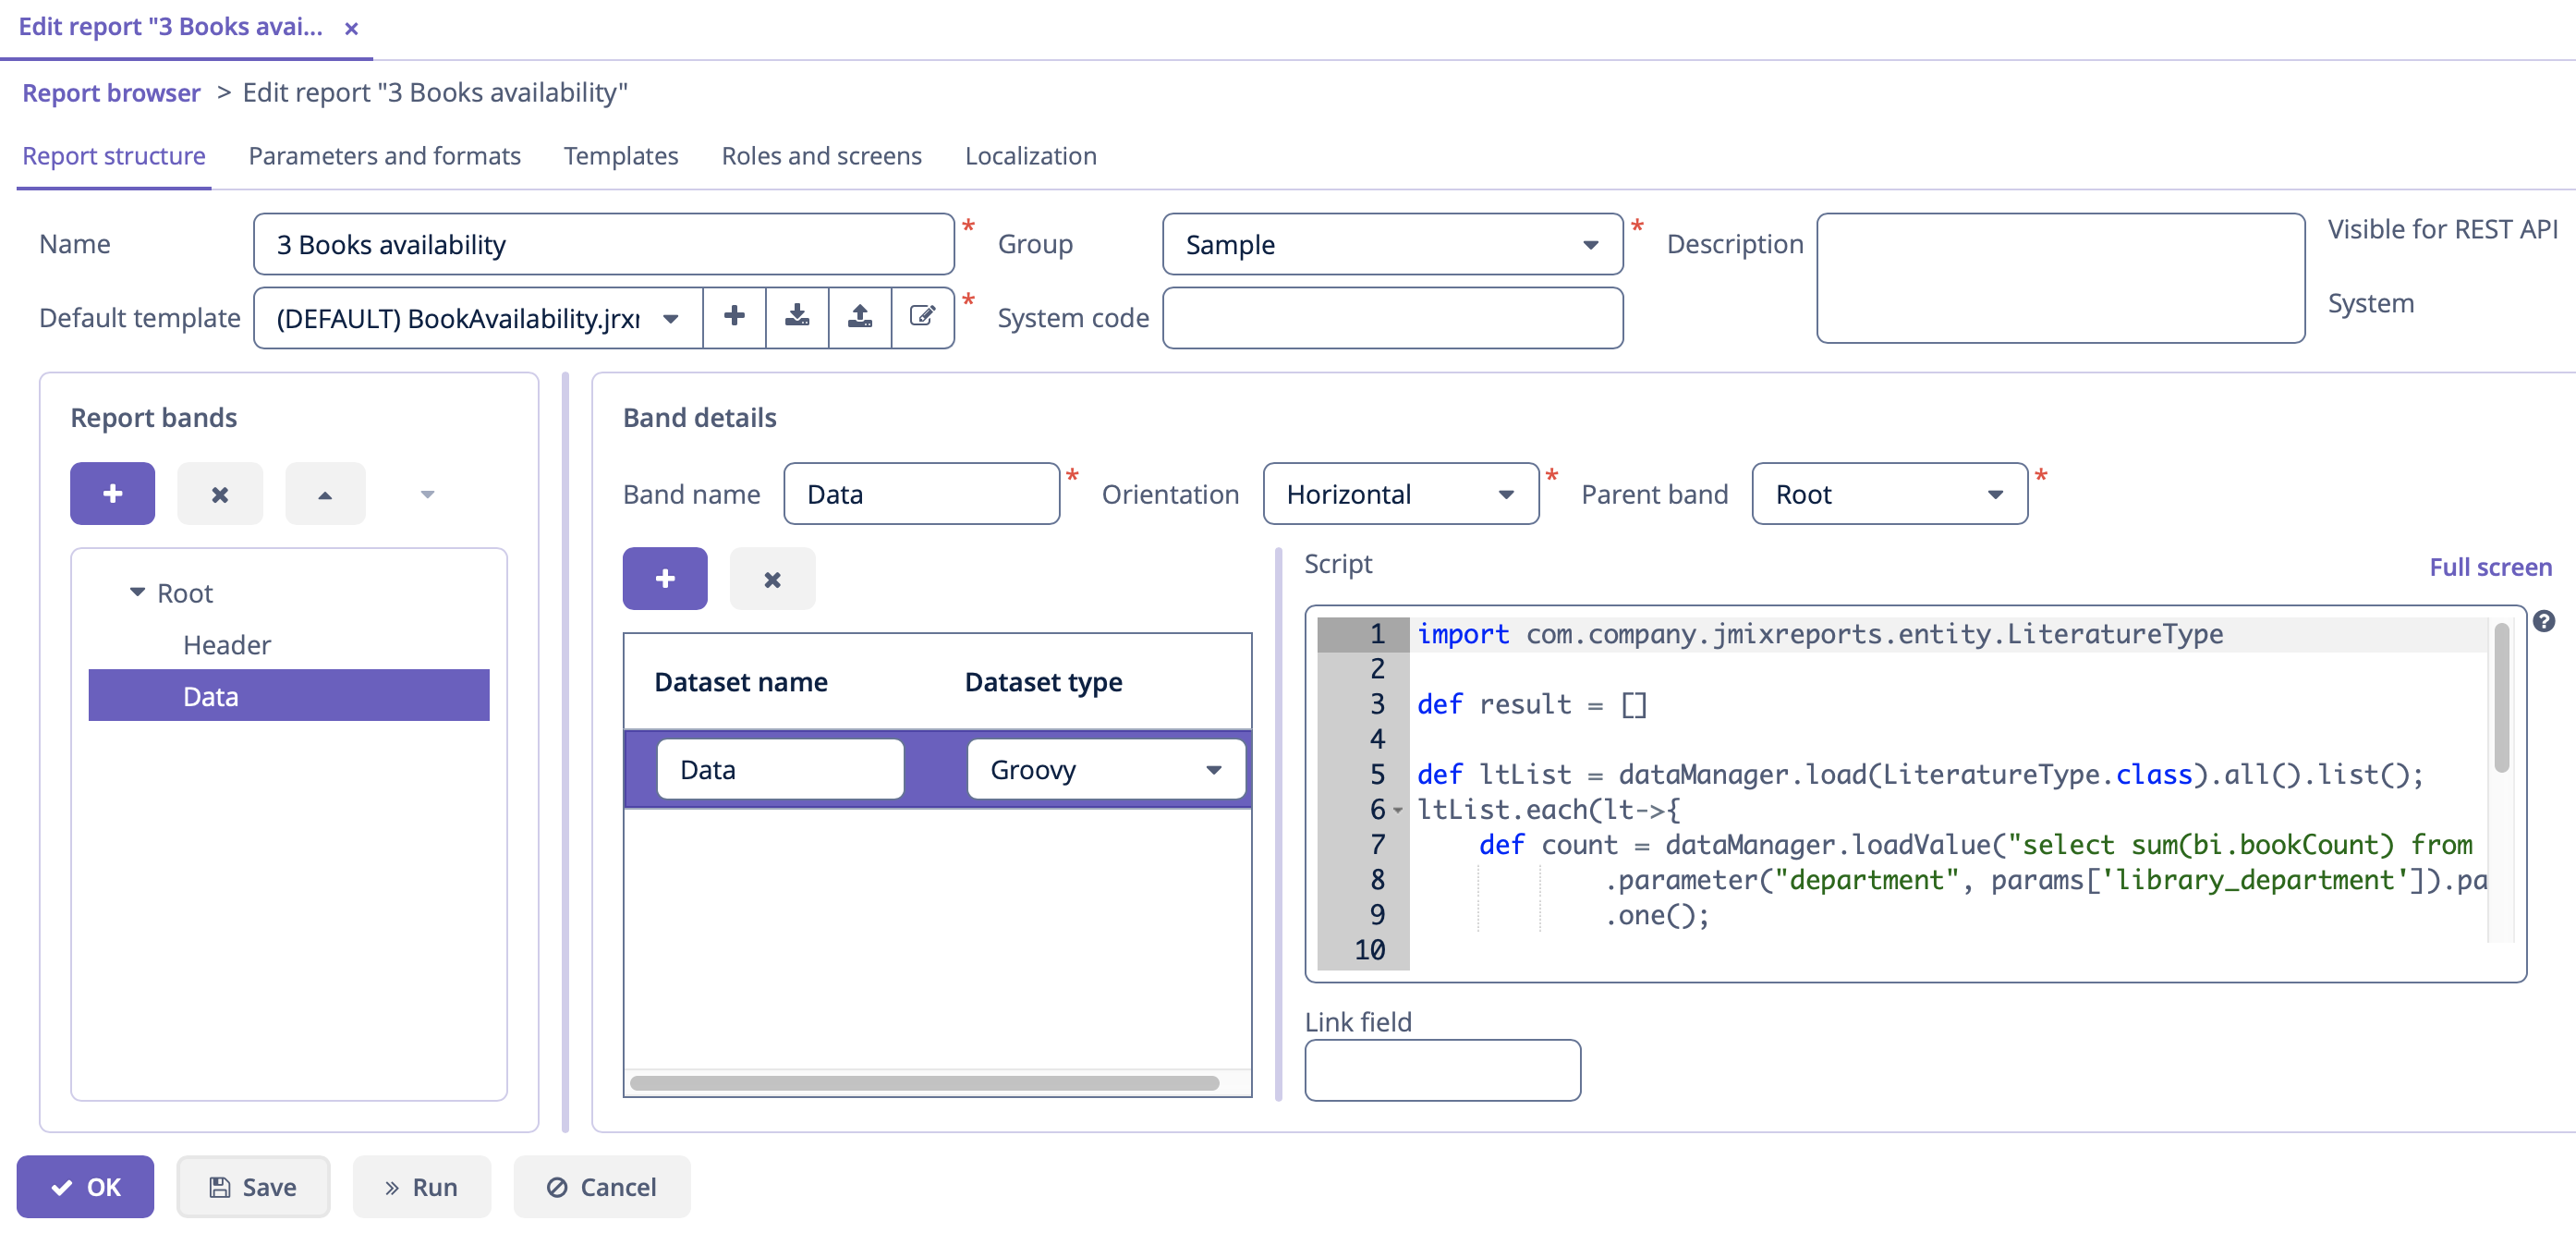 Figure 9. Report data structure
Let’s consider report bands.
-
Header band – report header. It contains the dataset with the Groovy script which outputs the report external parameters value:
[['library_department_name' : params['library_department'].name]] -
Data band outputs the list of book instances in the department passed as a parameter by running the following Groovy script:
import com.company.jmixreports.entity.LiteratureType

def result = []

def ltList = dataManager.load(LiteratureType).all().list();
ltList.each(lt->{
    def count = dataManager.loadValue("select sum(bi.bookCount) from jmxrpr_BookInstance bi where bi.libraryDepartment = :department and bi.bookPublication.book.literatureType = :lt ", Long)
            .parameter("department", params['library_department']).parameter("lt", lt)
            .one();

    def refCount = dataManager.loadValue("select sum(bi.bookCount) from jmxrpr_BookInstance bi where bi.libraryDepartment = :department and bi.bookPublication.book.literatureType = :lt and bi.isReference = true", Long)
            .parameter("department", params['library_department']).parameter("lt", lt)
            .one();

    result.add(['literature_type_name': lt.name,
            'books_instances_amount': count,
            'reference_books_instances_amount': refCount])
});
return result;
This query uses the external report parameter –
library_department. The parameter has the Entity type, however you can compare it directly with entity identifier fields; the conversion will be done automatically.
-
-
Report parameters.
The Parameters and Formats tab contains one declared report external parameter –
Department: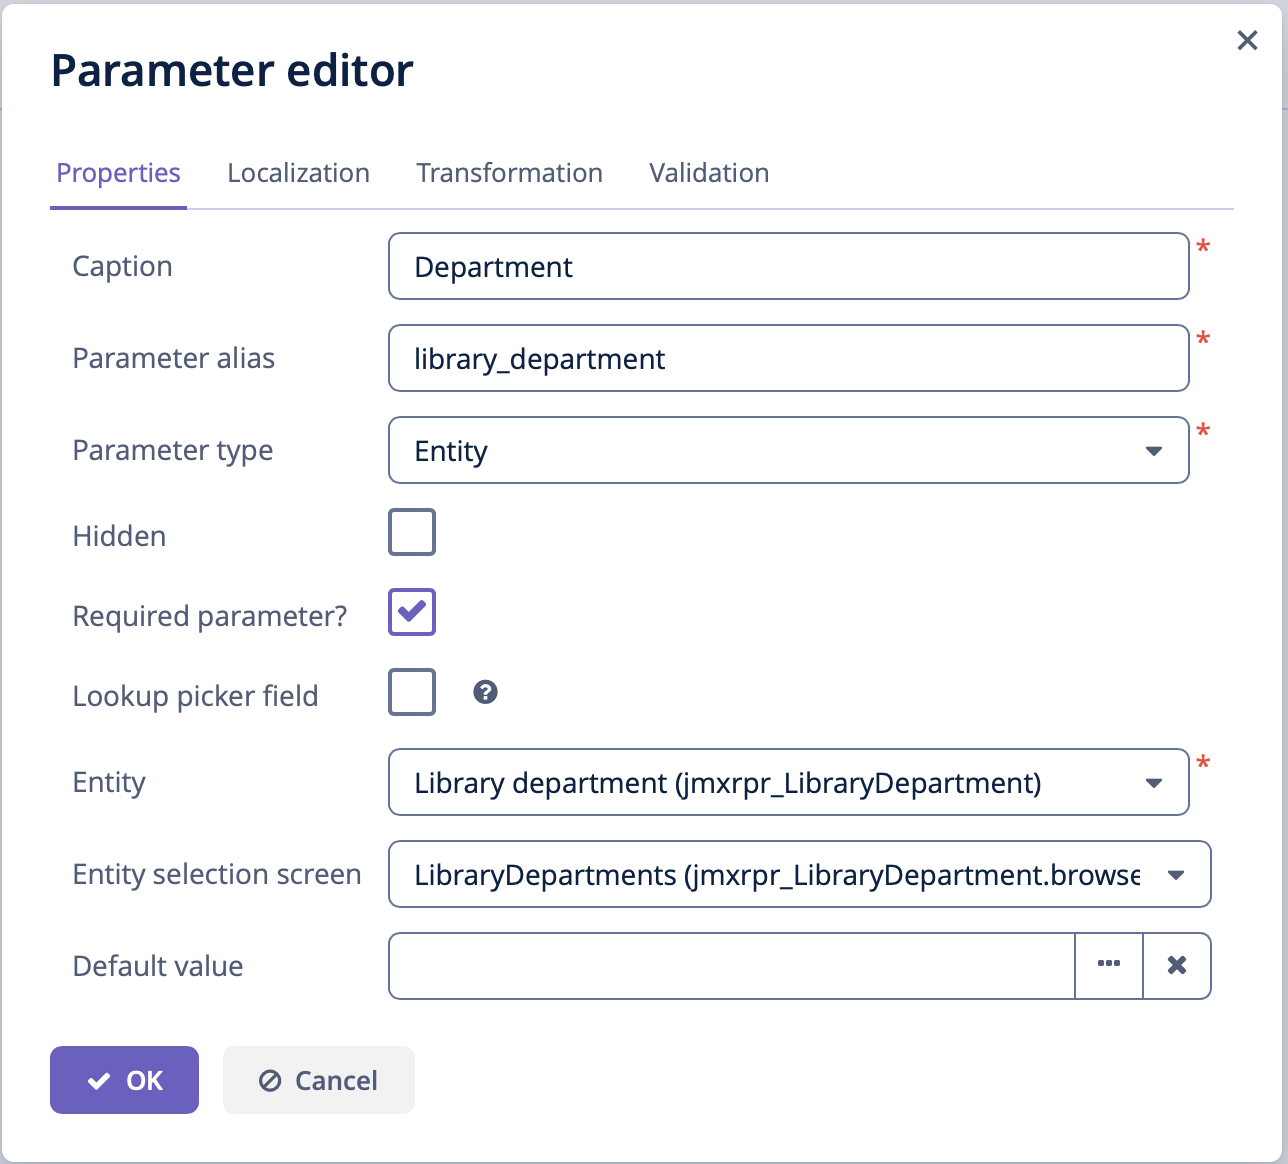 Figure 10. Report parameters
When running the report, the user will have to enter this parameter. The department selection will be performed via the
jmxrpr_LibraryDepartment.browsescreen, available in the application. -
Report template.
Create the new JRXML file or download BookAvailability.jrxml with the following content:
BookAvailability.jrxml<?xml version="1.0" encoding="UTF-8"?> <!-- Created with Jaspersoft Studio version 6.4.0.final using JasperReports Library version 6.4.1 --> <jasperReport xmlns="http://jasperreports.sourceforge.net/jasperreports" xmlns:xsi="http://www.w3.org/2001/XMLSchema-instance" xsi:schemaLocation="http://jasperreports.sourceforge.net/jasperreports http://jasperreports.sourceforge.net/xsd/jasperreport.xsd" name="books" pageWidth="595" pageHeight="842" whenNoDataType="AllSectionsNoDetail" columnWidth="535" leftMargin="20" rightMargin="20" topMargin="20" bottomMargin="20"> <property name="template.engine" value="tabular_template"/> <property name="com.jaspersoft.studio.data.defaultdataadapter" value="One Empty Record"/> <style name="Table_TH" mode="Opaque" backcolor="#066990"> <box> <topPen lineWidth="0.5" lineColor="#000000"/> <bottomPen lineWidth="0.5" lineColor="#000000"/> </box> </style> <style name="Table_CH" mode="Opaque" forecolor="#FFFFFF" backcolor="#06618F" hTextAlign="Center" fontSize="12"> <box> <topPen lineWidth="0.5" lineColor="#000000"/> <bottomPen lineWidth="0.5" lineColor="#000000"/> </box> </style> <style name="Table_TD" mode="Opaque" backcolor="#FFFFFF" hTextAlign="Center"> <box> <topPen lineWidth="0.5" lineColor="#000000"/> <bottomPen lineWidth="0.5" lineColor="#000000"/> </box> </style> <subDataset name="Data"> <field name="literature_type_name" class="java.lang.String"/> <field name="books_instances_amount" class="java.lang.Long"/> <field name="reference_books_instances_amount" class="java.lang.Long"/> </subDataset> <field name="library_department_name" class="java.lang.String"/> <title> <band height="72"> <frame> <reportElement mode="Opaque" x="-20" y="-20" width="595" height="92" backcolor="#006699"/> <staticText> <reportElement x="20" y="10" width="555" height="30" forecolor="#FFFFFF"/> <textElement textAlignment="Center"> <font size="20" isBold="true"/> </textElement> <text><![CDATA[Book availability in department]]></text> </staticText> <textField> <reportElement x="20" y="50" width="555" height="30" forecolor="#FFFFFF"/> <box> <pen lineWidth="1.0" lineColor="#FFFFFF"/> <topPen lineWidth="0.0" lineStyle="Solid" lineColor="#000000"/> <leftPen lineWidth="0.0" lineStyle="Solid" lineColor="#000000"/> <bottomPen lineWidth="0.0" lineStyle="Solid" lineColor="#000000"/> <rightPen lineWidth="0.0" lineStyle="Solid" lineColor="#000000"/> </box> <textElement textAlignment="Center" verticalAlignment="Middle"> <font fontName="SansSerif" size="20" isBold="true"/> </textElement> <textFieldExpression><![CDATA[$F{library_department_name}]]></textFieldExpression> </textField> </frame> </band> </title> <detail> <band height="204"> <componentElement> <reportElement x="0" y="4" width="555" height="200" forecolor="#FFFFFF"> <property name="com.jaspersoft.studio.layout" value="com.jaspersoft.studio.editor.layout.VerticalRowLayout"/> <property name="com.jaspersoft.studio.table.style.table_header" value="Table_TH"/> <property name="com.jaspersoft.studio.table.style.column_header" value="Table_CH"/> <property name="com.jaspersoft.studio.table.style.detail" value="Table_TD"/> <property name="net.sf.jasperreports.export.headertoolbar.table.name" value=""/> <property name="com.jaspersoft.studio.components.autoresize.proportional" value="true"/> </reportElement> <jr:table xmlns:jr="http://jasperreports.sourceforge.net/jasperreports/components" xsi:schemaLocation="http://jasperreports.sourceforge.net/jasperreports/components http://jasperreports.sourceforge.net/xsd/components.xsd"> <datasetRun subDataset="Data"> <dataSourceExpression><![CDATA[$P{REPORTING}.dataset("Data")]]></dataSourceExpression> </datasetRun> <jr:column width="188"> <jr:columnHeader style="Table_CH" height="30"> <staticText> <reportElement x="0" y="0" width="188" height="30" forecolor="#FFFFFF"/> <box> <pen lineColor="#FFFFFF"/> </box> <textElement textAlignment="Center" verticalAlignment="Middle"> <font fontName="SansSerif" size="12" isBold="true"/> </textElement> <text><![CDATA[Literature Type]]></text> </staticText> </jr:columnHeader> <jr:detailCell style="Table_TD" height="30"> <textField> <reportElement x="0" y="0" width="188" height="30"/> <textElement textAlignment="Center" verticalAlignment="Middle"> <font fontName="SansSerif" size="12"/> </textElement> <textFieldExpression><![CDATA[$F{literature_type_name}]]></textFieldExpression> </textField> </jr:detailCell> </jr:column> <jr:column width="186"> <jr:columnHeader style="Table_CH" height="30"> <staticText> <reportElement x="0" y="0" width="186" height="30" forecolor="#FFFFFF"/> <textElement textAlignment="Center" verticalAlignment="Middle"> <font fontName="SansSerif" size="12" isBold="true"/> </textElement> <text><![CDATA[Book Amount]]></text> </staticText> </jr:columnHeader> <jr:detailCell style="Table_TD" height="30"> <textField> <reportElement x="0" y="0" width="186" height="30"/> <textElement textAlignment="Center" verticalAlignment="Middle"> <font size="12"/> </textElement> <textFieldExpression><![CDATA[$F{books_instances_amount}]]></textFieldExpression> </textField> </jr:detailCell> </jr:column> <jr:column width="181"> <jr:columnHeader style="Table_CH" height="30"> <staticText> <reportElement x="0" y="0" width="181" height="30" forecolor="#FFFFFF"/> <textElement textAlignment="Center" verticalAlignment="Middle"> <font fontName="SansSerif" size="12" isBold="true"/> </textElement> <text><![CDATA[Reference Book Amount]]></text> </staticText> </jr:columnHeader> <jr:detailCell style="Table_TD" height="30"> <textField isBlankWhenNull="false"> <reportElement x="0" y="0" width="181" height="30" forecolor="#000000"/> <textElement textAlignment="Center" verticalAlignment="Middle"> <font size="12"/> </textElement> <textFieldExpression><![CDATA[$F{reference_books_instances_amount}]]></textFieldExpression> </textField> </jr:detailCell> </jr:column> </jr:table> </componentElement> </band> </detail> <pageFooter> <band height="17"> <textField> <reportElement mode="Opaque" x="0" y="4" width="515" height="13" backcolor="#E6E6E6"/> <textElement textAlignment="Right"/> <textFieldExpression><![CDATA["Page "+$V{PAGE_NUMBER}+" of"]]></textFieldExpression> </textField> <textField evaluationTime="Report"> <reportElement mode="Opaque" x="515" y="4" width="40" height="13" backcolor="#E6E6E6"/> <textFieldExpression><![CDATA[" " + $V{PAGE_NUMBER}]]></textFieldExpression> </textField> <textField pattern="M/d/yy"> <reportElement x="0" y="4" width="280" height="13"/> <textFieldExpression><![CDATA[new java.util.Date()]]></textFieldExpression> </textField> </band> </pageFooter> </jasperReport>The table in this template is bound to a subDataset. The
titleelement uses the Header band data directly. You can open the template file in JasperReports visual designer to see the report layout.Upload the new template to the application, selecting any output type, and make it default:
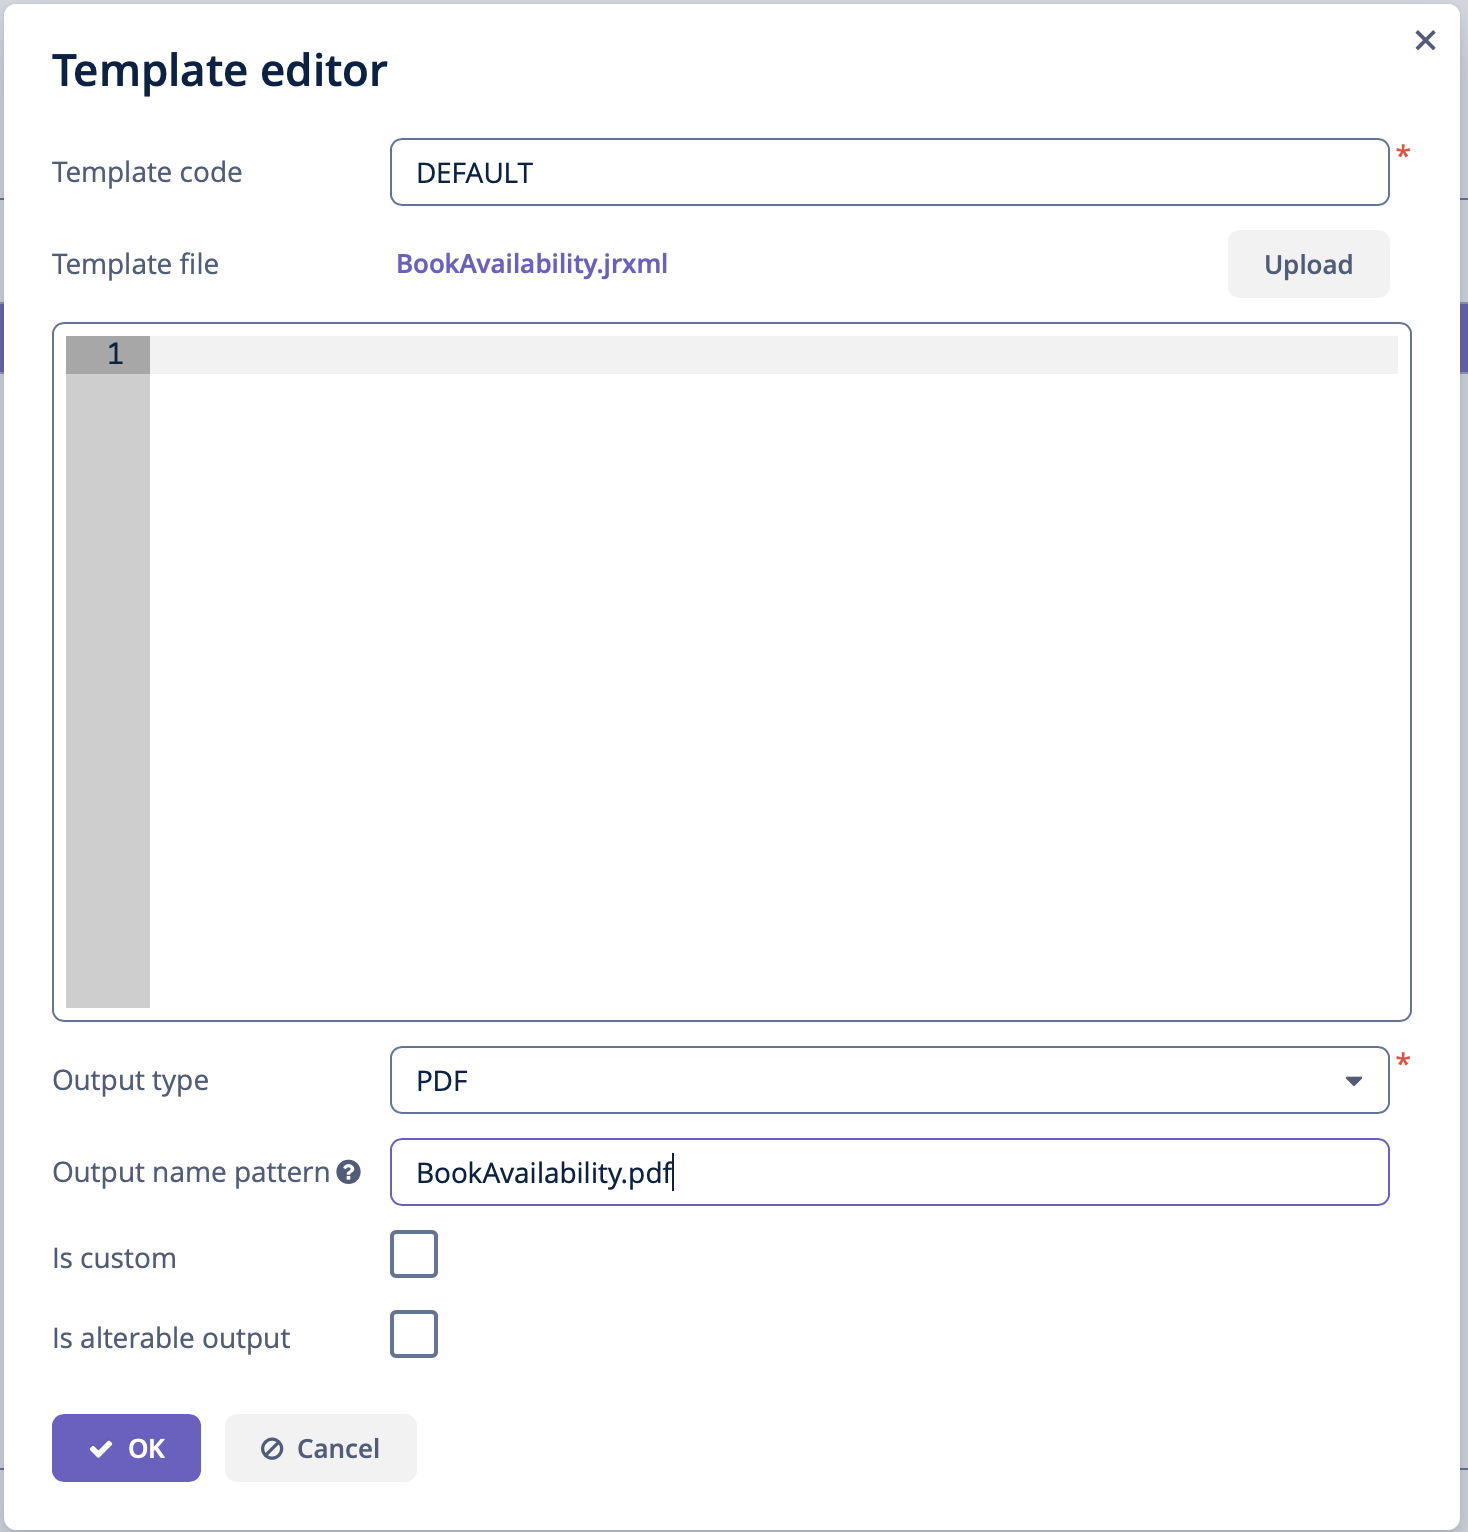 Figure 11. Report templates
You can run the report from the generic browser in the Reports → Run Reports screen.
Sample HTML/PDF Report with Paging, Headers and Footers
The example is based on the sample Library application, please follow the instruction to set up your project then create entities and screens.
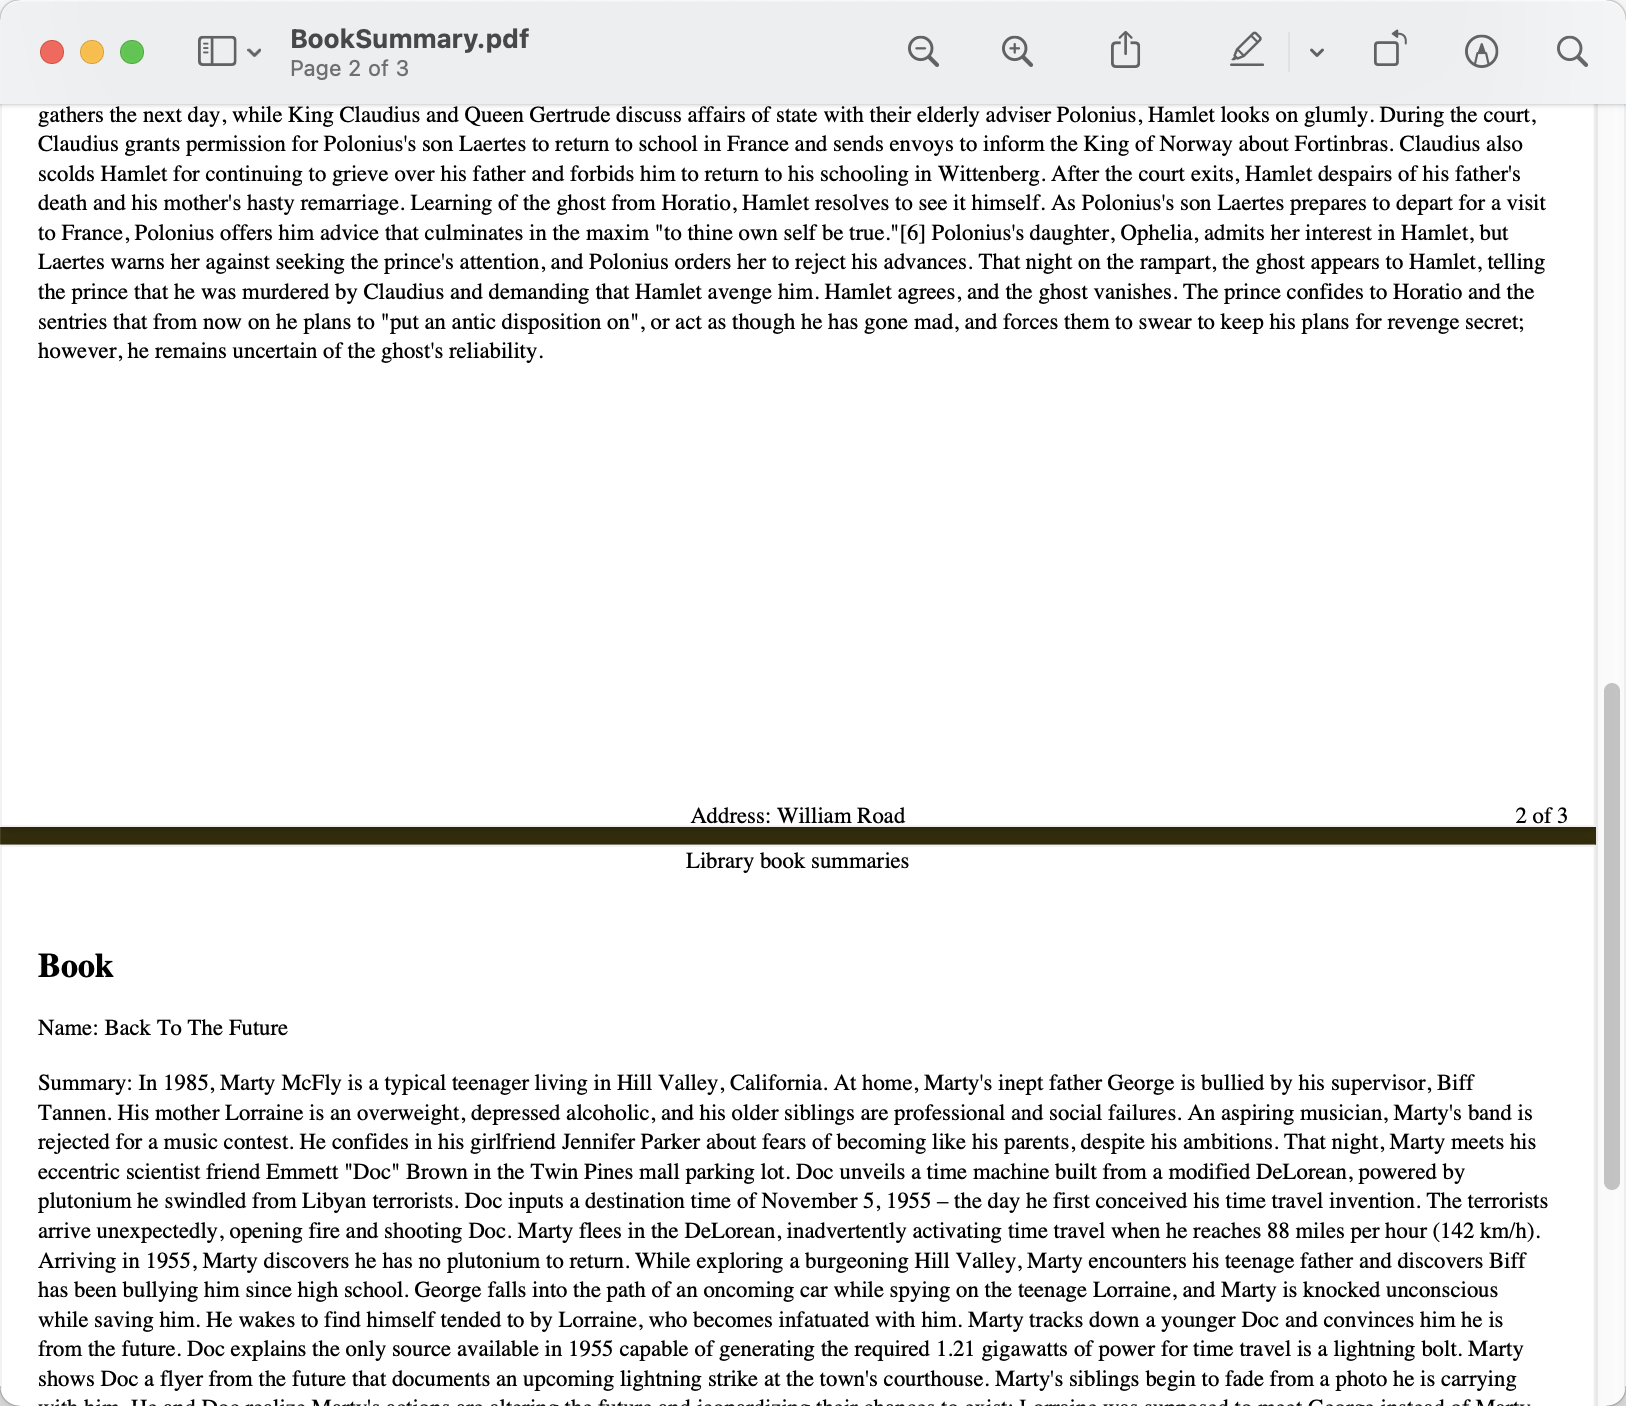
In this example, we now want to create a report about book summaries with landscape orientation, page numbers, fixed header and footer on each page, configured using special CSS rules and properties. The output format is HTML exported to PDF:
-
The report data structure
Let’s create a simple report without parameters. The JPQL query will select all books with their local attributes:
nameandsummary.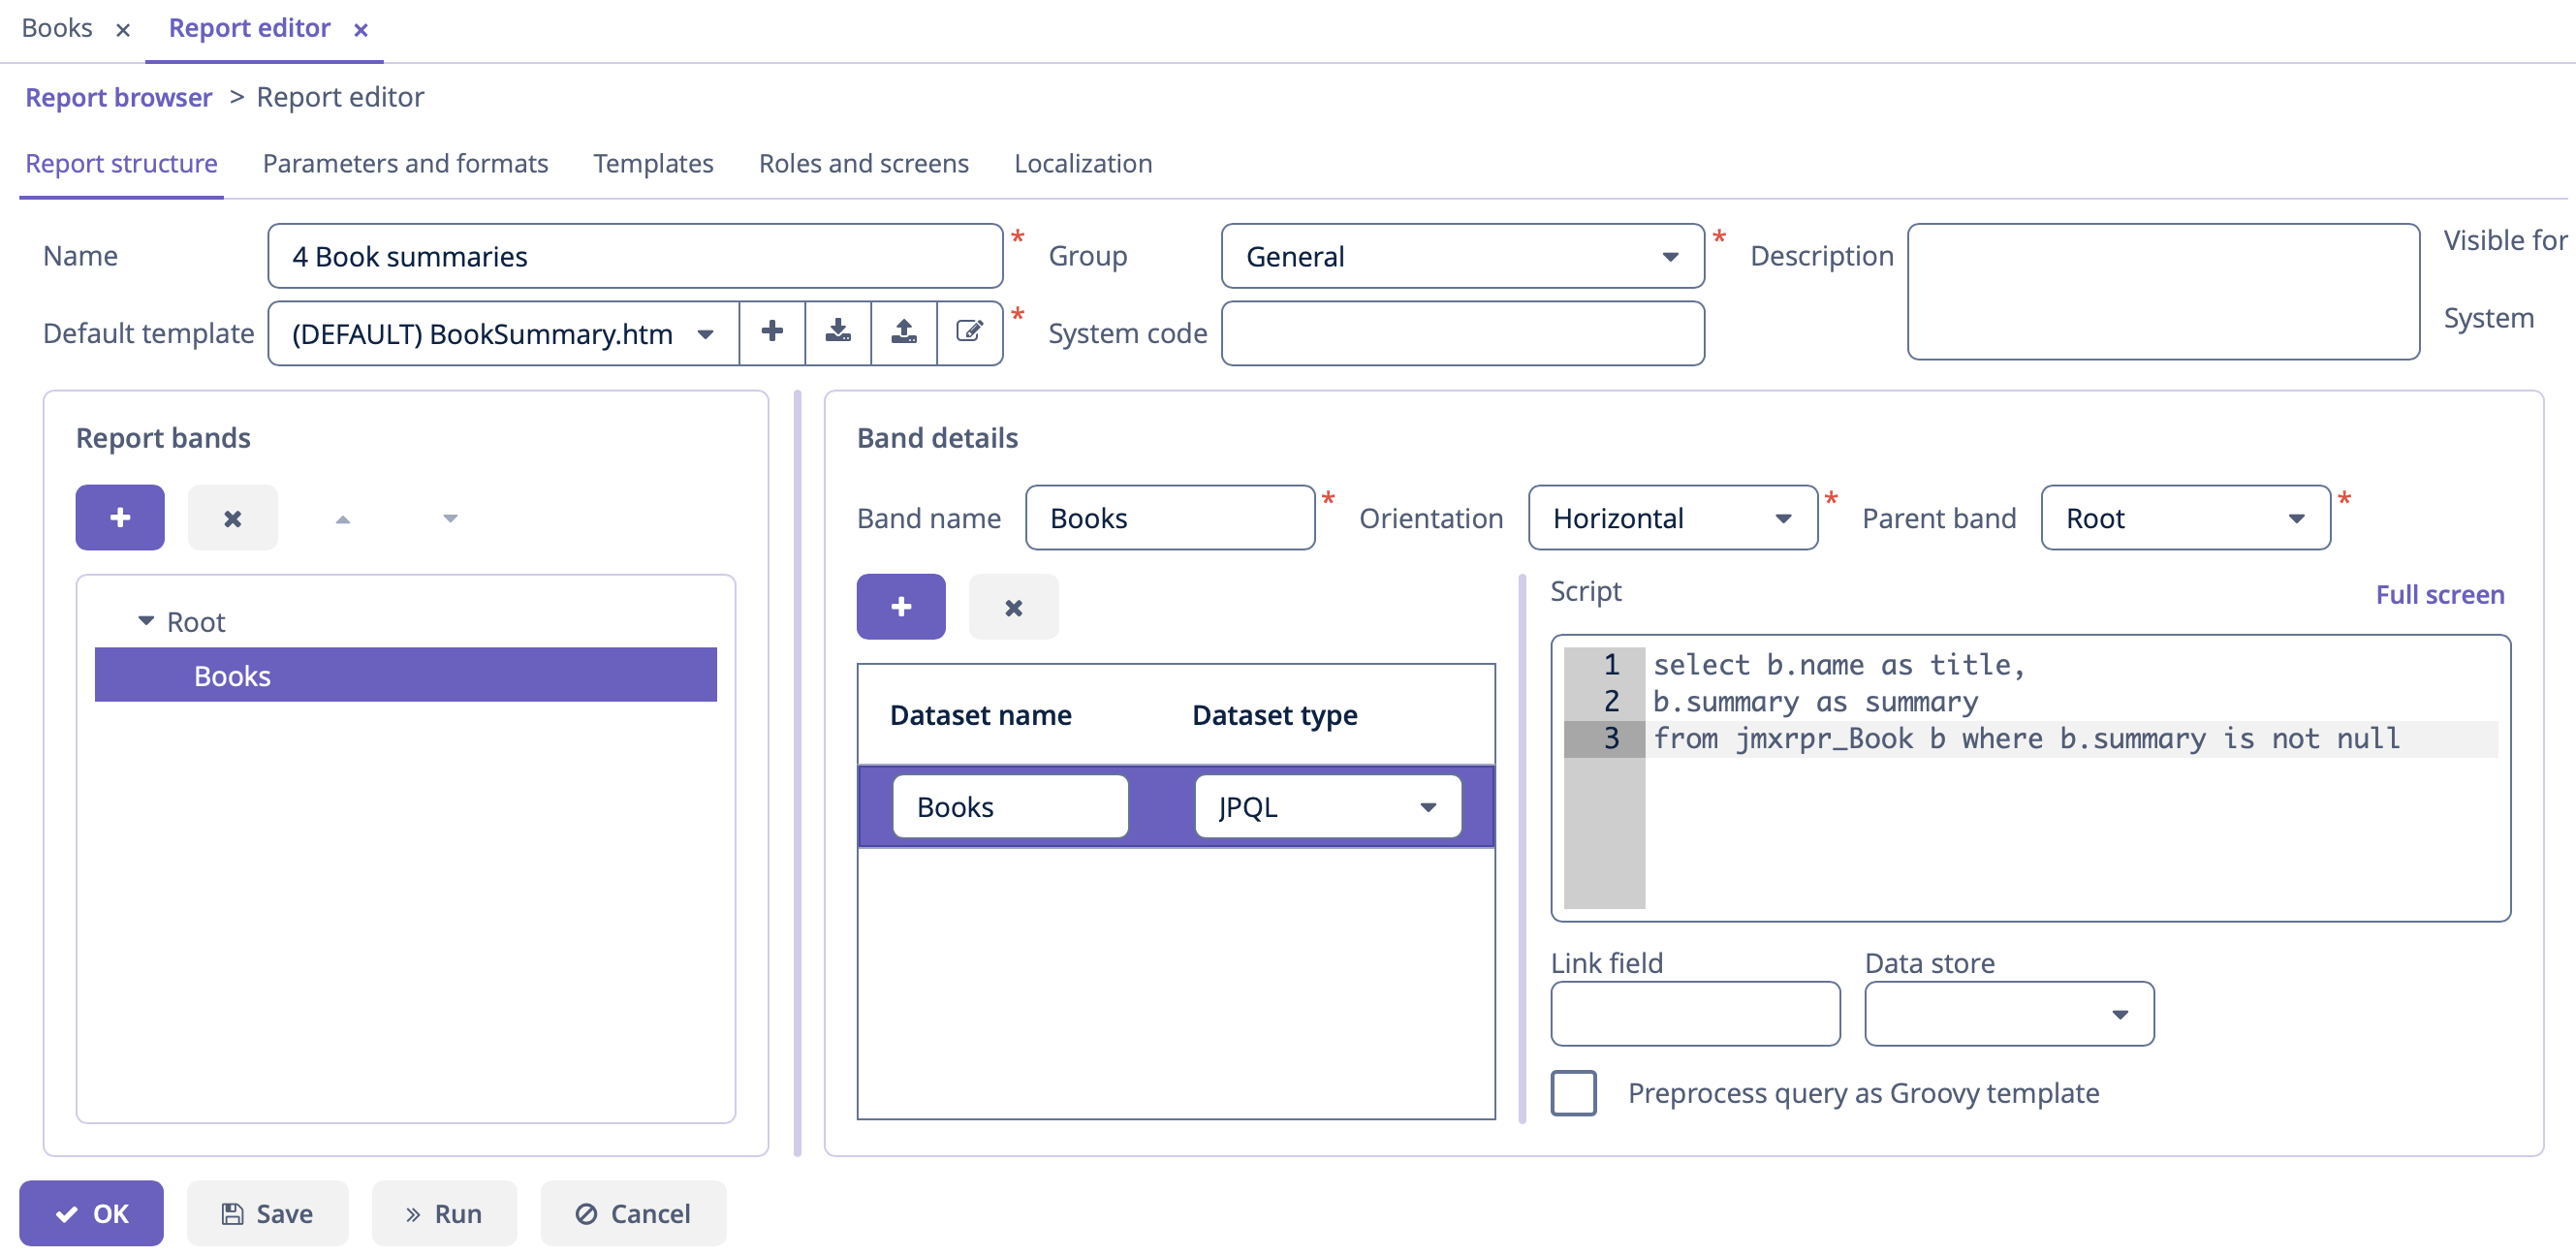 Figure 13. Report data structure
 -
Report template.
Now let’s create the report template file. Here we define header and footer blocks that will be printed on each PDF page. Also we use special
page-break-before:alwaysCSS property. It will generate a page break before each book info block.As you can see, we use FreeMarker statements to insert data to our template. See complete FreeMarker reference documentation.
<body> <h1>Books report</h1> <!-- Custom HTML header --> <div class="header"> Library book summaries </div> <!-- Custom HTML footer --> <div class="footer"> Address: William Road </div> <#assign books=Root.bands.Books /> <#list books as book> <div class="custom-page-start" style="page-break-before: always;"> <h2>Book</h2> <p>Name: ${book.fields.title}</p> <p>Summary: ${book.fields.summary}</p> </div> </#list> </body> -
CSS rules
We will use the following CSS code to set header/footer postions:
div.header {
    display: block;
    text-align: center;
    position: running(header);
    width: 100%;
}

div.footer {
    display: block;
    text-align: center;
    position: running(footer);
    width: 100%;
}
And following CSS code to tune our PDF page representation, as well as paddings of the main content to prevent content and header/footer overlapping:
body {
    font: 12pt Georgia, "Times New Roman", Times, serif;
    line-height: 1.3;
    padding-top: 50px;
}

@page {
    /* switch to landscape */
    size: landscape;
    /* set page margins */
    margin: 0.5cm;

    @top-center {
        content: element(header);
    }

    @bottom-center {
        content: element(footer);
    }

    @bottom-right {
        content: counter(page) " of "counter(pages);
    }
}

.custom-page-start {
    margin-top: 50px;
}
So, the complete BookSummary.html file will look as below:
<!DOCTYPE html PUBLIC "-//W3C//DTD XHTML 1.1//EN" "http://www.w3.org/TR/xhtml11/DTD/xhtml11.dtd"> <html xmlns="http://www.w3.org/1999/xhtml"> <head> <title>Invoice</title> <style type="text/css"> body { font: 12pt Georgia, "Times New Roman", Times, serif; line-height: 1.3; padding-top: 50px; } div.header { display: block; text-align: center; position: running(header); width: 100%; } div.footer { display: block; text-align: center; position: running(footer); width: 100%; } @page { /* switch to landscape */ size: landscape; /* set page margins */ margin: 0.5cm; @top-center { content: element(header); } @bottom-center { content: element(footer); } @bottom-right { content: counter(page) " of "counter(pages); } } .custom-page-start { margin-top: 50px; } </style> </head> <body> <h1>Books report</h1> <!-- Custom HTML header --> <div class="header"> Library book summaries </div> <!-- Custom HTML footer --> <div class="footer"> Address: William Road </div> <#assign books=Root.bands.Books /> <#list books as book> <div class="custom-page-start" style="page-break-before: always;"> <h2>Book</h2> <p>Name: ${book.fields.title}</p> <p>Summary: ${book.fields.summary}</p> </div> </#list> </body> </html> -
Create the report template, here we select Freemarker template type:
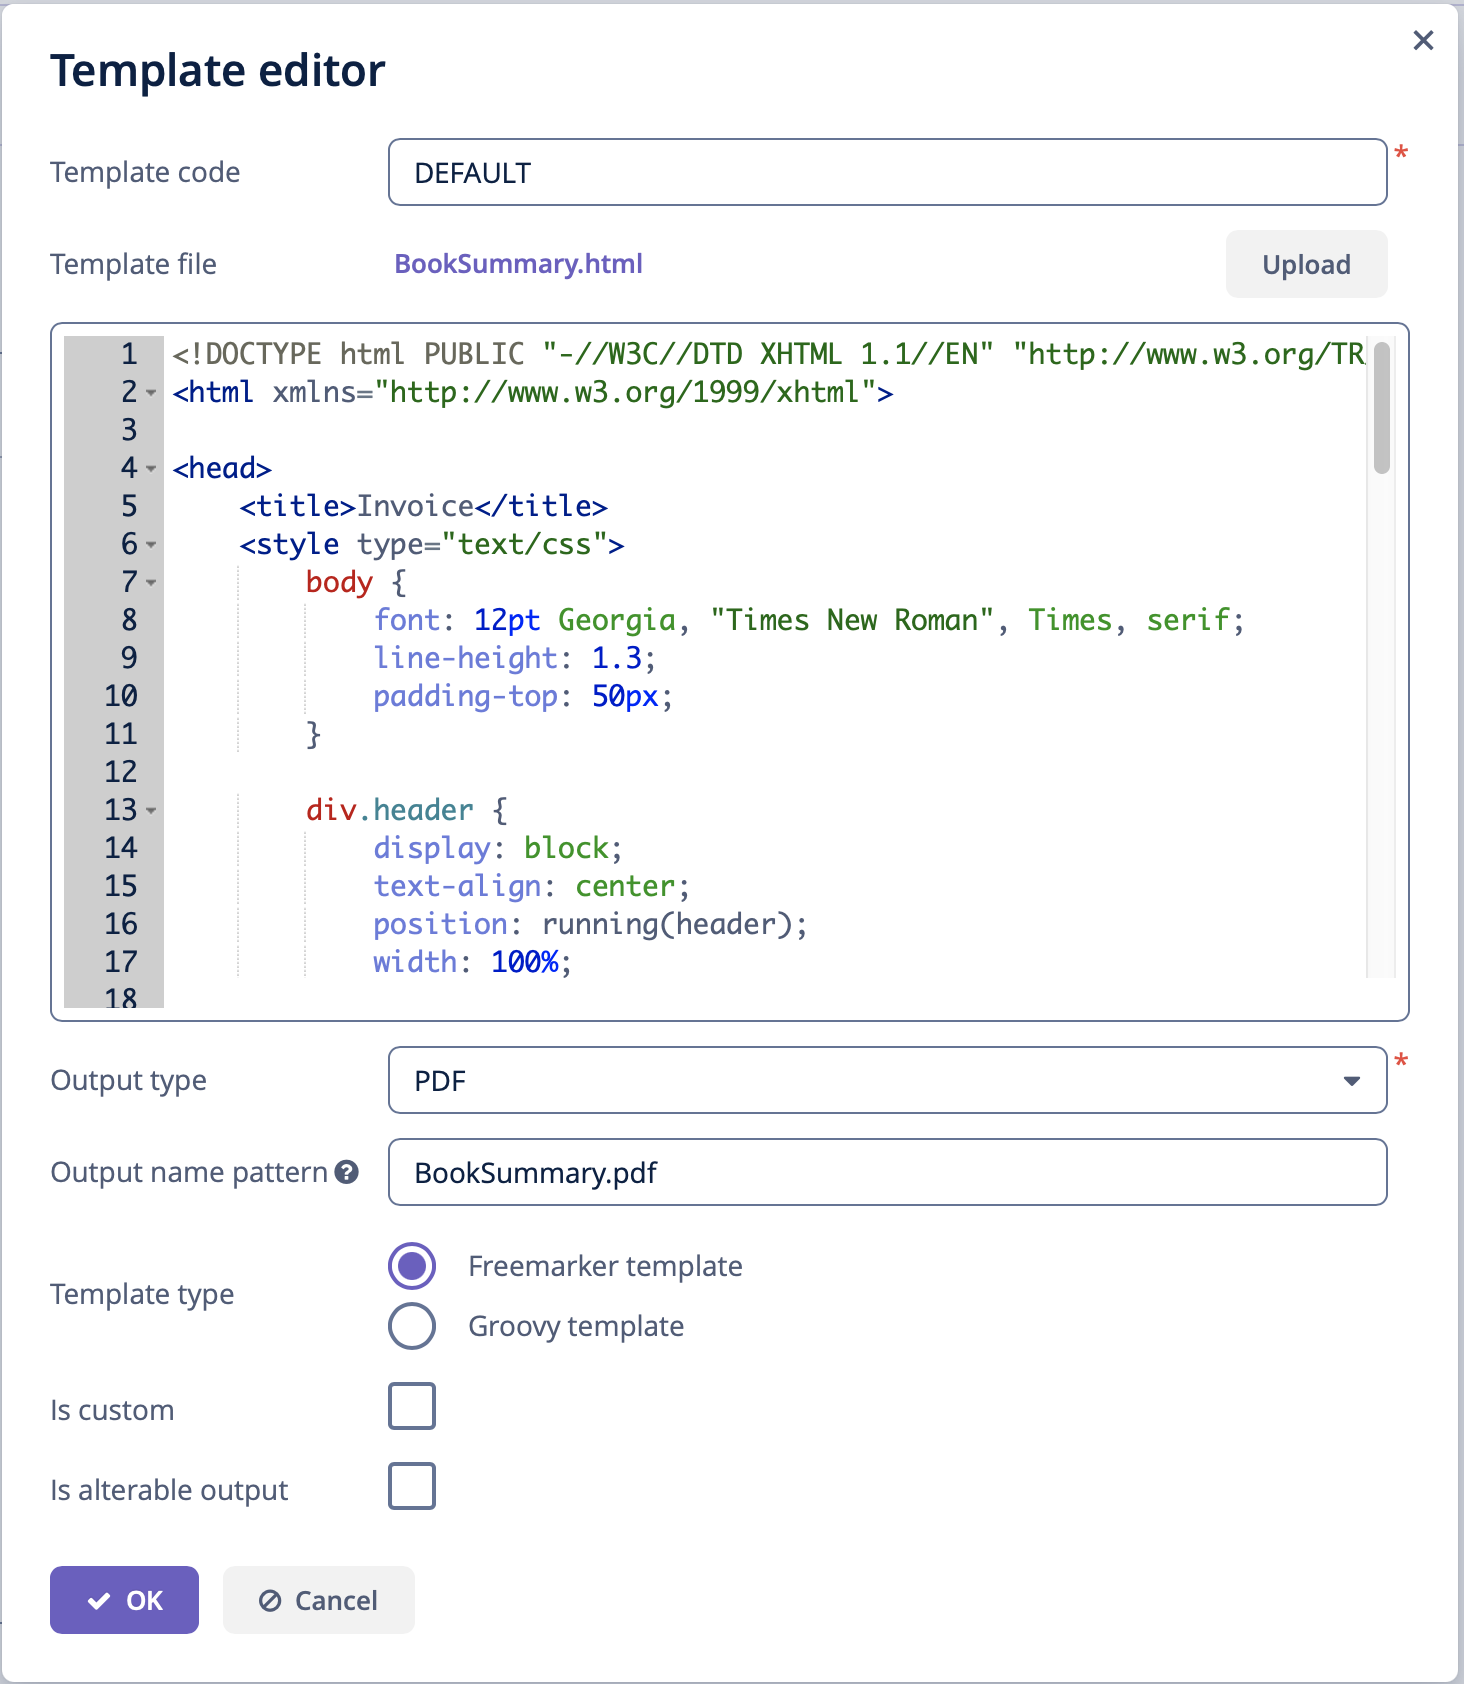 Figure 14. Template editor
You can run the report from the generic browser in the Reports → Run Reports screen.
HTML Report with Groovy Template Engine
The example is based on the sample Library application, please follow the instruction to set up your project then create entities and screens.
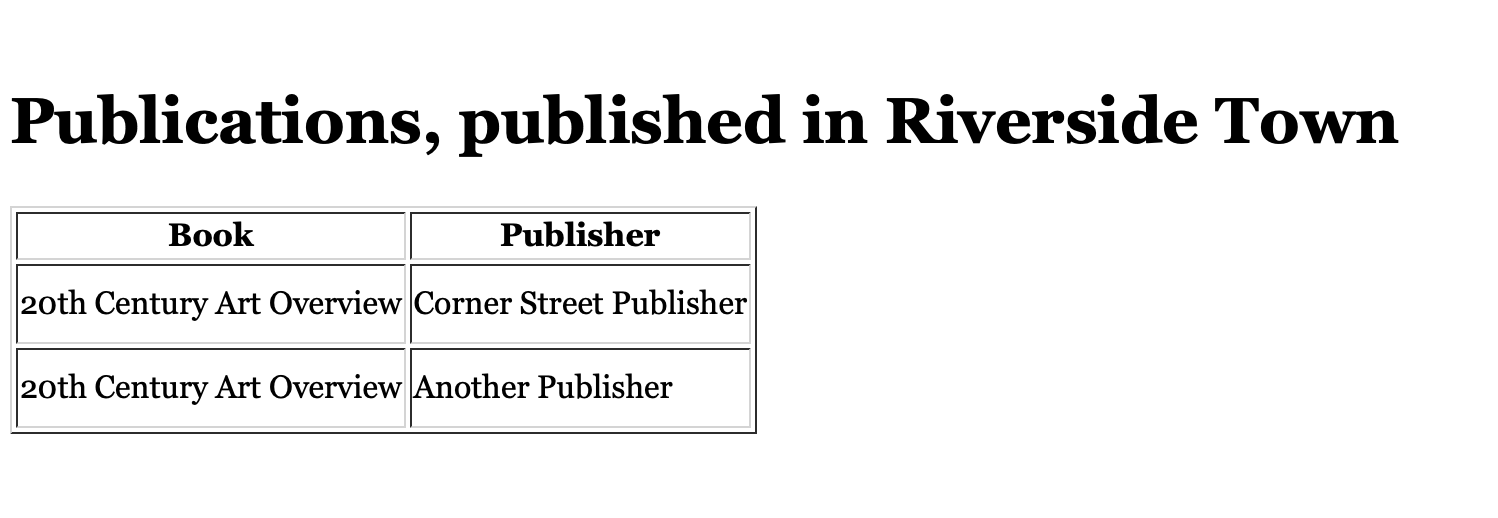
Let’s create a report that displays the list of book publications for the selected town. The output format is HTML:
-
Create a report with JPQL dataset:
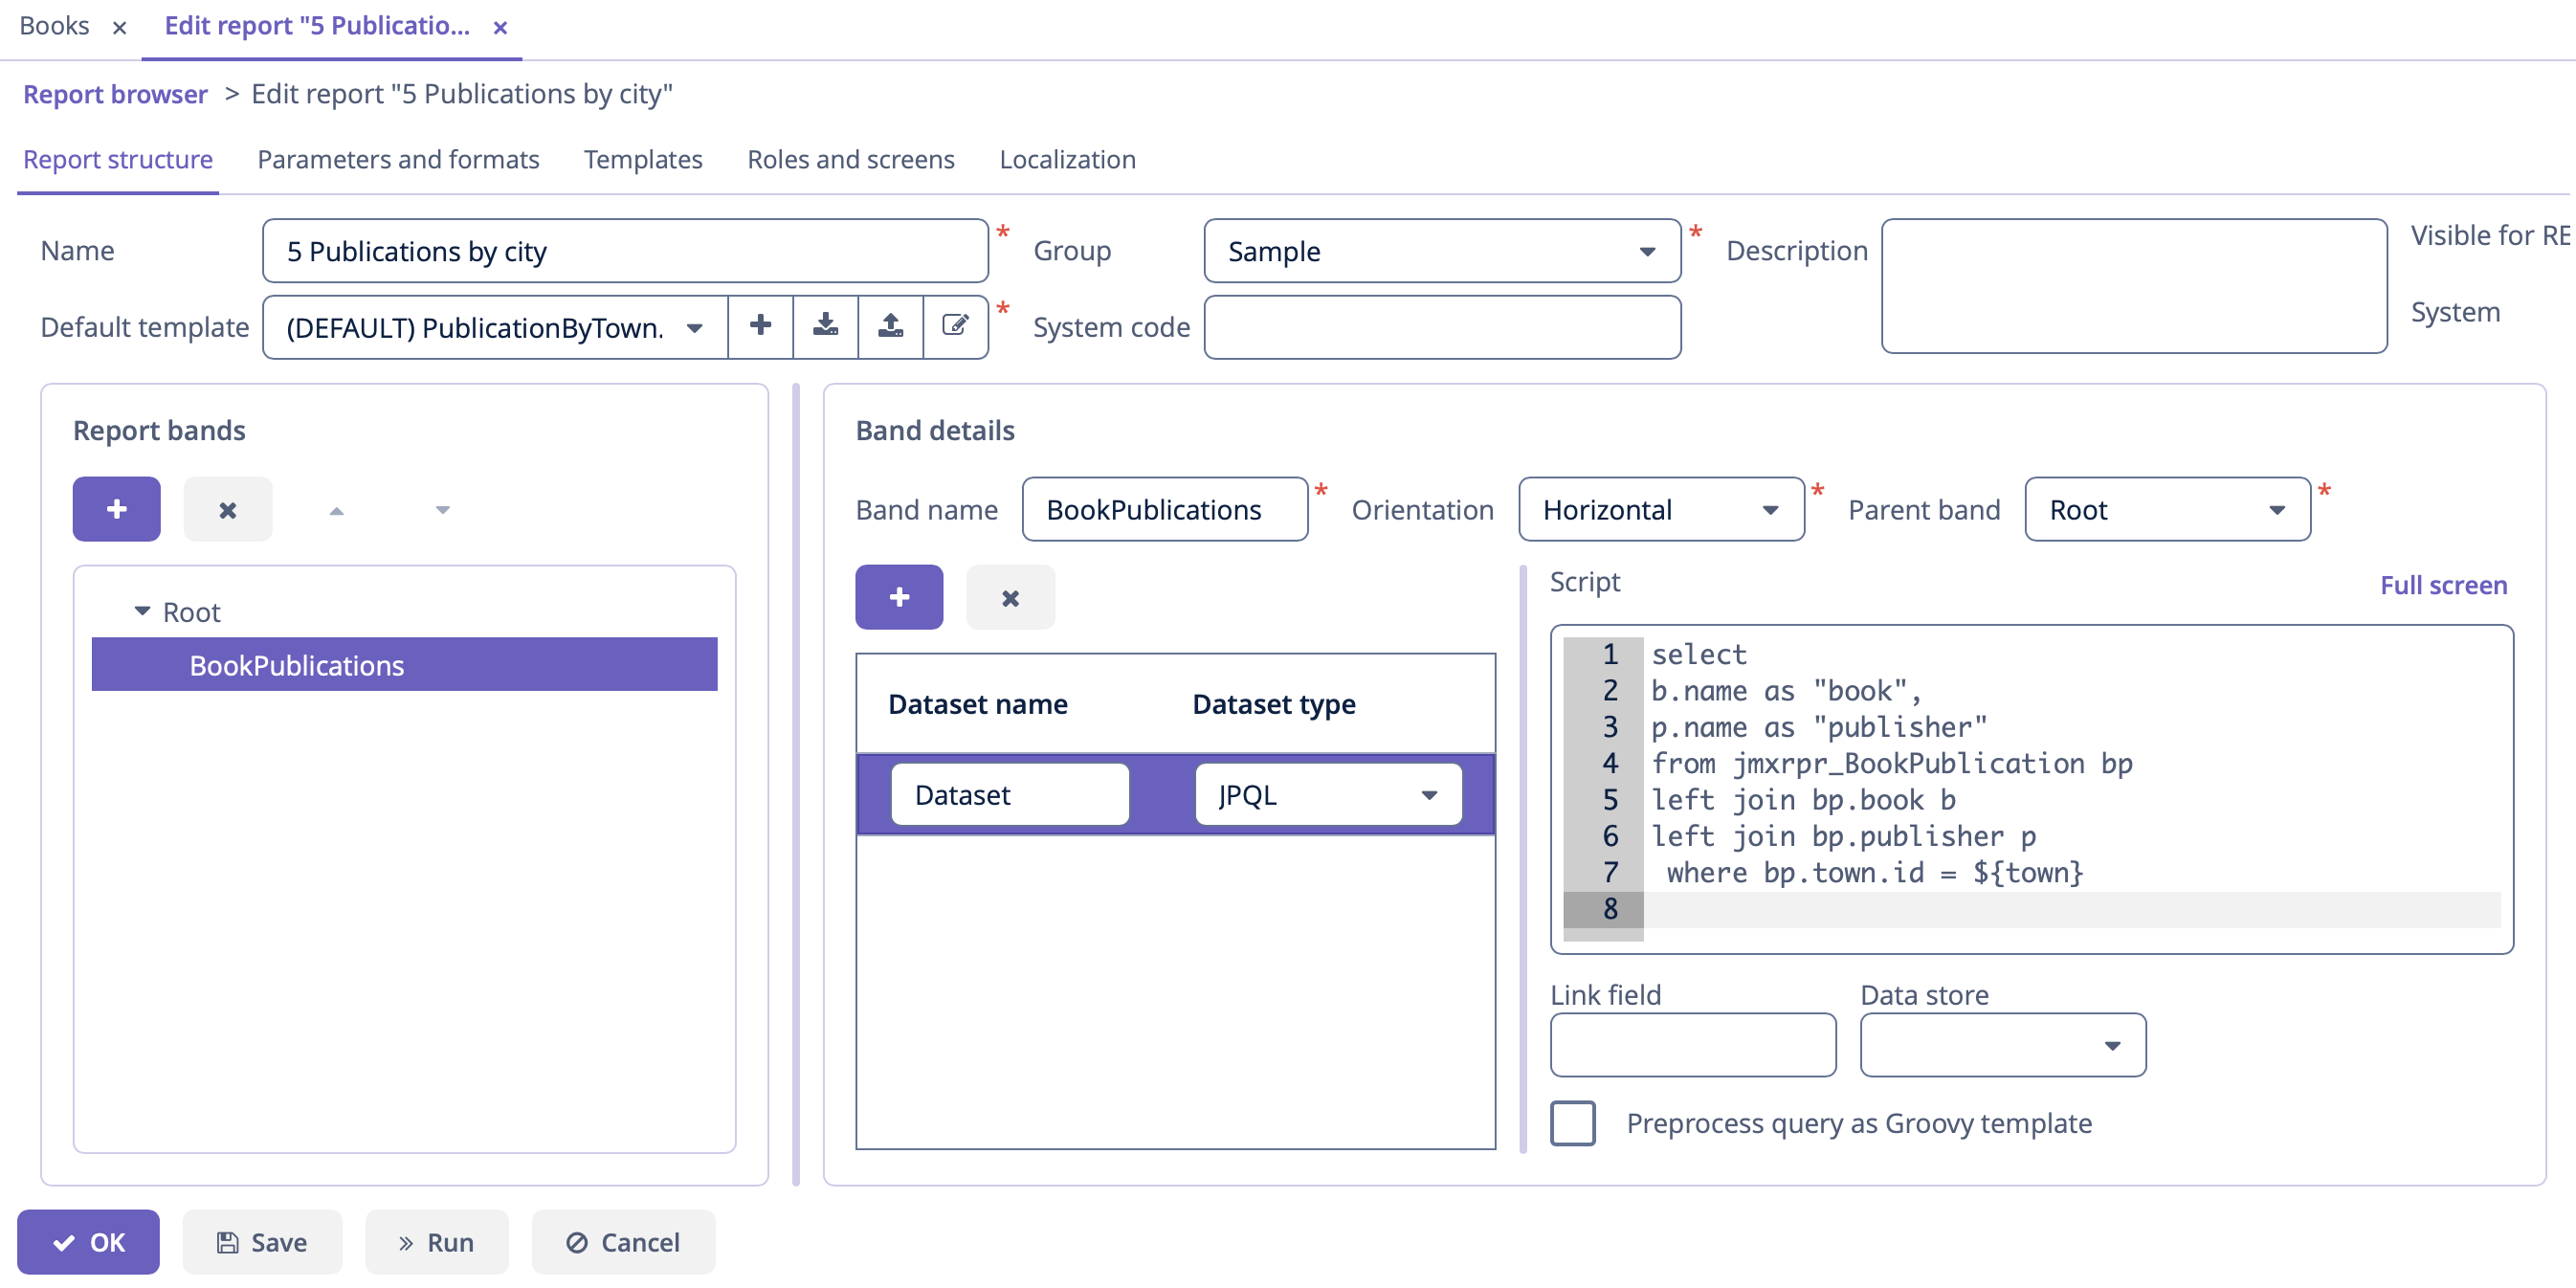 Figure 16. Report data structure
The
BookPublicationsband outputs the list of book’s publications by running the following JPQL query:BookPublications datasetselect b.name as "book", p.name as "publisher" from jmxrpr_BookPublication bp left join bp.book b left join bp.publisher p where bp.town.id = ${town}This query uses the external report parameter –
town. The parameter has the Entity type; however, in JPQL queries you can compare it directly with entity identifier fields; the conversion will be done automatically. -
Describe the report parameter:
The Parameters and Formats tab contains one declared report external parameter –
Town: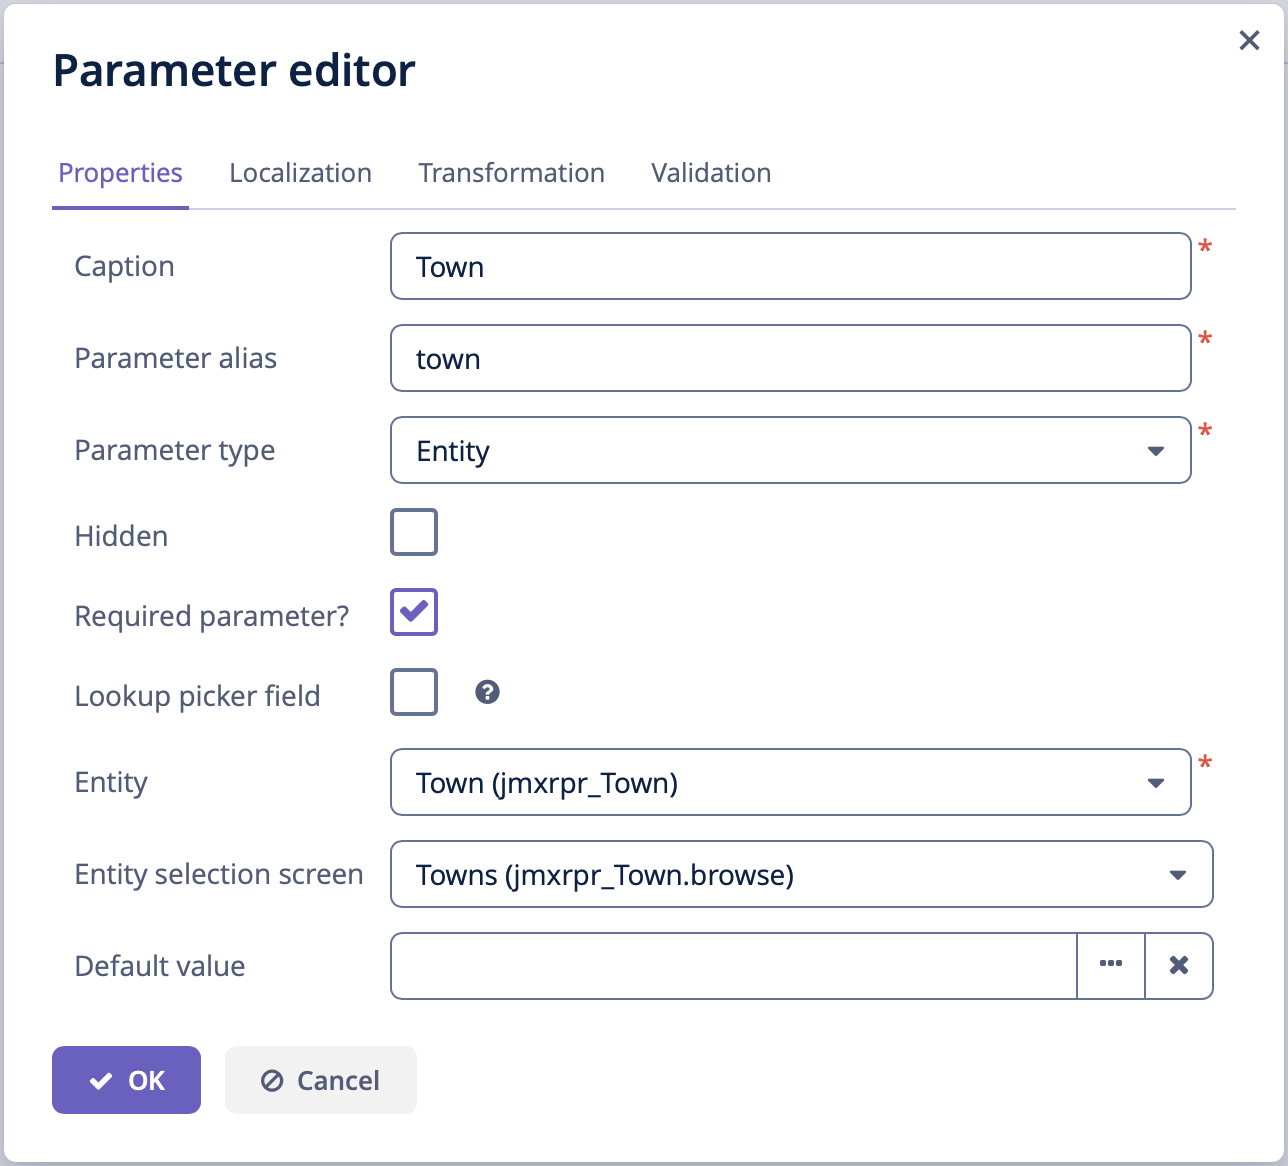 Figure 17. The report parameter
When running the report, the user will have to enter this parameter. The town selection will be performed via the
jmxrpr_Town.browsescreen, available in the application. -
Create a report template
Create the new HTML file or download PublicationByTown.html with the following content:
PublicationsTemplate<?xml version="1.0" encoding="utf-8"?> <!DOCTYPE html PUBLIC "-//W3C//DTD XHTML 1.1//EN" "http://www.w3.org/TR/xhtml11/DTD/xhtml11.dtd"> <html xmlns="http://www.w3.org/1999/xhtml" xml:lang="ru"> <head> <title> Publications by town </title> <style type="text/css"> body { font: 12pt Georgia, "Times New Roman", Times, serif; line-height: 1.3; padding-top: 30px; } tbody tr { height: 40px; min-height: 20px } </style> </head> <body> <h1>Publications, published in <% out << "${Root.fields.town.name}" %> </h1> <% def bookPublications=Root.bands.BookPublications.fields %> <table class="report-table" border="1" cellspacing="2"> <thead> <tr> <th>Book</th> <th>Publisher</th> </tr> </thead> <tbody> <% bookPublications.title.eachWithIndex{ elem, index -> out << "<tr><td> ${bookPublications.book[index]} </td><td> ${bookPublications.publisher[index]} </td></tr>" } %> </tbody> </table> </body> </html>The value of the input parameter is used to generate the report title:
${Root.fields.town.name}.The variable
bookPublicationsis defined below:<% def bookPublications=Root.bands.BookPublications.fields %>This variable is used in the table’s body to display the report fields.
<% bookPublications.title.eachWithIndex{ elem, index ->
    out << "<tr><td> ${bookPublications.book[index]} </td><td> ${bookPublications.publisher[index]} </td></tr>"
        } %>
Upload the new template to the application, select HTML output type, select Groovy template in the Template type radiobutton and make it default:
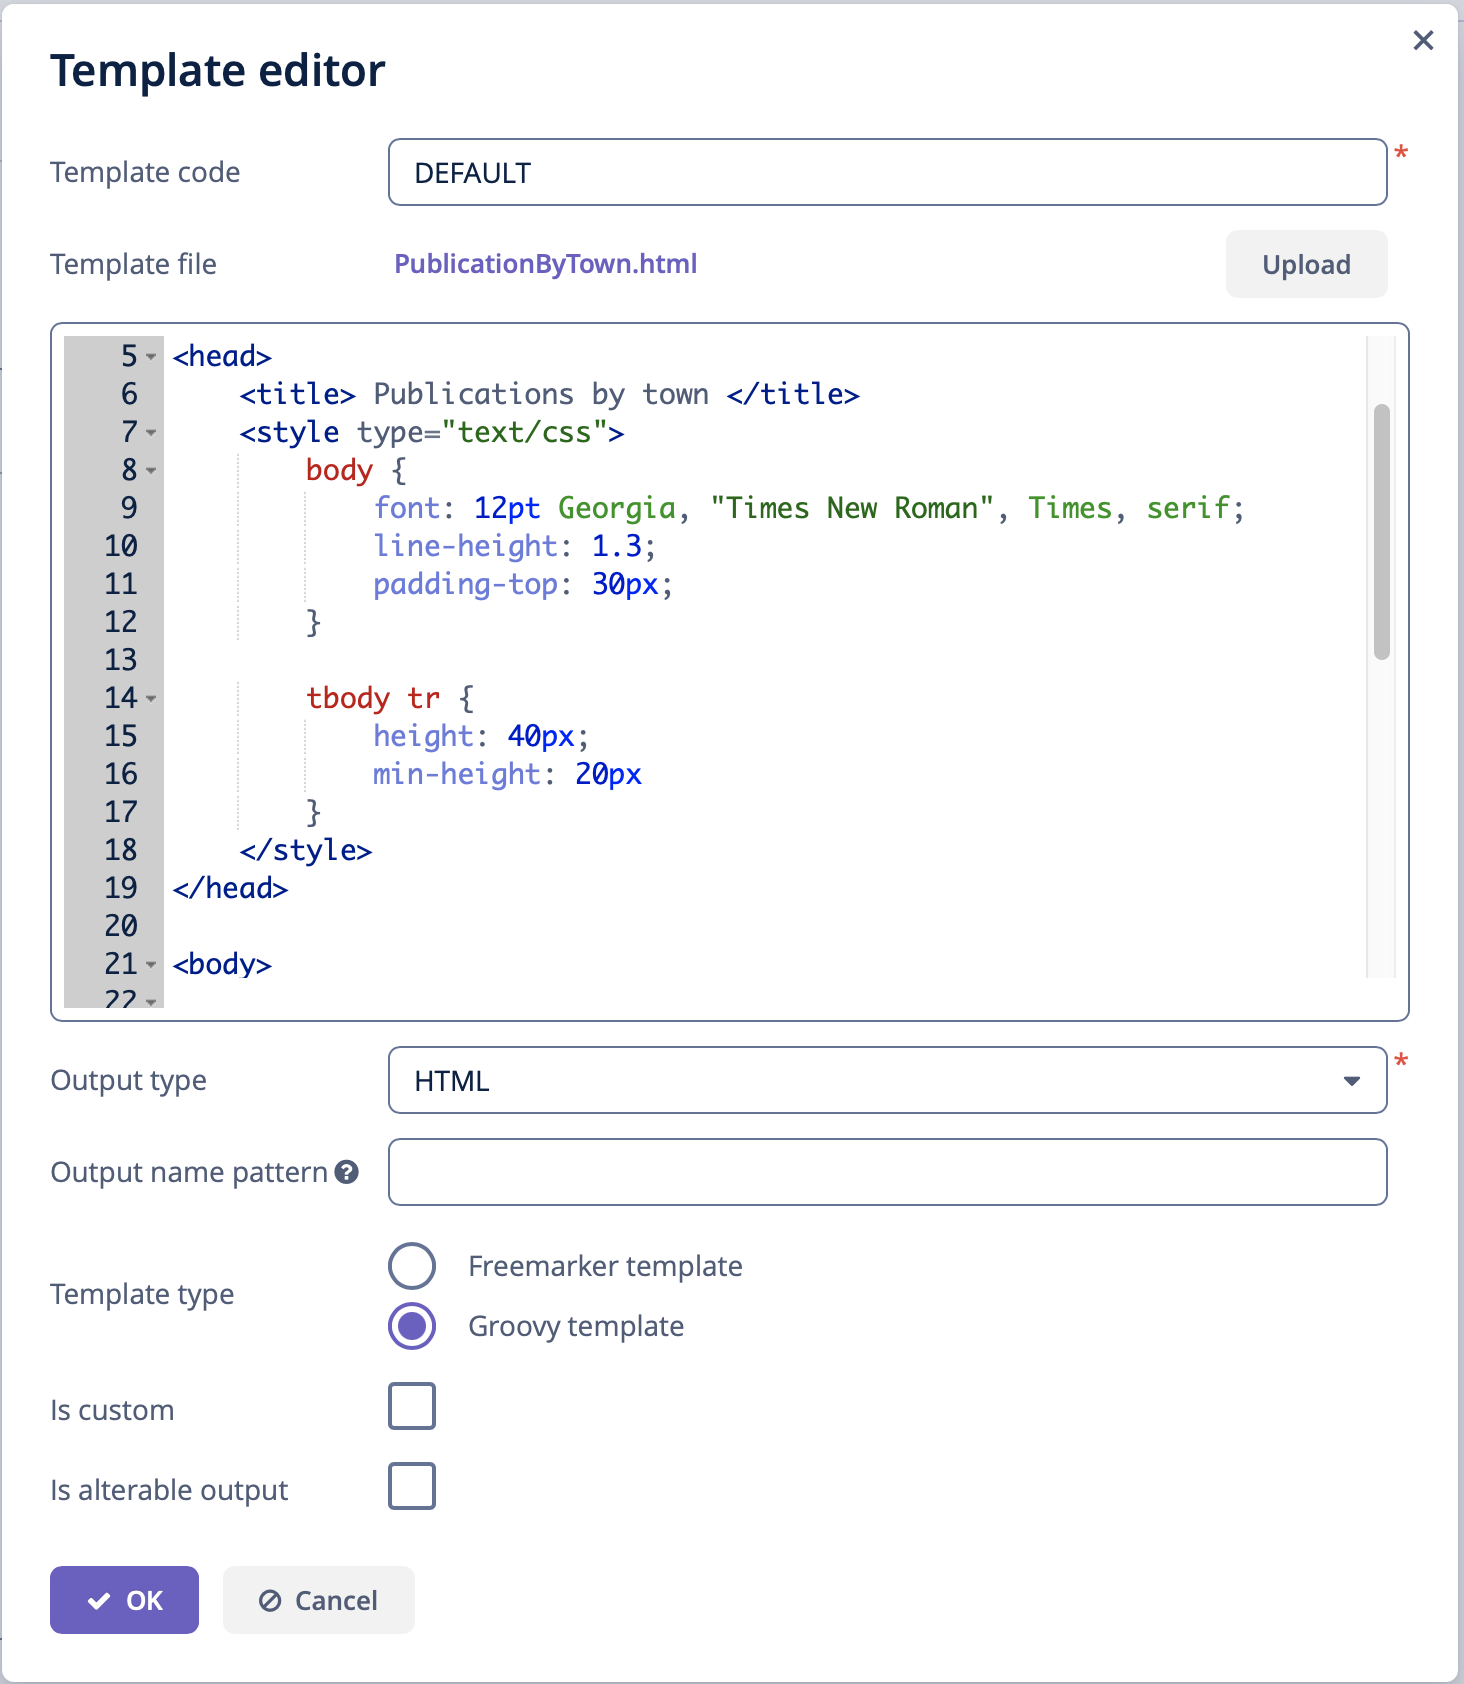 Figure 18. Report template editor
You can run the report from the generic browser in the Reports → Run Reports screen.
