Pie Chart
In this section, you will:
-
Create a pie chart
-
Add a
formatterattribute -
Bind data through a data provider
Pie Chart Setup
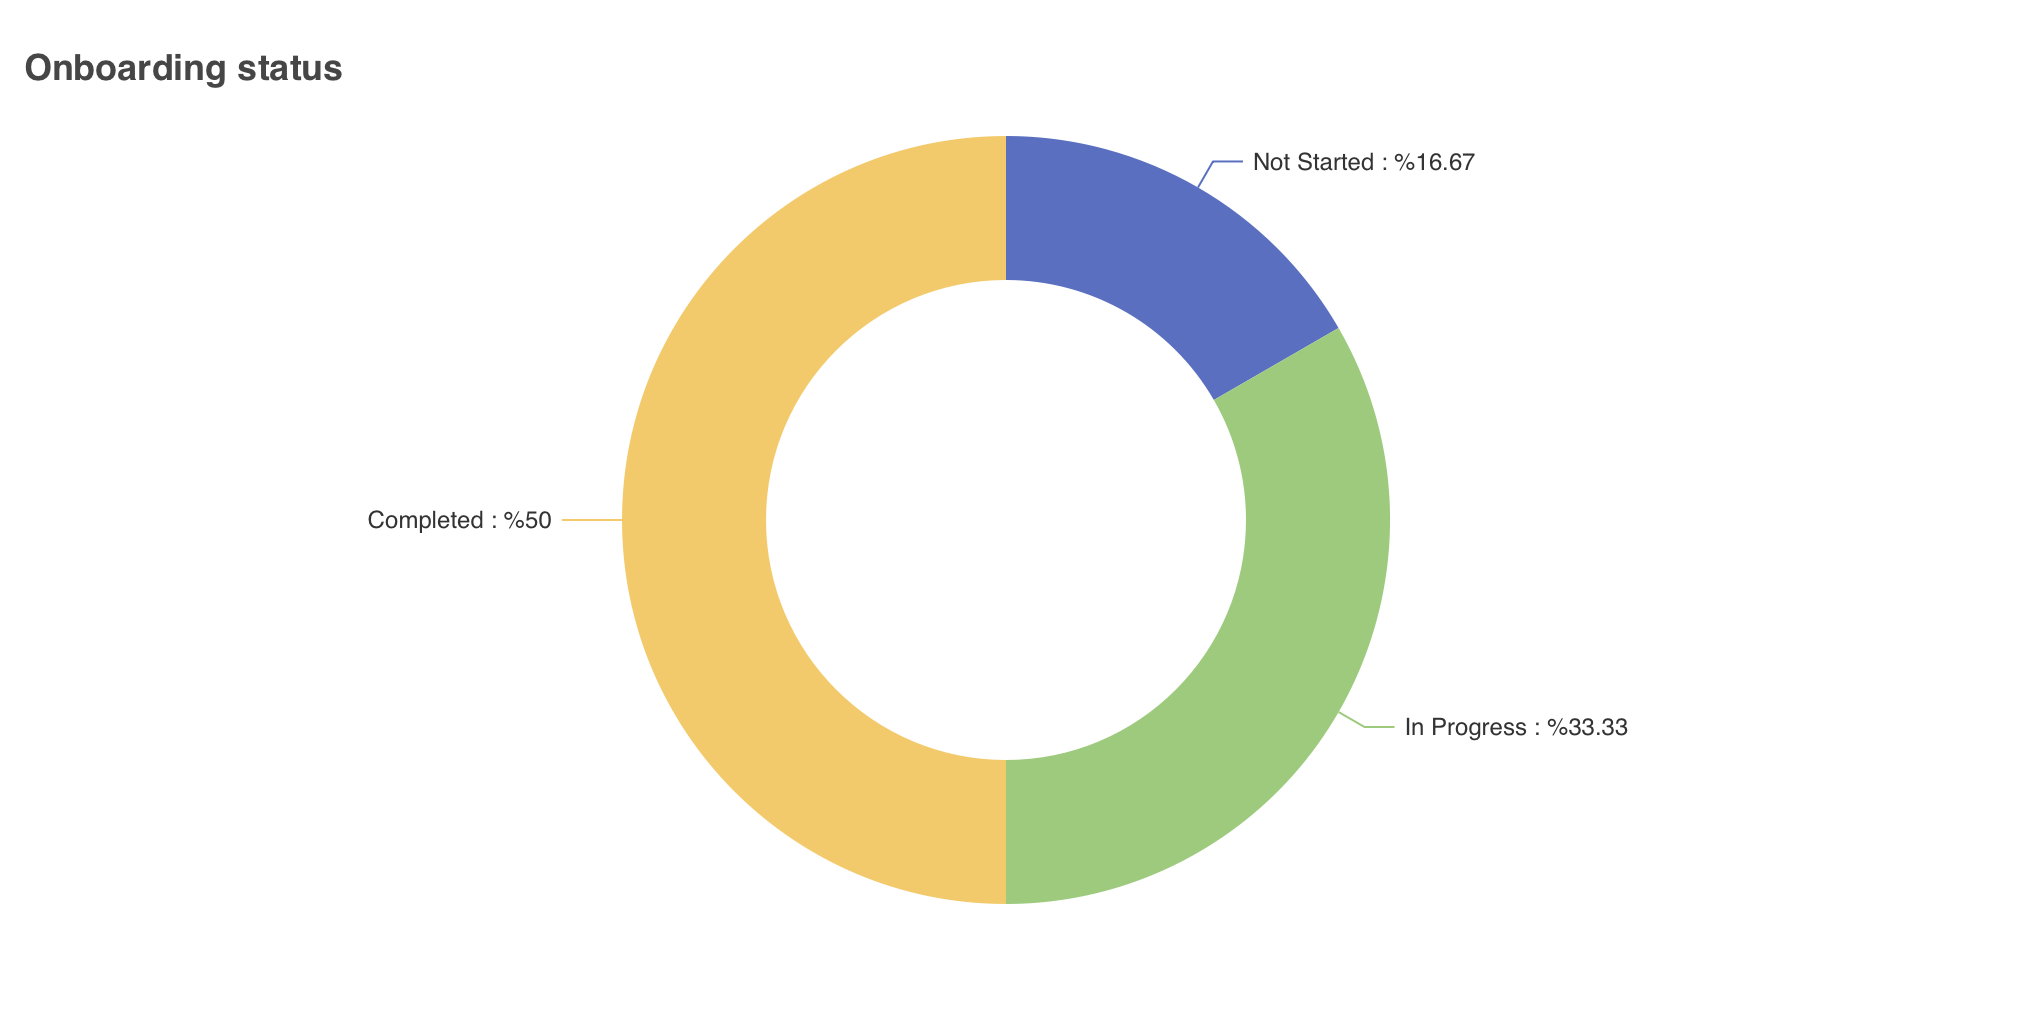
You will integrate a pie chart component to display the distribution of users across different onboarding statuses for a snapshot of the onboarding progress within the organization.
Click on the formLayout element in user-list-view.xml.
Next, choose Add Component in the actions panel, locate and select the Chart item. Configure the id, height and width attributes as follows.
<charts:chart id="pie" width="40em" height="80%" minHeight="30em" alignSelf="STRETCH">To include the pie series to your chart, choose the chart element and pick Add → Series → Pie. Add a name attribute for the pie chart: Onboarding Status and add a radius attribute to configure the size of your pie as follows.
<charts:pie name="Onboarding Status" radius="50% 80%">Formatting Value
The formatter attribute in the pie series supports string template and callback functions to format data.
To display the onboarding status and the percentage of users in that status in each slice of the pie chart, select the label element, then choose Add → Label.
Set the formatter attribute in the label element to "{b} : %{d}", where:
-
{b}: Represents the name of the data item (category) - in this context, it’s the onboarding status like "Not Started," "In Progress," or "Completed." -
{d}: Represents the percentage of the total that this data item (category) constitutes.
<charts:series>
    <charts:pie name="Onboarding Status" radius="50% 80%">
        <charts:label formatter="{b} : {d}%"/>
    </charts:pie>
</charts:series>
Data Binding Using Data Provider
The pie chart should display onboarding statuses in percentages. The data isn’t directly sourced from a single entity attribute but requires aggregation based on user statuses.
That’s why you’ll need a data provider to pass aggregated data to the DataSet in the controller.
Navigate to the controller class by selecting Controller and inject the pie chart component into your controller class to interact with the chart component programmatically.
@ViewComponent
protected Chart pie;
To handle data when the view initializes, create an InitEvent handler.
Within the onInit method, you’ll retrieve count of users according to their onboarding status, and pass this information to the DataSet class.
Use DataManager to load the total number of users within each onboarding status category as follows:
final Integer notStarted = dataManager.loadValue(
                "select count(u) from User u where u.onboardingStatus = :onboardingStatus",
                Integer.class
        )
        .parameter("onboardingStatus", OnboardingStatus.NOT_STARTED)
        .one();

final Integer inProgress = dataManager.loadValue(
                "select count(u) from User u where u.onboardingStatus = :onboardingStatus",
                Integer.class
        )
        .parameter("onboardingStatus", OnboardingStatus.IN_PROGRESS)
        .one();


final Integer completed = dataManager.loadValue(
                "select count(u) from User u where u.onboardingStatus = :onboardingStatus",
                Integer.class
        )
        .parameter("onboardingStatus", OnboardingStatus.COMPLETED)
        .one();
Next, create ListChartItems to store the chart data. Create MapDataItem instances for each onboarding status, mapping the status name to its count.
Bind the prepared data items to the pie chart. As with the dataSet XML element, define categoryField as the status name and valueField as the list size.
You should get the following method by the end of this tutorial.
@Subscribe
public void onInit(final InitEvent event) {
    final Integer notStarted = dataManager.loadValue(
                    "select count(u) from User u where u.onboardingStatus = :onboardingStatus",
                    Integer.class
            )
            .parameter("onboardingStatus", OnboardingStatus.NOT_STARTED)
            .one();

    final Integer inProgress = dataManager.loadValue(
                    "select count(u) from User u where u.onboardingStatus = :onboardingStatus",
                    Integer.class
            )
            .parameter("onboardingStatus", OnboardingStatus.IN_PROGRESS)
            .one();


    final Integer completed = dataManager.loadValue(
                    "select count(u) from User u where u.onboardingStatus = :onboardingStatus",
                    Integer.class
            )
            .parameter("onboardingStatus", OnboardingStatus.COMPLETED)
            .one();
    ListChartItems<MapDataItem> items = new ListChartItems<>(
            new MapDataItem(Map.of("category", "Completed", "value", notStarted)),
            new MapDataItem(Map.of("category", "Not Started", "value", inProgress)),
            new MapDataItem(Map.of("category", "In Progress", "value", completed))
        );


    pie.setDataSet(
            new DataSet()
                    .withSource(
                            new DataSet.Source<MapDataItem>()
                                    .withDataProvider(items)
                                    .withCategoryField("category")
                                    .withValueField("value")
                    )
    );
}
This pie chart visualizes the percent of employees by onboarding status.