XYChart
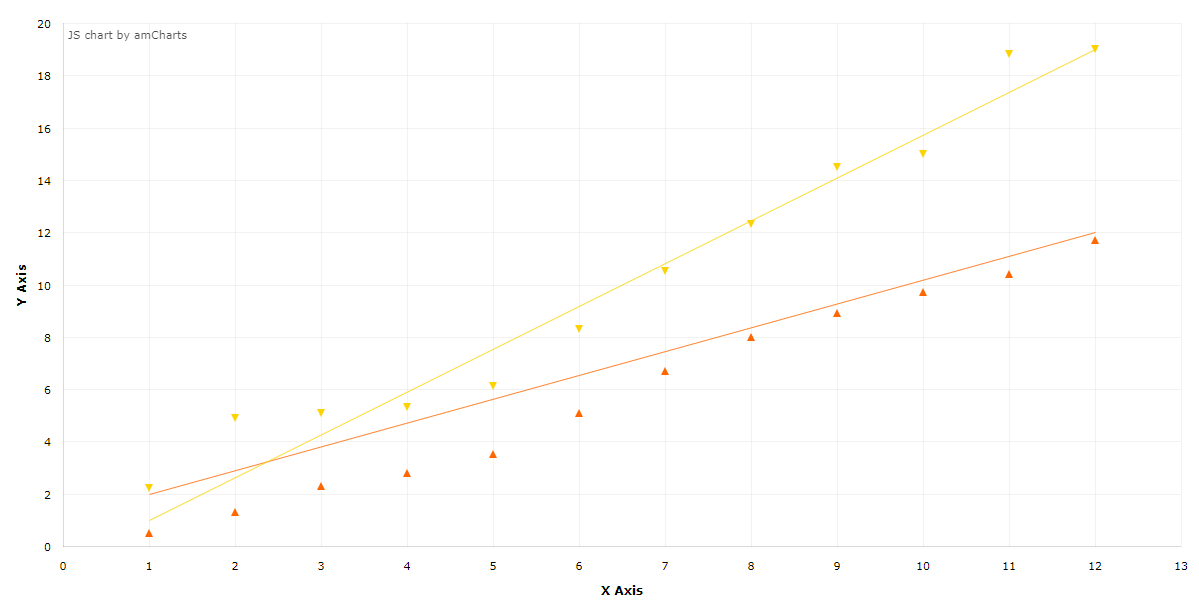
The XYChart component allows you to create XY/bubble/scatter charts. The charts support multiple axes with simple or logarithmic scales.
XYChart
Component’s XML name: chart:xyChart.
Data Binding
You can assign a CollectionContainer to the chart and then define the xField and yFields attributes for the nested graph elements:
<chart:xyChart id="xyChart"
               autoMarginOffset="20"
               dataContainer="pointPairDc"
               height="100%"
               marginBottom="60"
               marginLeft="64"
               startDuration="1"
               theme="LIGHT"
               width="100%">
    <chart:graphs>
        <chart:graph balloonText="x:[[x]] y:[[y]]"
                     bullet="TRIANGLE_UP"
                     fillAlphas="0"
                     lineAlpha="0"
                     lineColor="#FF6600"
                     xField="ax"
                     yField="ay"/>
        <chart:graph balloonText="x:[[x]] y:[[y]]"
                     bullet="TRIANGLE_DOWN"
                     fillAlphas="0"
                     lineAlpha="0"
                     lineColor="#FCD202"
                     xField="bx"
                     yField="by"/>
    </chart:graphs>
    <chart:valueAxes>
        <chart:axis axisAlpha="0"
                    dashLength="1"
                    position="BOTTOM"
                    title="X Axis"/>
        <chart:axis axisAlpha="0"
                    dashLength="1"
                    position="LEFT"
                    title="Y Axis"/>
    </chart:valueAxes>
</chart:xyChart>
Events and Handlers
|
To generate a handler stub in Jmix Studio, select the component in the screen descriptor XML or in the Jmix UI hierarchy panel and use the Handlers tab of the Jmix UI inspector panel. Alternatively, you can use the Generate Handler button in the top panel of the screen controller. |
For more details, see AmCharts documentation.
Was this page helpful?

Thank you for your feedback