Data Binding
DataProvider
The dataSet element accepts a DataProvider implementation as its source. An instance of DataProvider is passed to the withDataProvider() method from the DataSet.Source element of chart component.
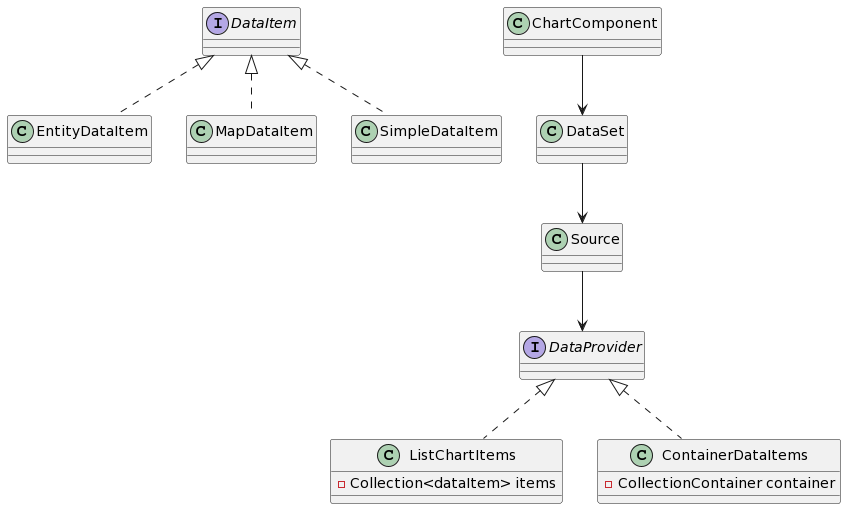
The DataProvider interface has two standard implementations: ListChartItems and ContainerChartItems classes. The choice between ChartDataItems and ContainerDataItems depends on the data source.
ListChartItems
Using ListChartItems allows manual addition of data items within a chart to present non-entity based or dynamically aggregated data.
The ListChartItems implementation holds a collection of DataItem instances. The DataItem interface has three implementations:
-
EntityDataItemwraps an instance of any entity for chart data representation:// ... ListChartItems<EntityDataItem> entityChartItems = new ListChartItems<>( List.of( new EntityDataItem(createValueDescriptionEntity(75, "Sky")), new EntityDataItem(createValueDescriptionEntity(7, "Shady side of pyramid")), new EntityDataItem(createValueDescriptionEntity(18, "Sunny side of pyramid")) ) ); entityChart.withDataSet( new DataSet().withSource( new DataSet.Source<EntityDataItem>() .withDataProvider(entityChartItems) .withCategoryField("description") .withValueField("value") ) ); } protected ValueDescription createValueDescriptionEntity(Integer value, String description) { ValueDescription entity = metadata.create(ValueDescription.class); entity.setValue(value); entity.setDescription(description); return entity; } -
MapDataItemrepresents a set of key-value pairs as your chart’s data:ListChartItems<MapDataItem> mapChartItems = new ListChartItems<>( List.of( new MapDataItem(Map.of("value", 75, "description", "Sky")), new MapDataItem(Map.of("value", 7, "description", "Shady side of pyramid")), new MapDataItem(Map.of("value", 18, "description", "Sunny side of pyramid")) ) ); mapChart.withDataSet( new DataSet().withSource( new DataSet.Source<MapDataItem>() .withDataProvider(mapChartItems) .withCategoryField("description") .withValueField("value") ) ); -
SimpleDataItemsupports an instance of anypublicclass to define chart data:ListChartItems<SimpleDataItem> simpleChartItems = new ListChartItems<>( List.of( new SimpleDataItem(new ValueDescriptionDTO(75, "Sky")), new SimpleDataItem(new ValueDescriptionDTO(7, "Shady side of pyramid")), new SimpleDataItem(new ValueDescriptionDTO(18, "Sunny side of pyramid")) ) ); simpleChart.withDataSet( new DataSet().withSource( new DataSet.Source<SimpleDataItem>() .withDataProvider(simpleChartItems) .withCategoryField("description") .withValueField("value") ) );
ContainerDataItems
ContainerDataItems is used to assign a CollectionContainer to a Chart component. This approach requires an existing entity that will represent your chart data.
Suppose we have a data container that loads VehicleCount instances. Below is the fragment of the view XML descriptor:
<collection id="vehiclesDc"
            class="com.company.demo.entity.VehicleCount">
    <fetchPlan extends="_local"/>
    <loader id="vehiclesDl" readOnly="true">
        <query>
            <![CDATA[select e from VehicleCount e order by e.year]]>
        </query>
    </loader>
</collection>
The view controller defines an onInit() method that sets a data provider for the chart. The data provider is based on the vehiclesDc data container.
chart.setDataSet(
        new DataSet().withSource(
                new DataSet.Source<EntityDataItem>()
                        .withDataProvider(new ContainerChartItems<>(vehiclesDc))
                        .withCategoryField("year")
                        .withValueFields("cars", "motorcycles", "bicycles")
        )
);
To bind data declaratively, use the dataSet
element in your XML descriptor file to set the defined dataContainer as your data source.
<charts:dataSet>
    <charts:source dataContainer="vehiclesDc"
                   categoryField="year"
                   valueFields="cars motorcycles bicycles"/>
</charts:dataSet>
GaugeSeries Data Binding
Unlike other chart types, gauge charts don’t support DataSet.
To add data into the gauge chart, define a dataItem element inside the chart’s series.data in the chart’s XML descriptor as follows.
<charts:series>
    <charts:gauge id="gaugeSeries" name="Pressure">
        <charts:data>
            <charts:dataItem value="50" name="SCORE"/>
        </charts:data>
    </charts:gauge>
</charts:series>
Or get the series attribute in your Java controller, and use the setData() method to bind data programmatically.
GaugeSeries gaugeSeries = chart.getSeries("gaugeSeries");

gaugeSeries.setData(
        new GaugeSeries.DataItem()
                .withValue(50.0).withName("SCORE")
);
The DataItem object used for gauge chart data binding is distinct from DataItem mentioned in other chart data binding contexts.
|
