SerialChart
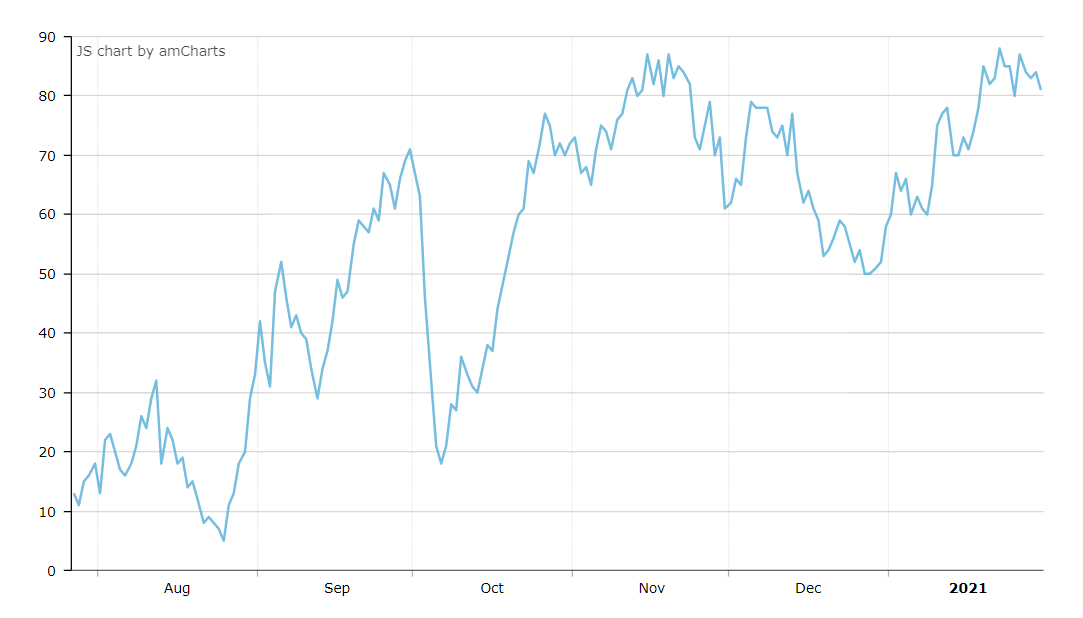
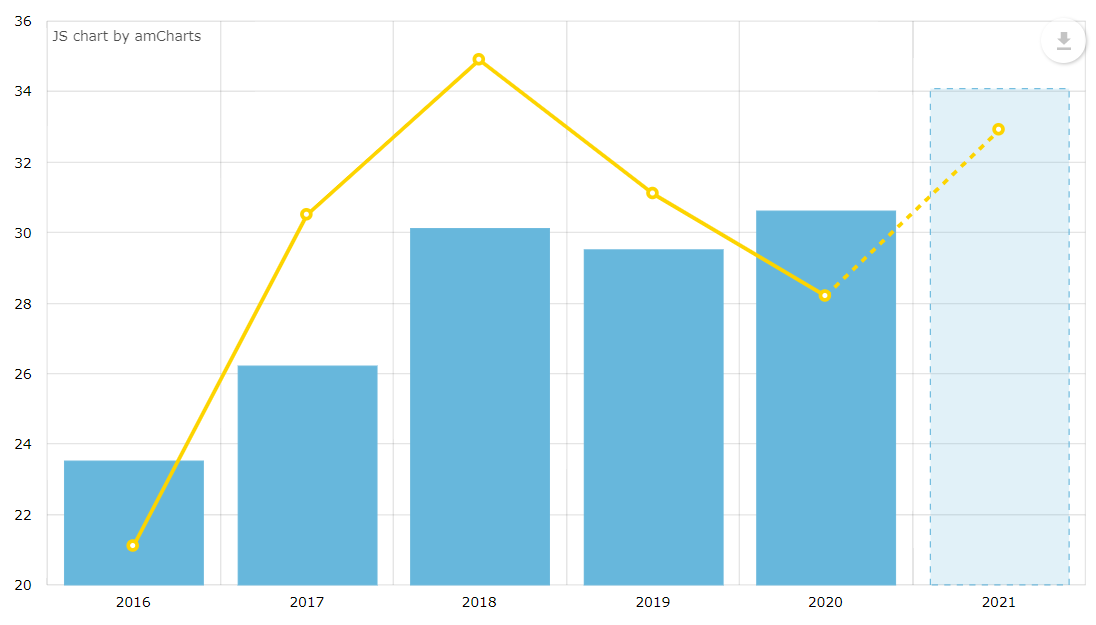
The SerialChart component allows you to create line, area, column, bar, step line, smoothed line, candlestick, and OHLC charts. The charts support multiple axes with simple or logarithmic scales. The data points can be displayed at equal/irregular intervals or on a timeline basis.
Component’s XML name: chart:serialChart.
Data Binding
You can assign a CollectionContainer to the chart and then define the categoryField attribute for the serialChart element and valueField attribute for the nested graph element:
<chart:serialChart id="lineChart"
autoMarginOffset="20"
categoryField="date"
dataContainer="dateValueDc"
height="100%"
marginRight="40"
marginLeft="40"
mouseWheelZoomEnabled="true"
theme="LIGHT"
width="100%">
<chart:graphs>
<chart:graph id="g1"
bullet="ROUND"
bulletBorderAlpha="1"
bulletColor="WHITE"
bulletSize="5"
hideBulletsCount="50"
lineThickness="2"
title="Red line"
useLineColorForBulletBorder="true"
valueField="value"
balloonText="<span style='font-size:18px;'>[[value]]</span>">
<chart:balloon adjustBorderColor="false"
color="WHITE"
drop="true"/>
</chart:graph>
</chart:graphs>
<chart:categoryAxis dashLength="1"
minorGridEnabled="true"/>
</chart:serialChart>Events and Handlers
|
To generate a handler stub in Jmix Studio, select the component in the screen descriptor XML or in the Component Hierarchy panel and use the Handlers tab of the Component Inspector panel. Alternatively, you can use the Generate Handler button in the top panel of the screen controller. |
For more details, see AmCharts documentation.
