Report Generation
The Jmix Reports add-on allows developers to create dynamic, data-driven reports directly within Jmix applications, supporting a variety of templates and output formats.
This guide demonstrates the add-on’s core functionality through practical examples in a sample CRM application, showcasing report design at both design-time (via Java annotations) and runtime (via database-stored definitions editable in the UI).
You’ll learn how to structure reports with bands and datasets, handle input parameters and validations, integrate charts and cross-tabs, and embed report actions into application views.
Requirements
To effectively use this guide, you will need the following:
-
Setup the development environment.
-
Clone the sample project and switch to
release_2_7branch:git clone https://github.com/jmix-framework/jmix-reports-sample cd jmix-reports-sample git checkout release_2_7
Application Overview
The example application used in this guide is a simple CRM system with the data model illustrated by the following diagram:

-
Client- represents customers with the main information and a collection of contacts. TheClientTypeenumeration defines classification categories for clients. -
Contact- stores customer contact details. -
Order- customer orders with status tracking. TheOrderStatusenumeration defines values for order lifecycle management. -
Invoice- billing documents associated with orders. TheInvoiceStatusenumeration defines status values for invoice processing. -
Payment- payment records.
The main purpose of the application is to show how to develop and run various types of reports, so it doesn’t contain any specific business logic.
Let’s explore the application features.
Open the project in your IDE with the Jmix Studio plugin installed. Run the application using the Jmix-reports-sample Jmix Application run/debug configuration. Go to http://localhost:8080 in your web browser and log in as admin with admin password.
The demo data includes the users alice, bob, and others. All of them have the password 1.
You can open the Clients, Orders, Invoices, Payments and Users views to see demo data automatically generated on first launch.
Click Reports → Reports in the main menu. You will see the list of all reports available in the application.
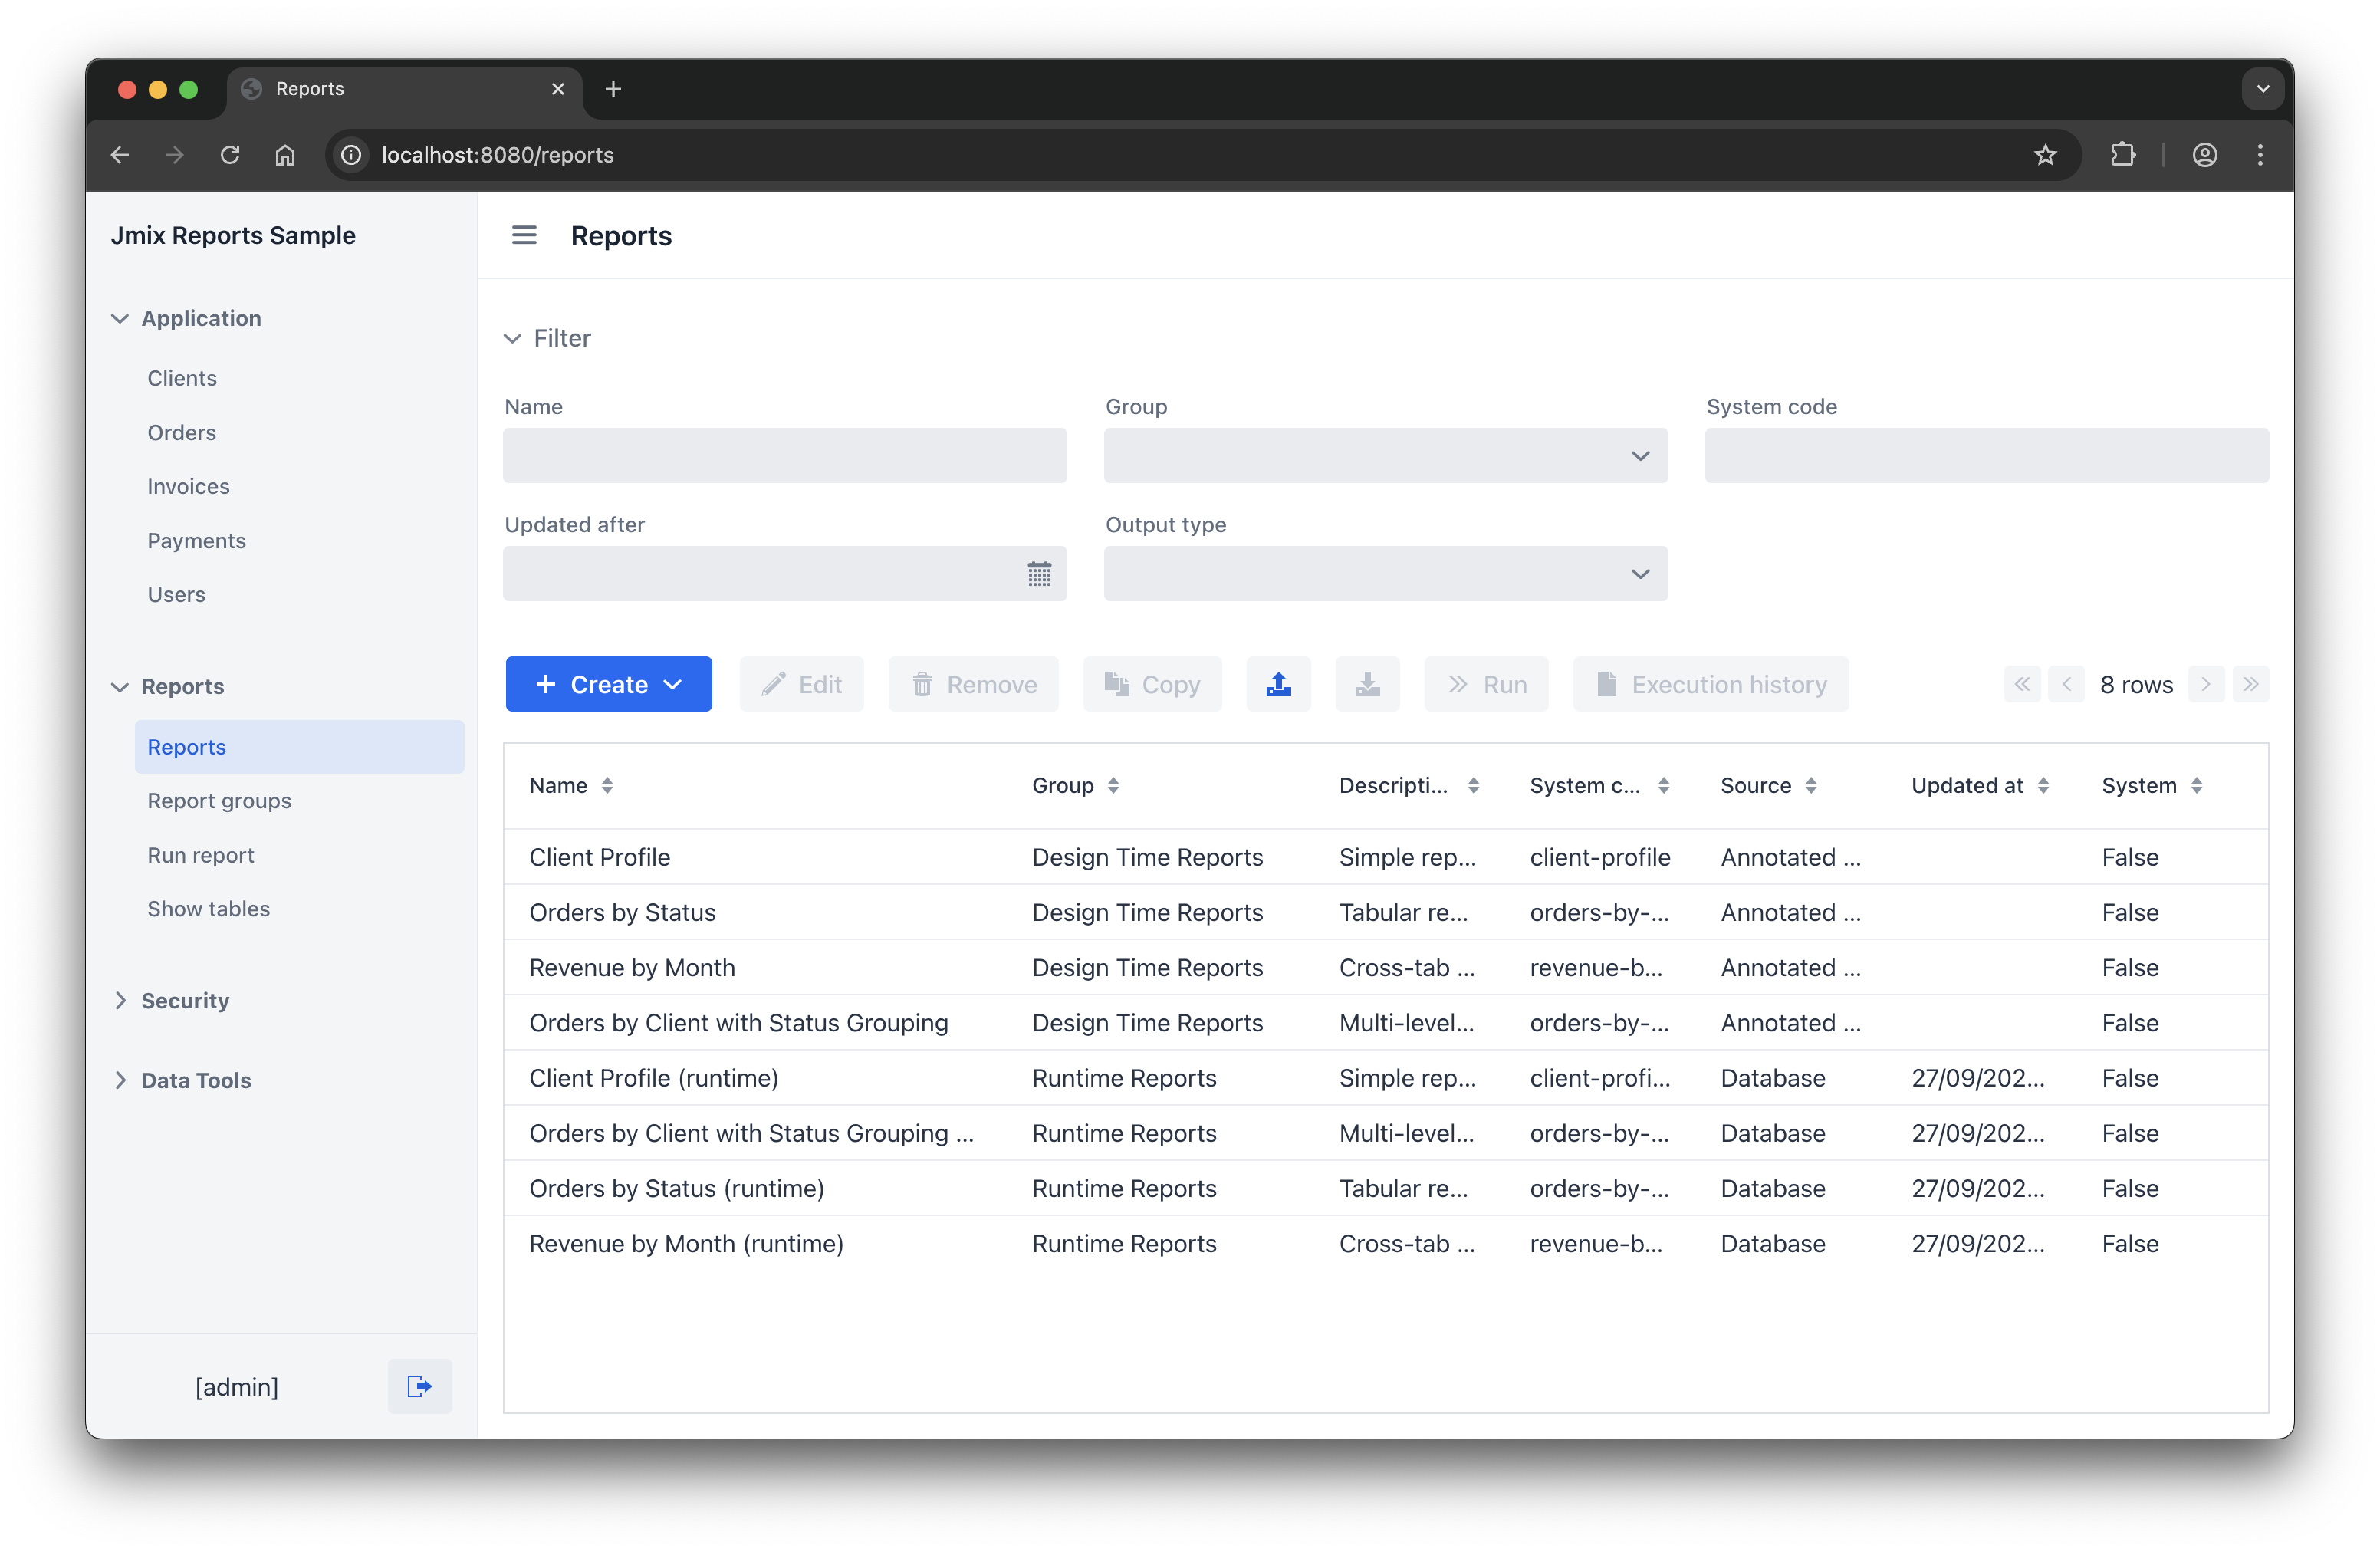
Reports in the Design Time Reports group are defined in the application code and cannot be edited at runtime.
Reports in the Runtime Reports group duplicate the design-time reports. They use the same templates and produce identical results. The only difference is that their structure and template content are stored in the database, so you can explore and edit them in the running application by clicking Edit.
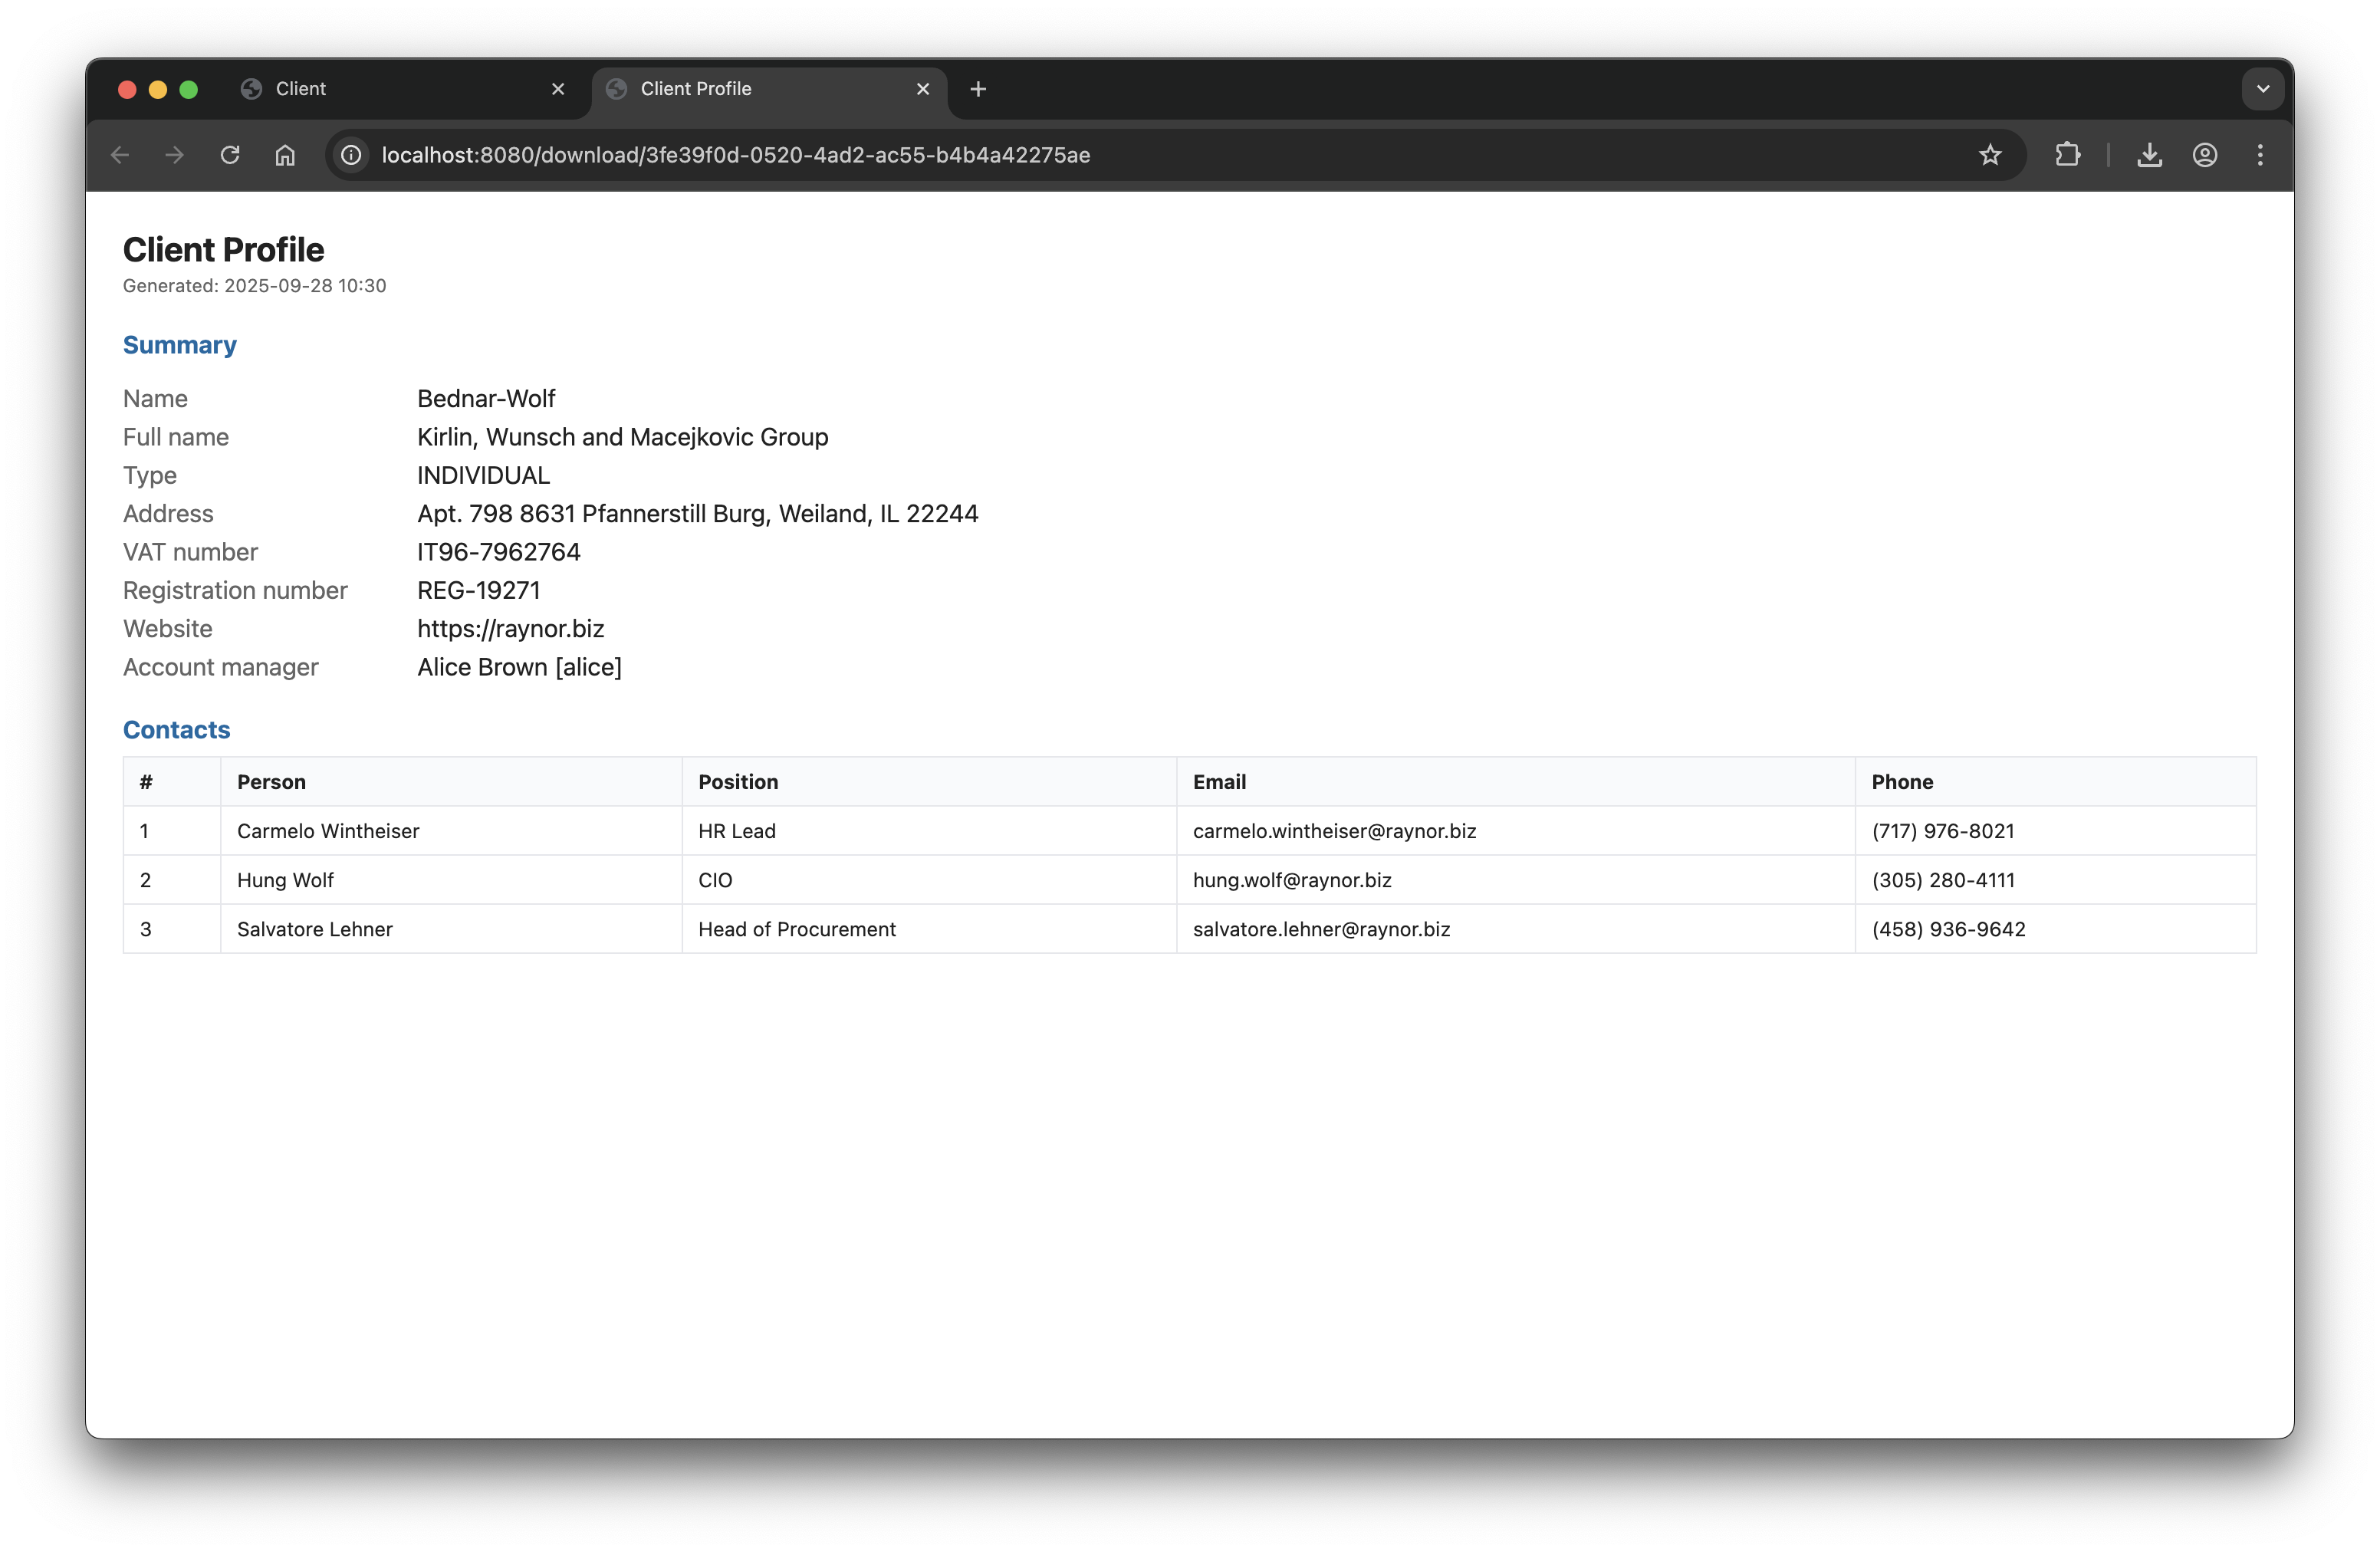
Client Profile Report
This report provides complete information about a client, including the list of contacts. It has a master-detail structure and offers multiple templates and output formats.
Running from Report Designer
Select the Client Profile report in the data grid and click the Run button.
The Input parameters dialog allows you to choose a template and select a client entity for which you want to generate the report.
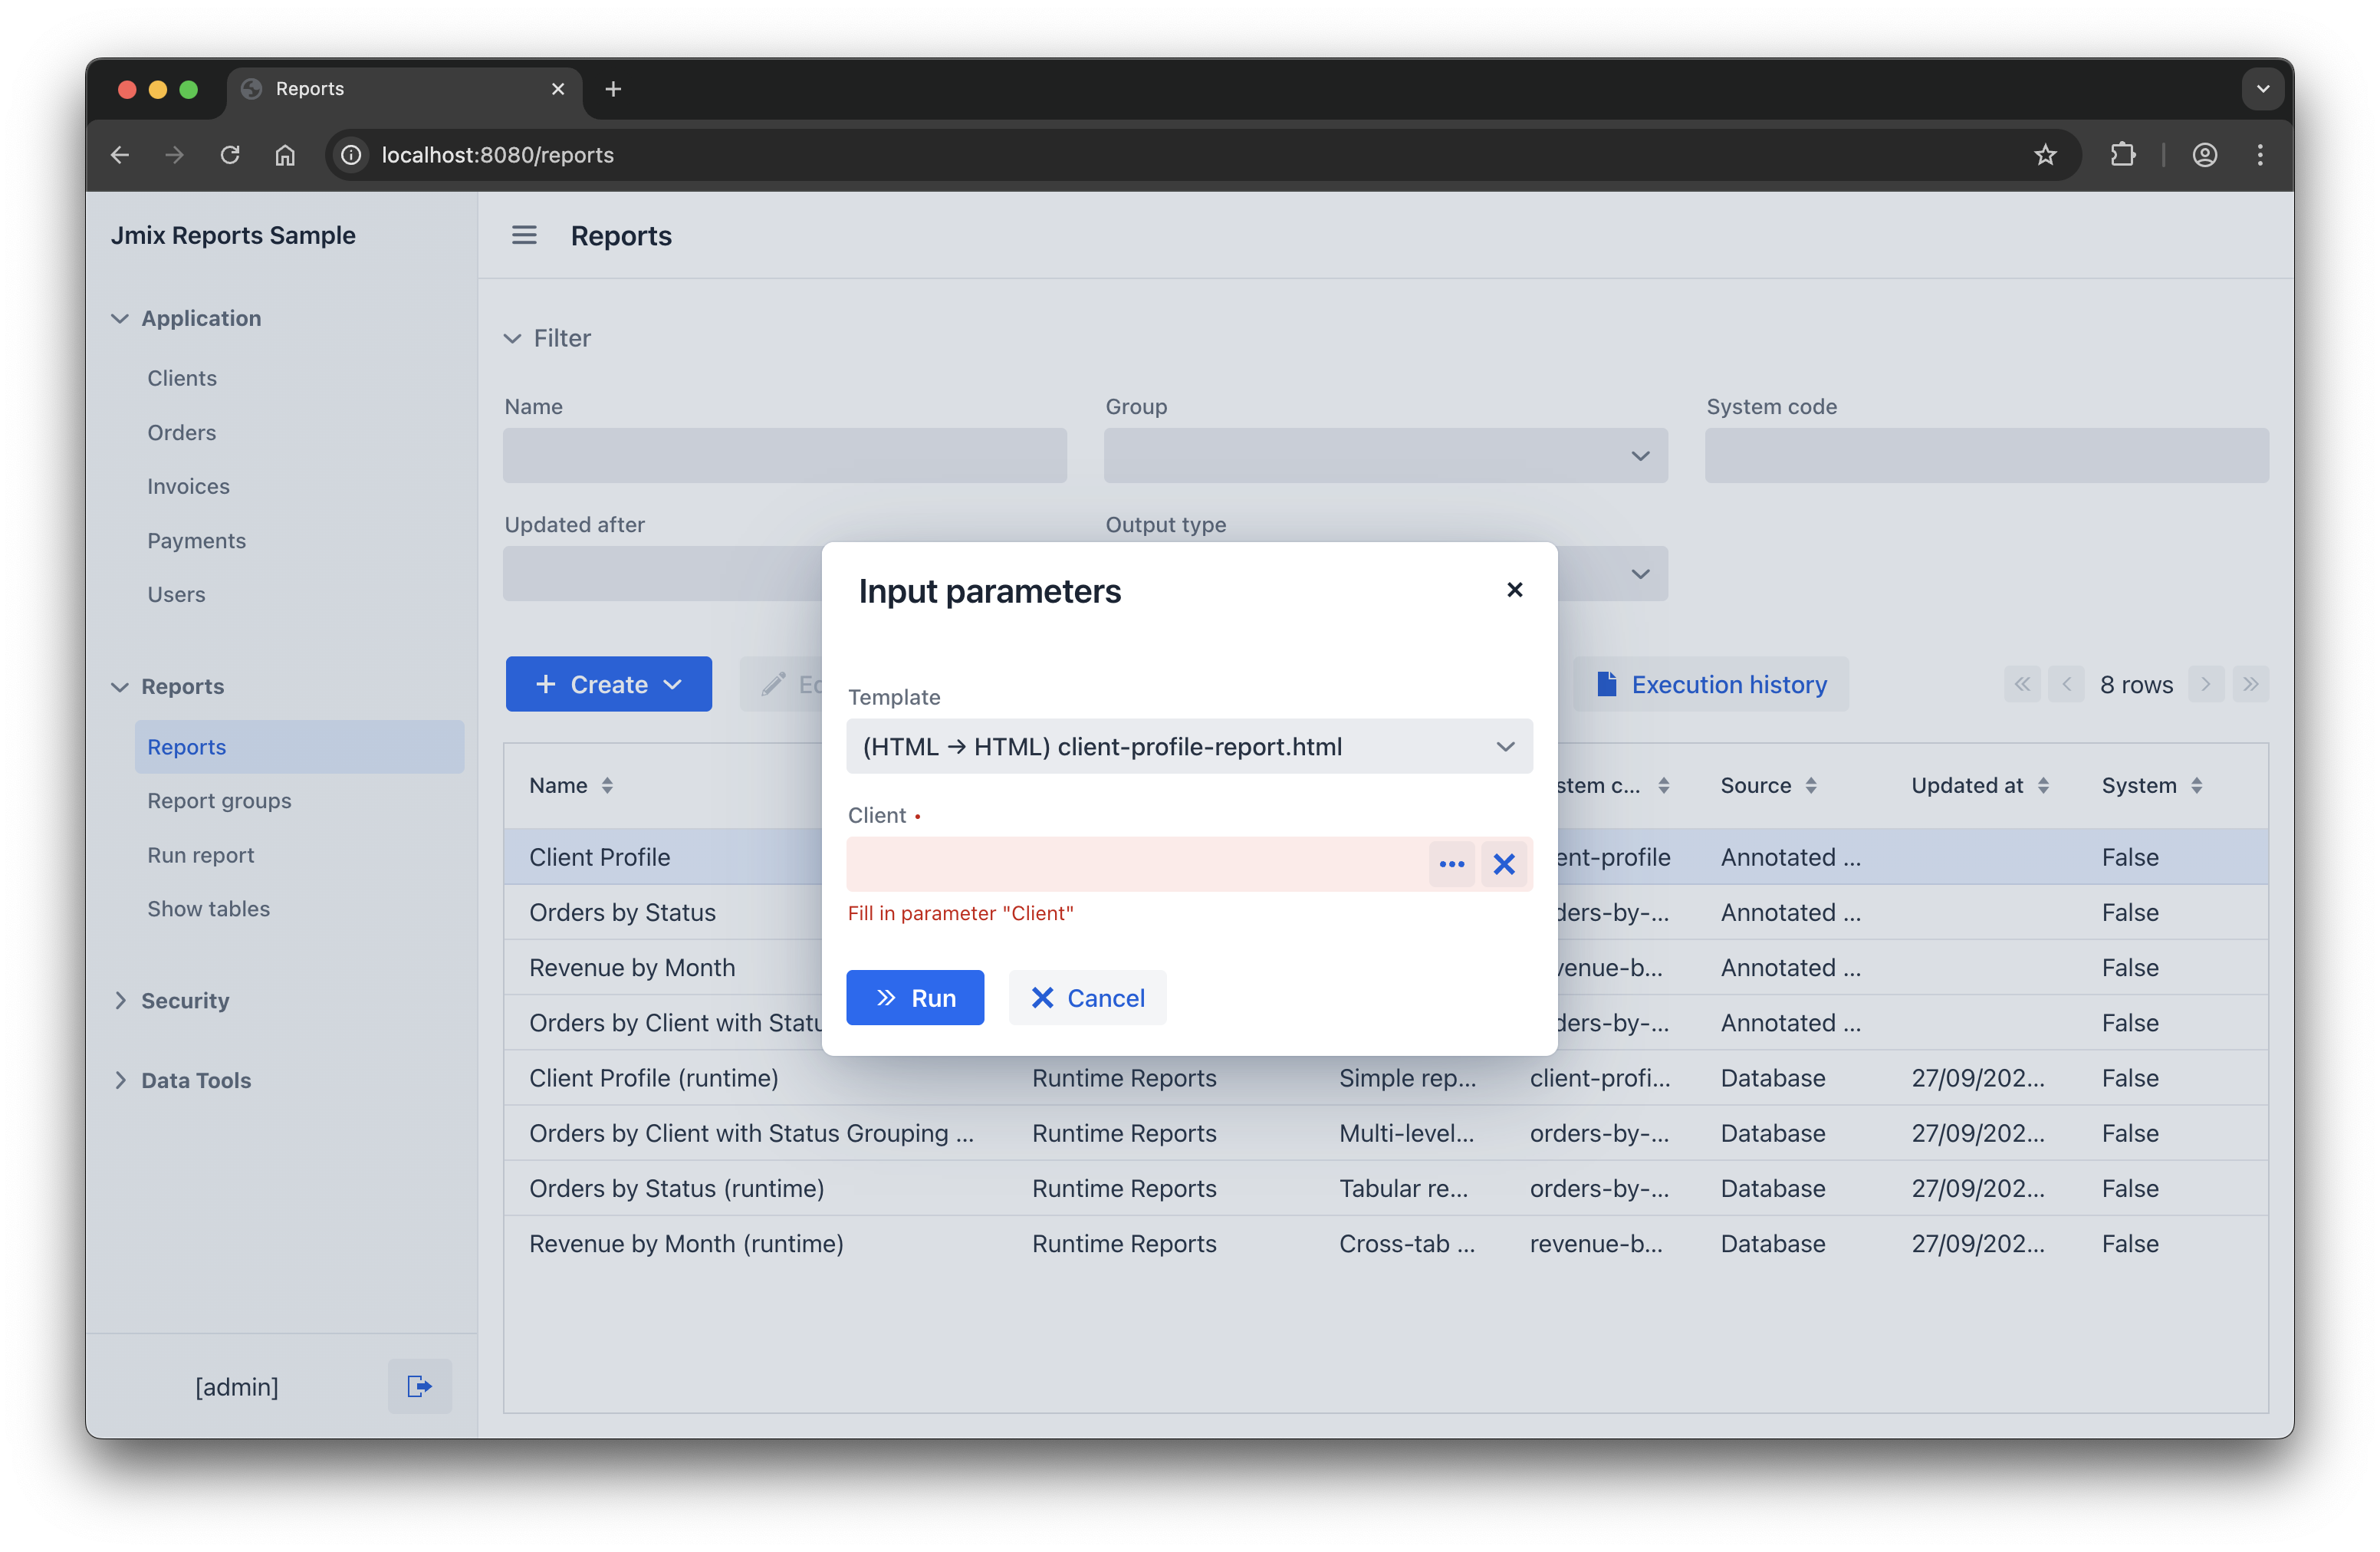
The template defines both the source template file and the output type. For example, you can have a DOCX template and output the resulting report as a PDF file.
Select one of the templates and a client and click Run. The application will generate the report and either open the result in a new browser tab or download it as a file, depending on the output type.
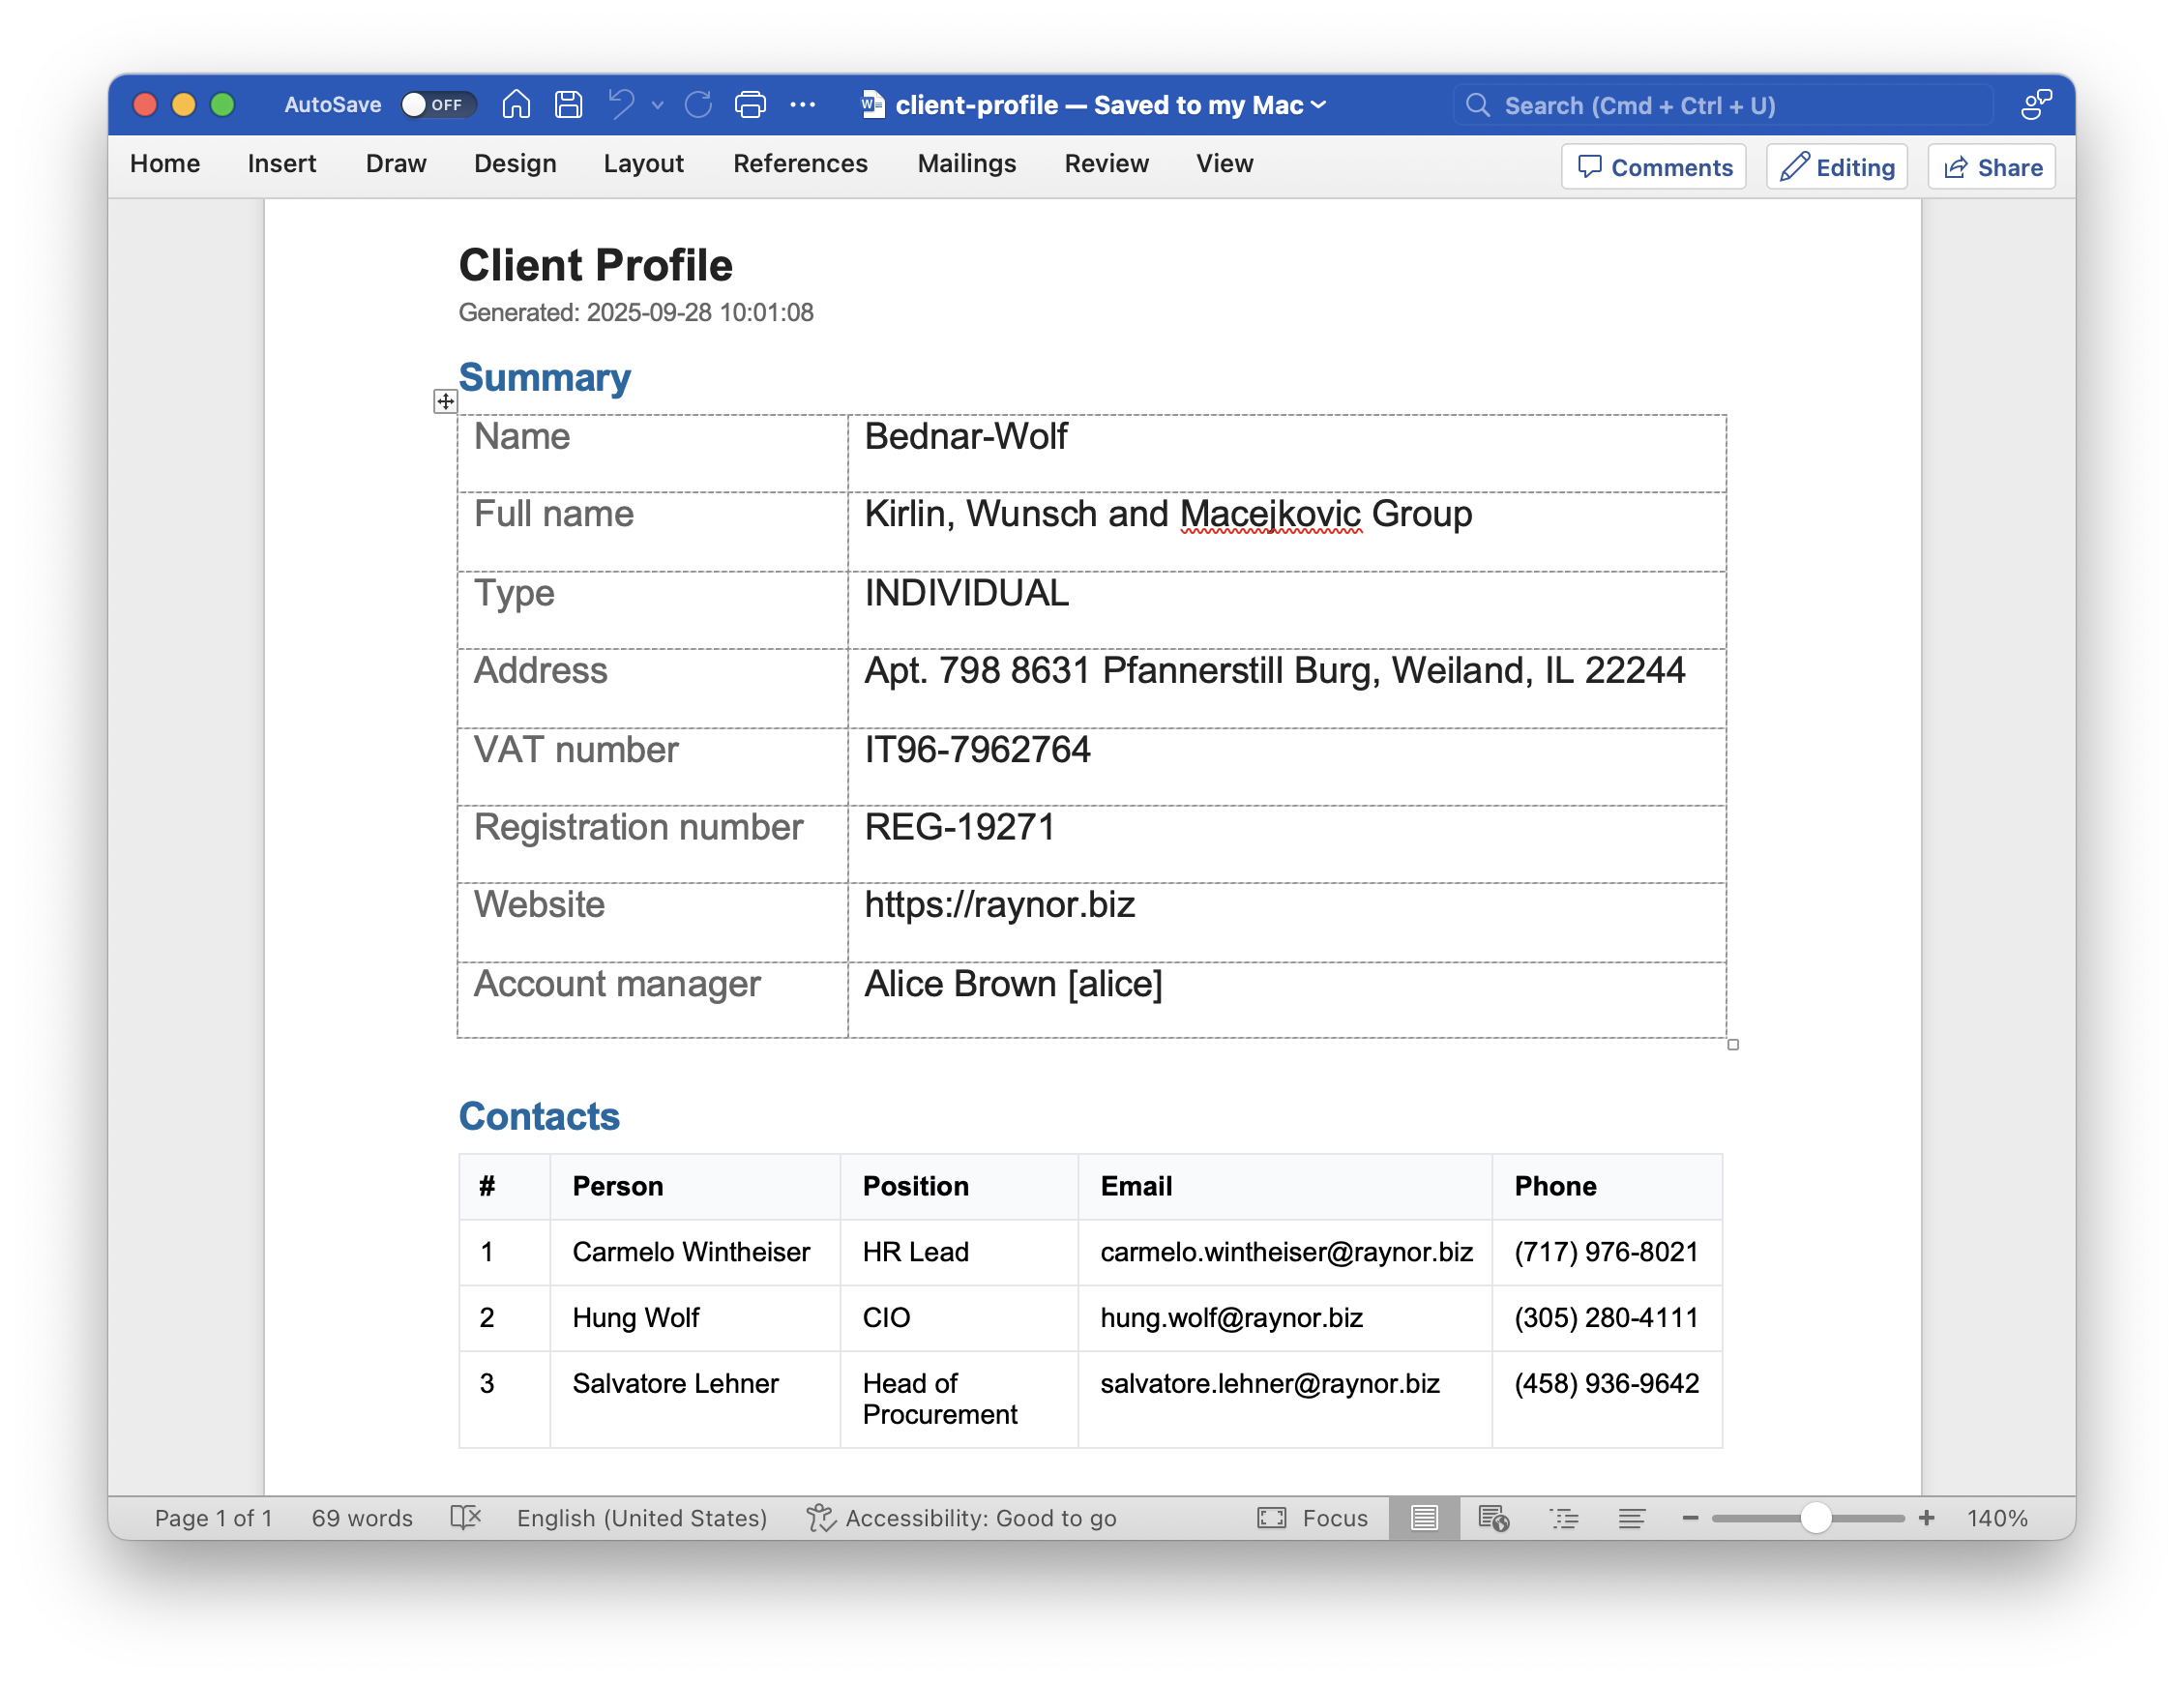
For example, this is how the report result looks in the DOCX format:
Running from Application Views
Users can run the Client Profile report from the Reports → Run report view and some other application views as well.
Log out from the application and log in as bob with password 1. You now have limited access defined by the Employee role. This role grants permissions on the Reports → Run report view and list and detail views of the Client entity.
If you open the Reports → Run report view, you will see only the Client Profile report and its runtime clone.
Open the Clients list view. Select a client in the data grid, click Reports dropdown and then select Reports for entity:
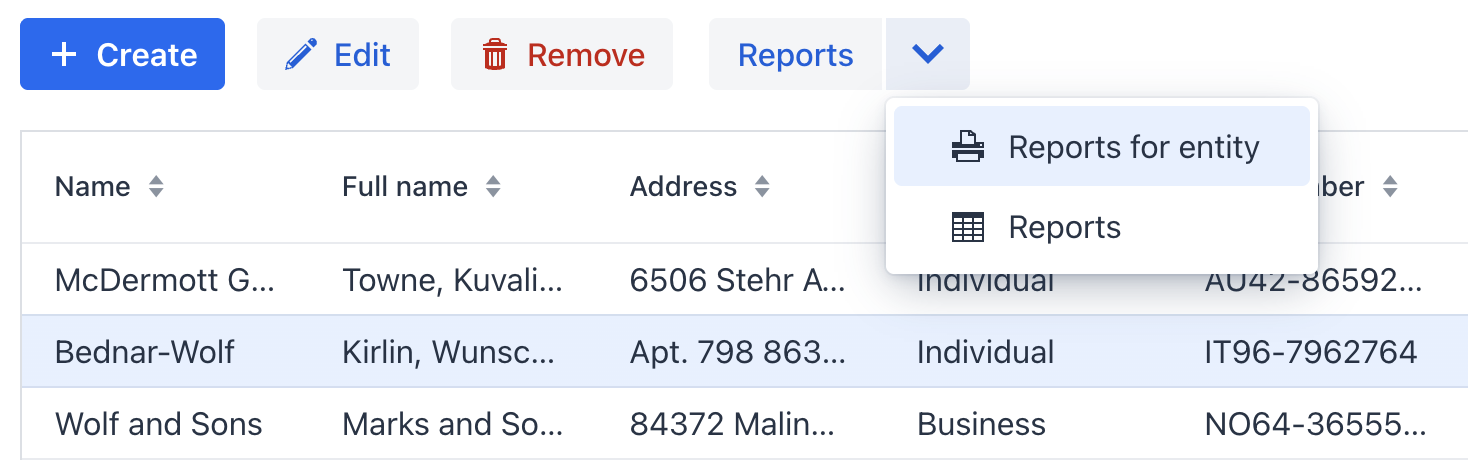
The Client field of the Input parameters dialog will be set to the client selected in the data grid.
If you open the client detail view, you will see two additional buttons at the bottom: Reports for entity and Print client profile:

The Reports for entity button allows you to select a template and a client the same as in the list view. The Print client profile button just prints the report right away for the edited entity using the HTML template and HTML output:
Report Structure
The Client Profile report has the following band structure:
 Root
  ├── Client
  └── Contacts
The Client band is printed once. The Contacts band is repeated for every contact.
HTML Template
One of the Client Profile report templates is written in HTML. You can download the whole file from GitHub.
The template is a standard HTML file with added Freemarker directives to populate with data when the report is executed.
Let’s consider the template body:
<h1>Client Profile</h1>
<div class="subtitle">Generated: ${.now?string("yyyy-MM-dd HH:mm")}</div> (1)

<#assign Client = Root.bands.Client[0]> (2)
<#assign Contacts = Root.bands.Contacts> (3)

<div class="section">
  <h2>Summary</h2>
  <dl class="kv">
    <dt>Name</dt><dd>${Client.fields.name!}</dd> (4)
    <dt>Full name</dt><dd>${Client.fields.fullName!}</dd>
    <dt>Type</dt><dd>${Client.fields.type!}</dd>
    <dt>Address</dt><dd>${Client.fields.address!}</dd>
    <dt>VAT number</dt><dd>${Client.fields.vatNumber!}</dd>
    <dt>Registration number</dt><dd>${Client.fields.regNumber!}</dd>
    <dt>Website</dt><dd>${Client.fields.website!}</dd>
    <dt>Account manager</dt><dd>${Client.fields.accountManager!}</dd>
  </dl>
</div>

<#if Contacts?has_content>
  <div class="section">
    <h2>Contacts</h2>
    <table>
      <thead>
        <tr>
          <th>#</th>
          <th>Person</th>
          <th>Position</th>
          <th>Email</th>
          <th>Phone</th>
        </tr>
      </thead>
      <tbody>
        <#list Contacts as c> (5)
          <tr>
            <td>${c?index + 1}</td> (6)
            <td>${c.fields.person!}</td> (7)
            <td>${c.fields.position!}</td>
            <td>${c.fields.email!}</td>
            <td>${c.fields.phone!}</td>
          </tr>
        </#list>
      </tbody>
    </table>
  </div>
</#if>| 1 | Using the Freemarker special variable .now to print the current timestamp. |
| 2 | Assigning the first row of the Client band to the Client variable. |
| 3 | Assigning the rows of the Contacts band to the Contacts variable. |
| 4 | Printing the Client fields. |
| 5 | Iterating over the Contacts list. |
| 6 | Using the Freemarker loop variable to print the item number. |
| 7 | Printing the Contacts fields. |
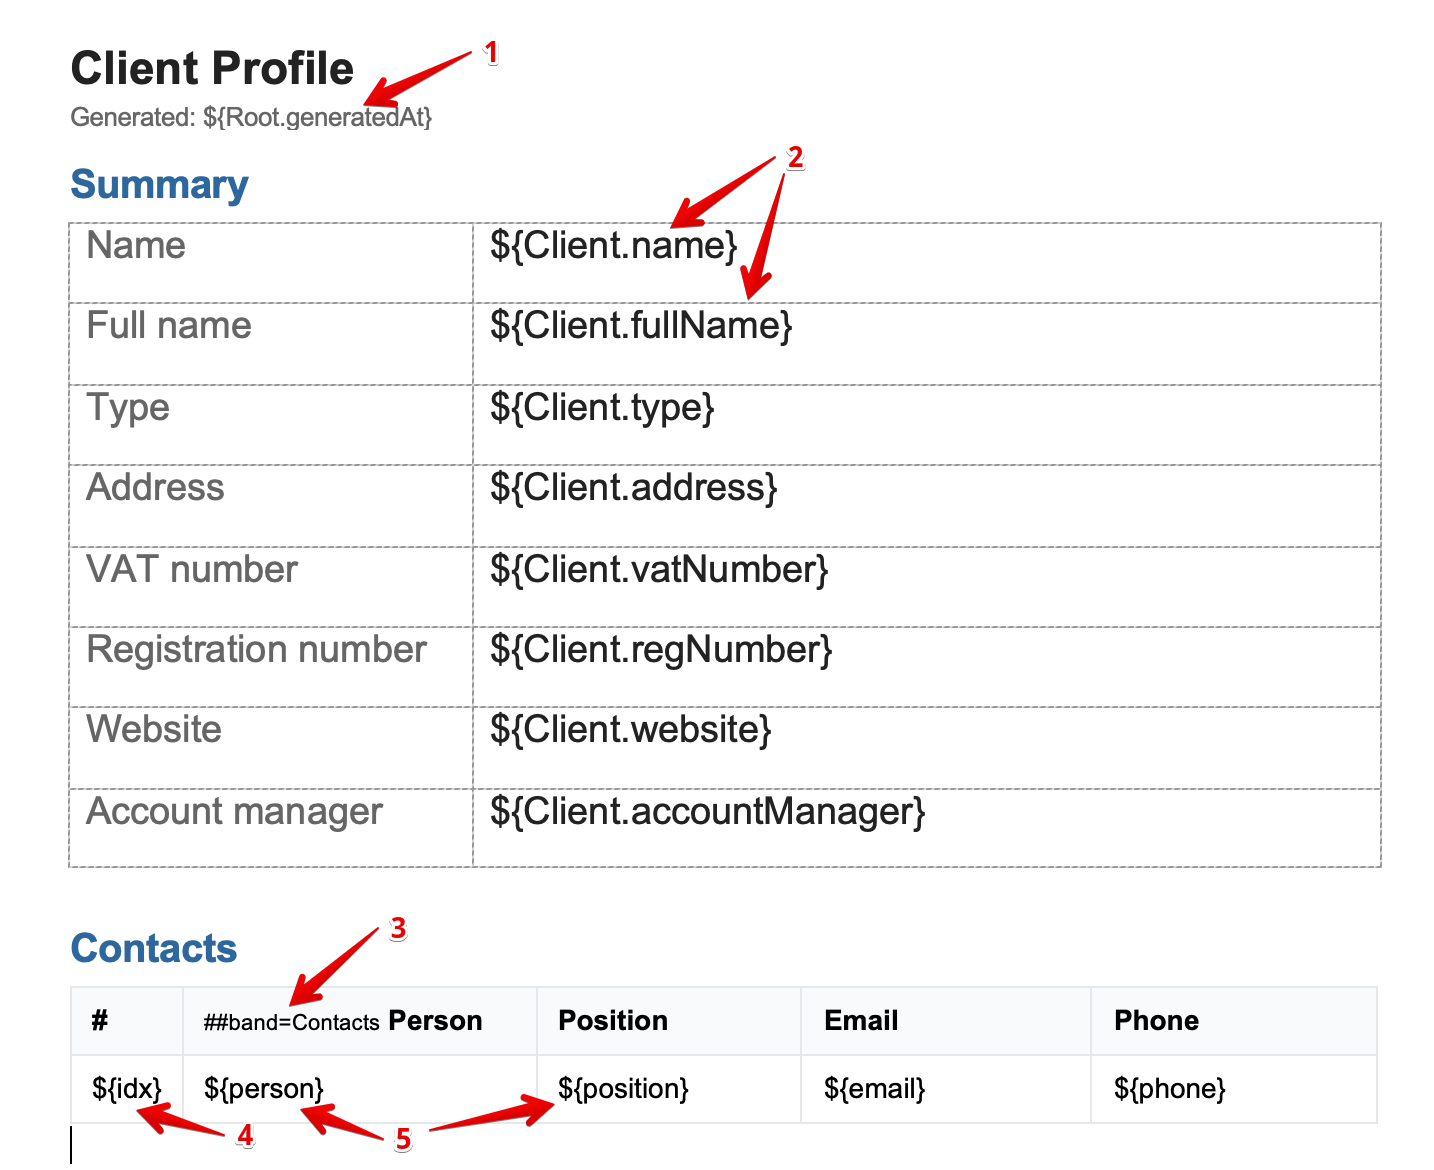
DOCX Template
Another Client Profile report template is a DOCX file. You can download it from GitHub.
The DOCX template is populated with data using the ${band_name.field_name} placeholders and defining band names in the tables.
-
The report timestamp is printed as a regular field of the
Rootband. -
Printing the
Clientband fields. -
The
##band==<band_name>directive in a table cell defines a band for the table. -
The item number is printed as a regular field of the
Contactsband. -
Printing the
Contactsband fields.
JRXML Template
The JRXML template of the Client Profile report is rendered using JasperReports library to produce a PDF file. You can download the template from GitHub.
Design-Time Definition
The Client Profile report structure is defined by the com.company.crm.report.ClientProfileReport class.
Below we describe the key elements of the class, its annotations and methods.
@ReportDef
The @ReportDef annotation is a mandatory element of a report definition:
@ReportDef(
        code = "client-profile", (1)
        group = DesignTimeReportsGroup.class, (2)
        name = "Client Profile", (3)
        description = "Simple report with different templates and output formats" (4)
)
public class ClientProfileReport {
}| 1 | Report code is used to identify the report when running it through the API. |
| 2 | Report group definition class. |
| 3 | Report name and description to display in UI. |
The @ReportDef annotation is itself annotated with Spring’s @Component, so the report definition class becomes a singleton bean.
@AvailableForRoles and @AvailableInViews
The @AvailableForRoles and @AvailableInViews specify the user roles that are permitted to run the report and indicate the views in which the report generation actions will show the report:
@AvailableForRoles(
        roleClasses = {FullAccessRole.class, EmployeeRole.class, ManagerRole.class}
)
@AvailableInViews(
        viewClasses = {ClientDetailView.class, ClientListView.class}
)
public class ClientProfileReport {
}
@TemplateDef
The @TemplateDef annotation defines the report template:
@TemplateDef(
        isDefault = true, (1)
        code = "HTML → HTML", (2)
        filePath = "com/company/crm/report/client-profile-report.html", (3)
        outputType = ReportOutputType.HTML, (4)
        outputNamePattern = "client-profile.html", (5)
        templateEngine = TemplateMarkupEngine.FREEMARKER (6)
)
public class ClientProfileReport {
}| 1 | Indicates that the template should be automatically used unless user explicitly specifies another one. |
| 2 | The unique template code is shown to the user and can be used when referring to the template in API. |
| 3 | Path to the template file starting from the resources root. |
| 4 | Type of the output content generated by the reporting engine. Output type should be consistent with the template file type. |
| 5 | Optional file name pattern which will be used to generate the output file name. |
| 6 | For HTML templates, defines the template engine to process the content. |
A report may contain multiple @TemplateDef annotations. When the report is executed, one template is either selected by the user or chosen automatically.
@InputParameterDef
The @InputParameterDef annotation defines an external parameter passed to the report:
@InputParameterDef(
        alias = "client", (1)
        name = "msg://com.company.crm.entity/Client", (2)
        type = ParameterType.ENTITY, (3)
        required = true, (4)
        entity = @EntityParameterDef(entityClass = Client.class) (5)
)
public class ClientProfileReport {
}| 1 | Unique alias to access parameter in datasets. |
| 2 | Human-readable parameter name. Can be a string or a reference to a localized message. |
| 3 | Data type of the parameter. |
| 4 | Whether the parameter is mandatory and must be entered by the user or passed through the API. |
| 5 | For ParameterType.ENTITY and ParameterType.ENTITY_LIST parameters, defines additional properties. |
A report may contain multiple @InputParameterDef annotations.
@BandDef and @DataSetDef
@BandDef(
        name = "Root", (1)
        root = true,
        dataSets = @DataSetDef( (2)
                name = "root", (3)
                type = DataSetType.DELEGATE (4)
        )
)

@BandDef(
        name = "Client",
        parent = "Root", (5)
        dataSets = @DataSetDef(name = "client", type = DataSetType.DELEGATE)
)

@BandDef(
        name = "Contacts",
        parent = "Root",
        dataSets = @DataSetDef(name = "contacts", type = DataSetType.DELEGATE)
)
public class ClientProfileReport {
}| 1 | The unique band name. Any report must include the band named Root with the annotation attribute root = true. |
| 2 | The dataSets attribute defines one or more datasets for this band using the @DataSetDef annotation. |
| 3 | The dataset name to refer from a delegate method. |
| 4 | Dataset type determines how the band data is obtained. DataSetType.DELEGATE means delegation to a ReportDataLoader object returned by a report class method. |
| 5 | The parent attribute specifies a parent band to define the report structure. |
Delegate Methods
The report class can contain delegate methods that are invoked by the report engine when running the report.
The most common delegates are used for loading data in band datasets. Methods of this kind are annotated with @DataSetDelegate:
public class ClientProfileReport {

    @Autowired
    private MetadataTools metadataTools;

    @DataSetDelegate(name = "client") (1)
    public ReportDataLoader clientDataLoader() { (2)
        return (reportQuery, parentBand, params) -> {
            Client client = (Client) params.get("client");
            Map<String, Object> fields = new HashMap<>();
            fields.put("name", client.getName());
            fields.put("fullName", client.getFullName());
            fields.put("type", client.getType().name());
            fields.put("address", client.getAddress());
            fields.put("vatNumber", client.getVatNumber());
            fields.put("regNumber", client.getRegNumber());
            fields.put("website", client.getWebsite());
            fields.put("accountManager", client.getAccountManager() == null ?
                    "" : metadataTools.getInstanceName(client.getAccountManager()));
            return List.of(fields);
        };
    }
}| 1 | The name attribute links the method to the dataset (client in this example). |
| 2 | The method returns the ReportDataLoader object and does not have any arguments. |
ReportDataLoader is a functional interface that accepts a parent band and external parameters map. It returns a list of fields that becomes the band content.
Runtime Definition
The sample project includes the copy of the Client Profile report, defined in the database. This "runtime" report produces the same result as the one defined at design time.
Run the application and open Reports → Reports view. Select Client Profile (runtime) in the list and click Edit. You will see the modifiable report properties defined on several tabs: Report details, Bands, Parameters, and so on.
The Bands tab defines the structure of bands and datasets:
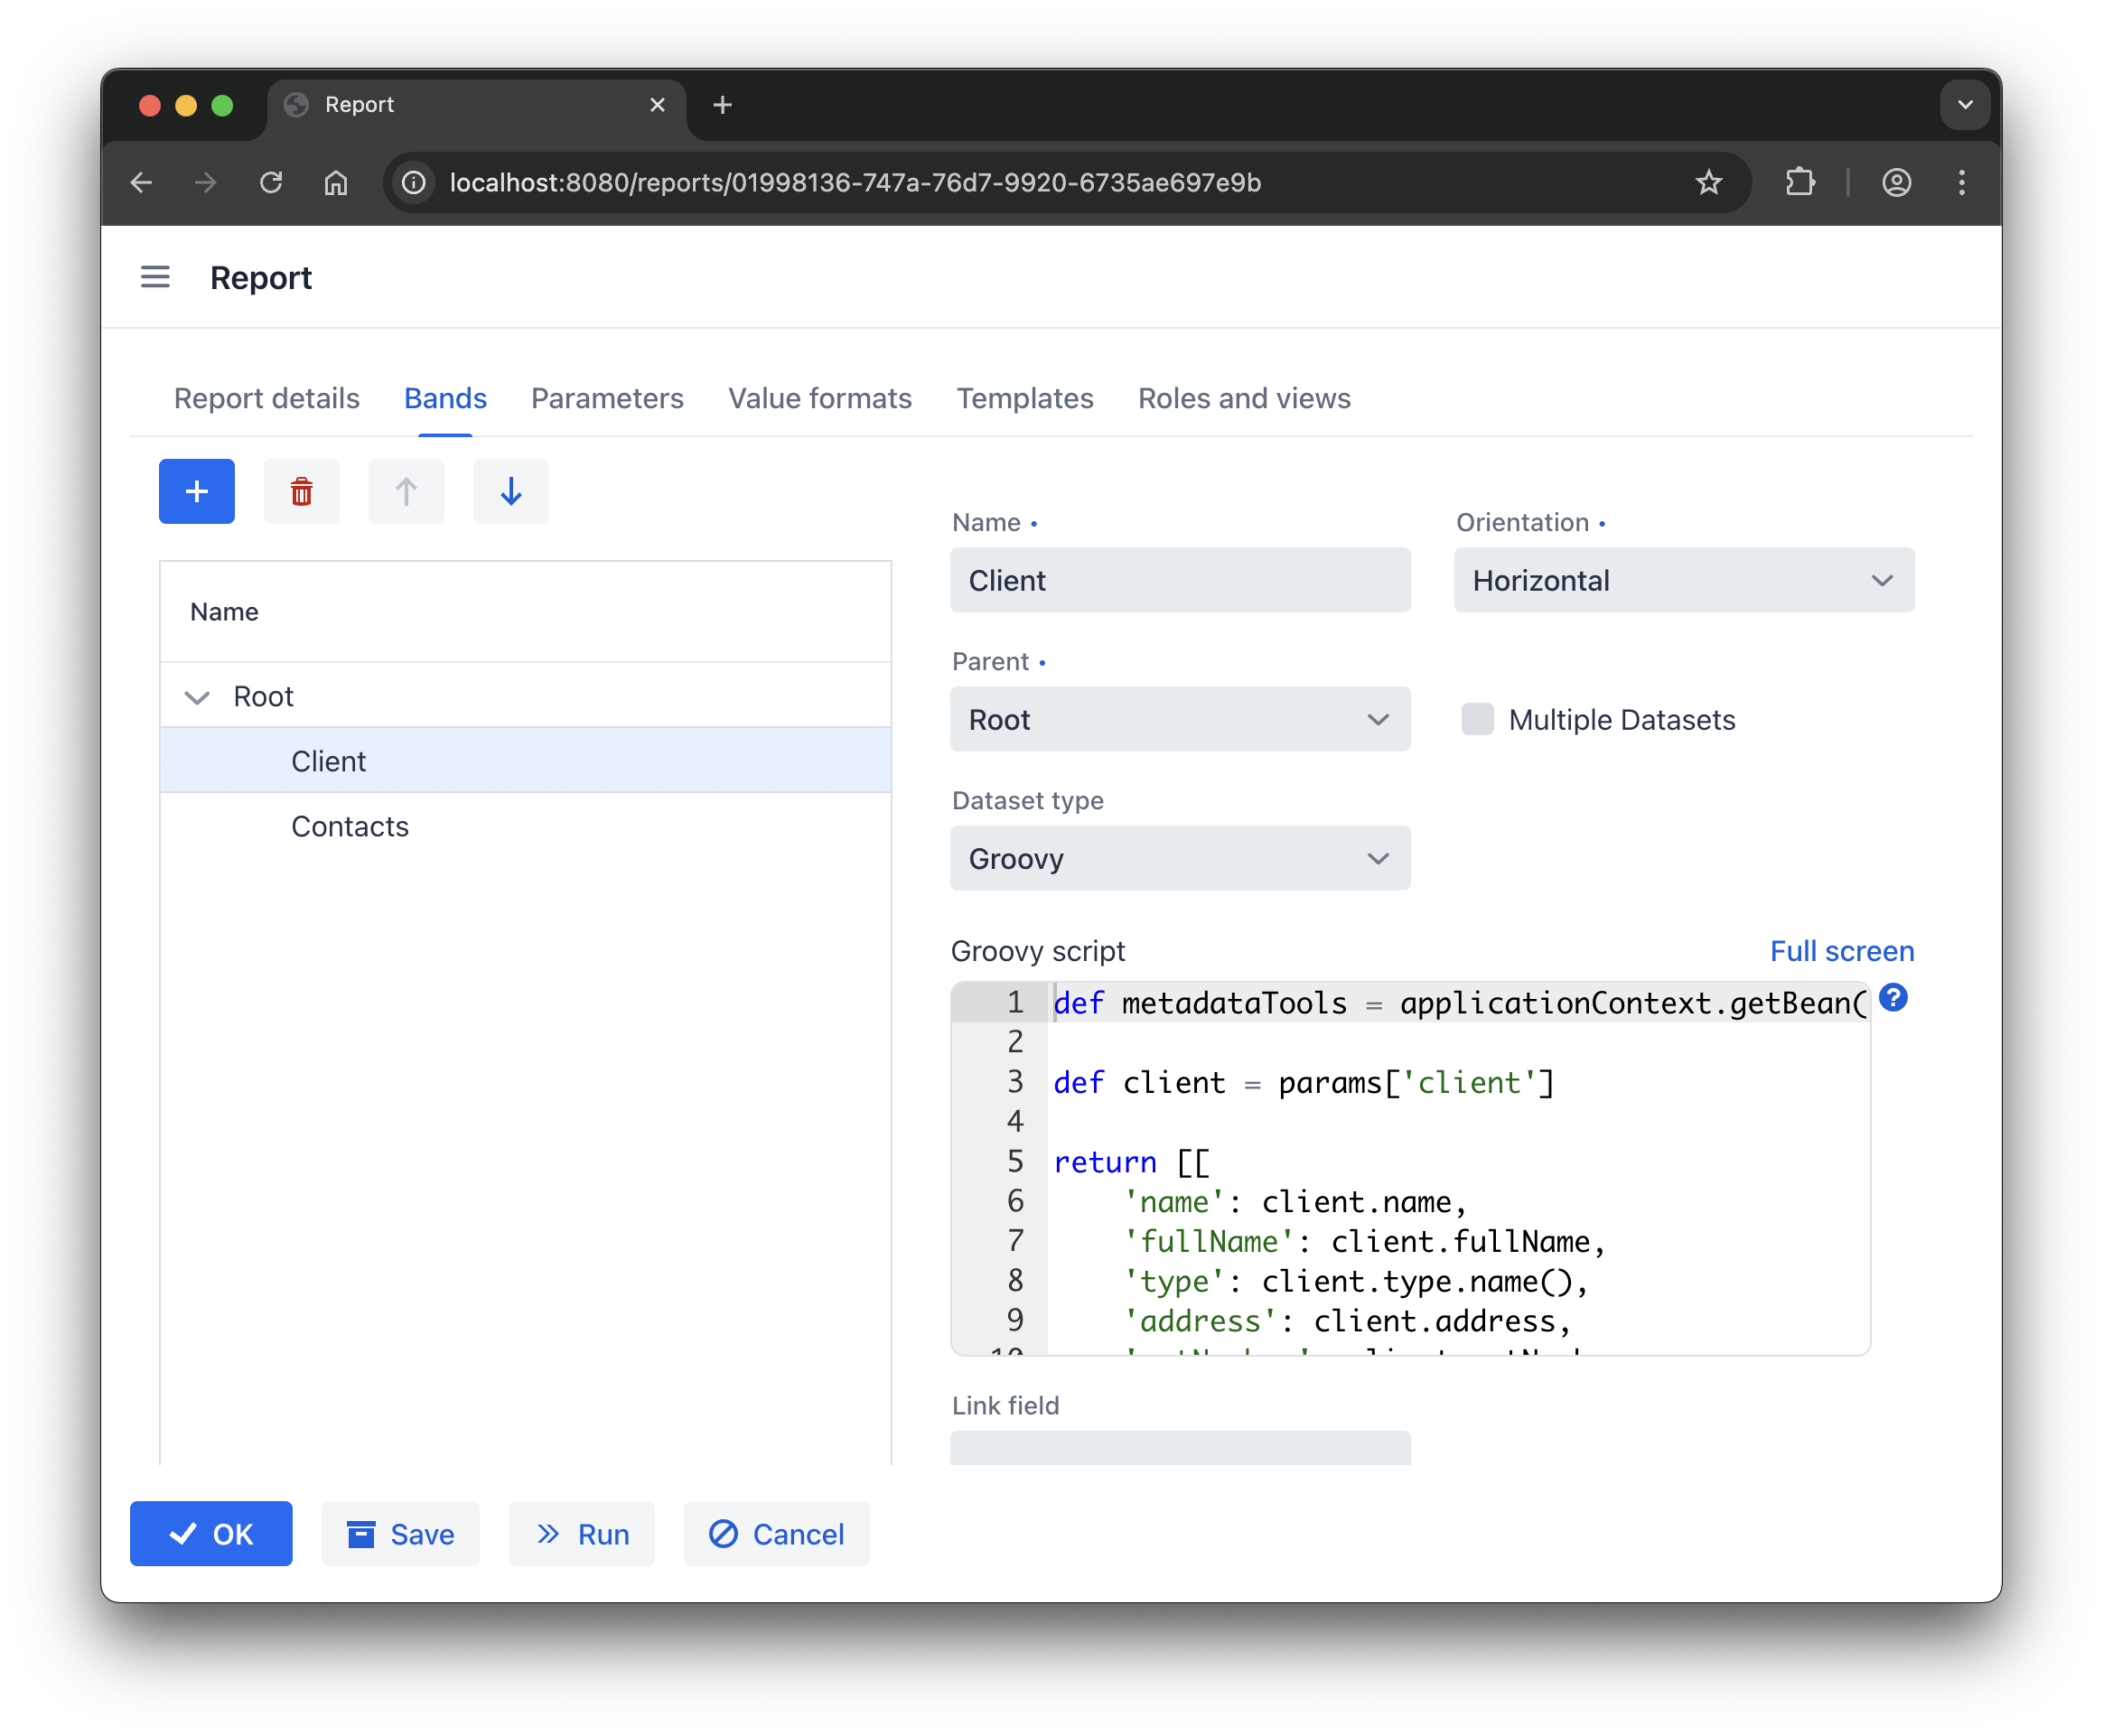
The same logic as that in the clientDataLoader() delegate is implemented here using the Groovy script:
def metadataTools = applicationContext.getBean(io.jmix.core.MetadataTools)

def client = params['client']

return [[
    'name': client.name,
    'fullName': client.fullName,
    'type': client.type.name(),
    'address': client.address,
    'vatNumber': client.vatNumber,
    'regNumber': client.regNumber,
    'website': client.website,
    'accountManager': client.accountManager ? metadataTools.getInstanceName(client.accountManager) : ''
    ]]
Templates are listed on the Templates tab:
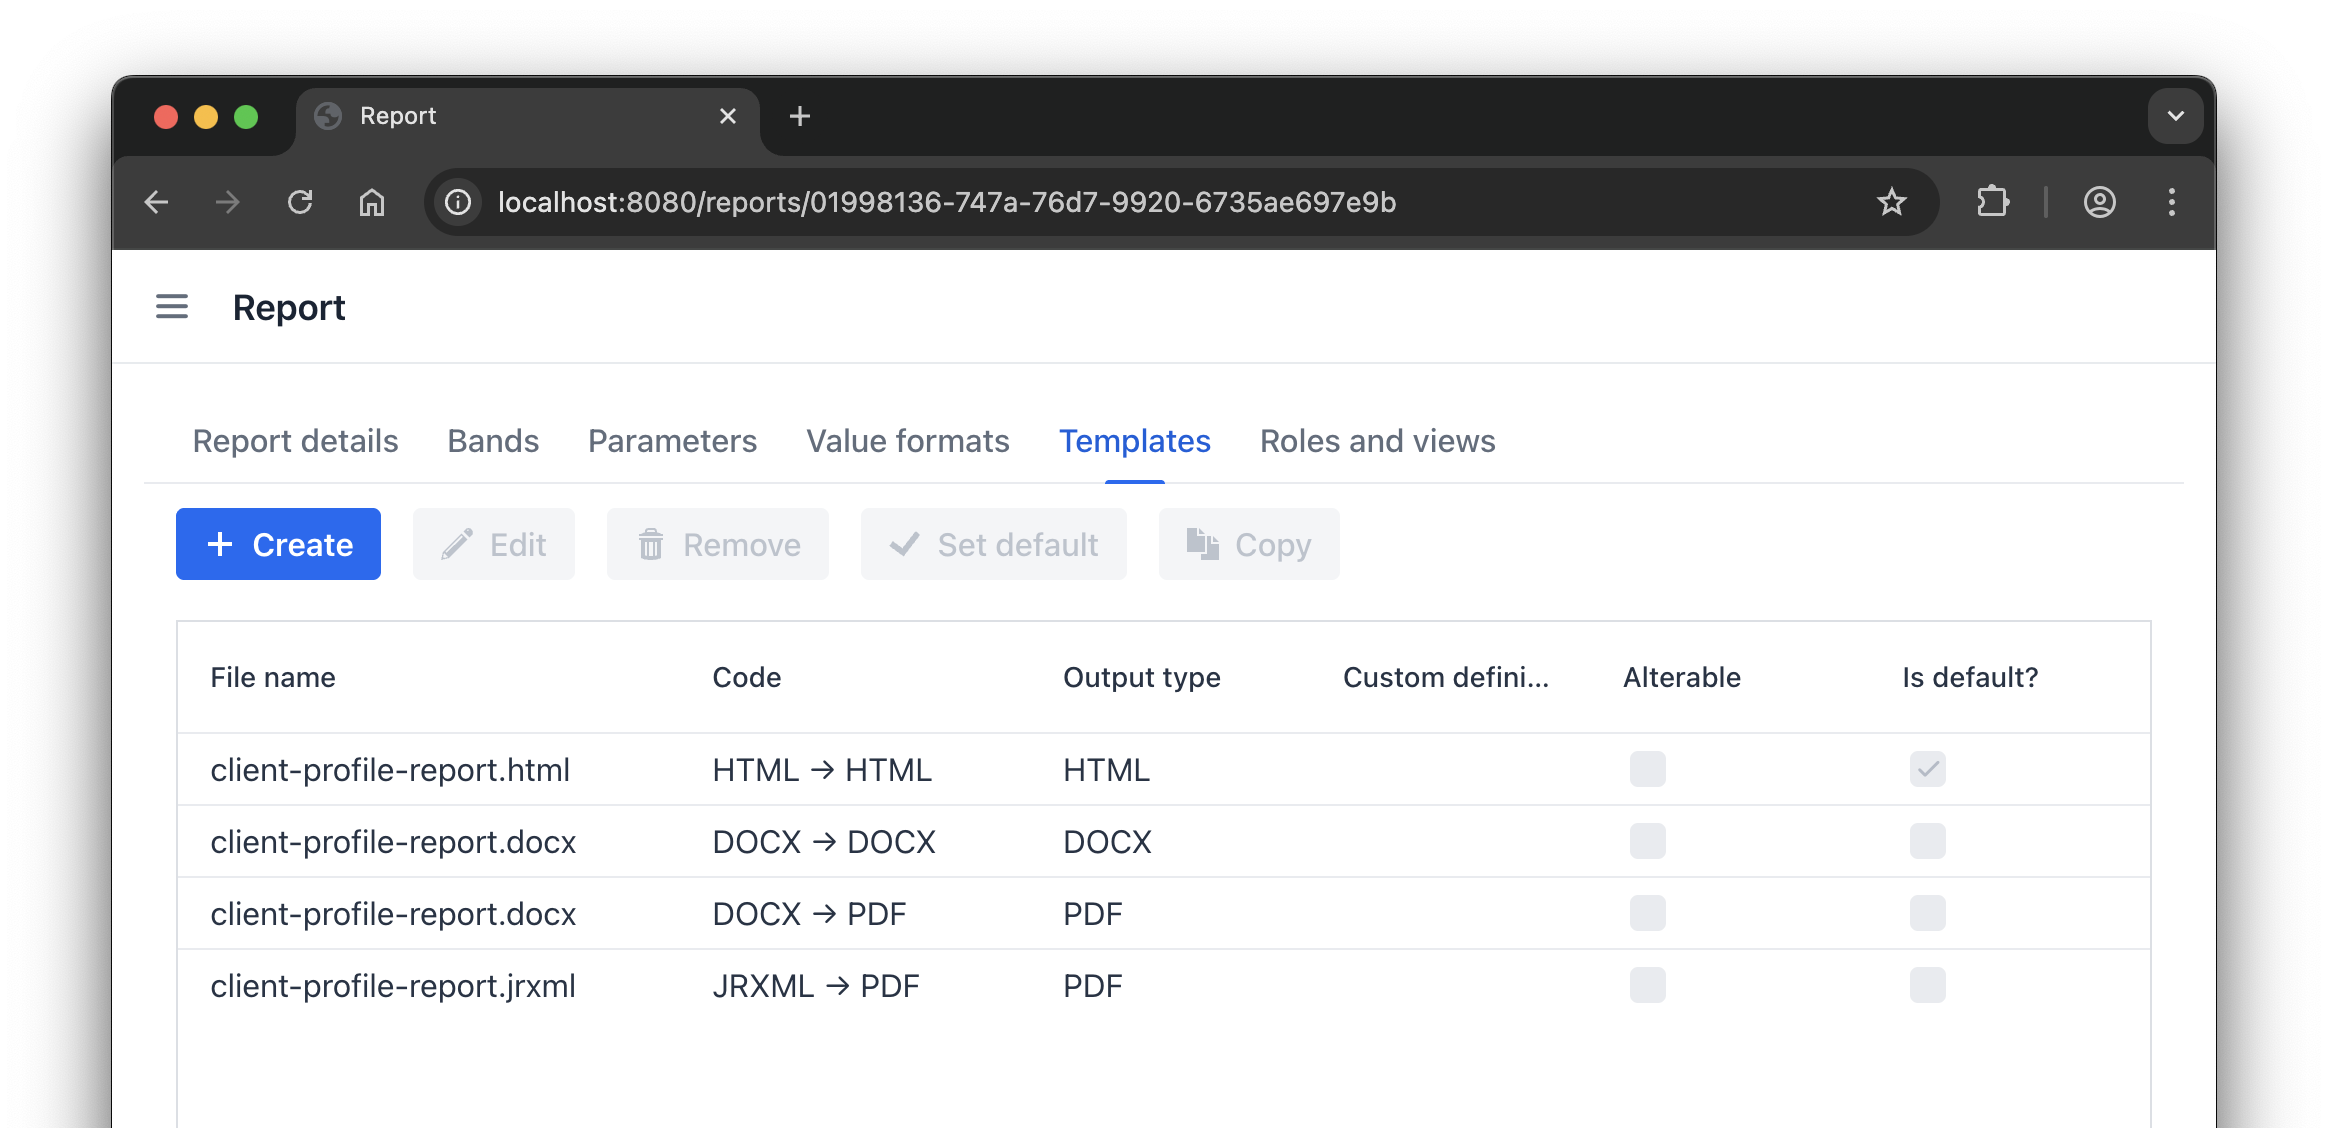
In runtime reports, templates are uploaded to the application and stored in the database.
Report Actions in Views
The Client Profile report is available to the users through the actions defined in the application views. The actions are provided by the Reports add-on.
<hbox id="buttonsPanel" classNames="buttons-panel">
    <!-- ... -->
    <comboButton text="Reports">
        <items>
            <actionItem id="reportForEntityActionItem" ref="clientsDataGrid.runListEntityReportAction"/>
            <actionItem id="reportActionItem" ref="clientsDataGrid.runReportAction"/>
        </items>
    </comboButton>
</hbox>
<dataGrid id="clientsDataGrid" width="100%" minHeight="20em"
          dataContainer="clientsDc" columnReorderingAllowed="true">
    <actions>
        <!-- ... -->
        <action id="runListEntityReportAction" text="Reports for entity"
                type="report_runListEntityReport"/> (1)
        <action id="runReportAction" text="Reports" icon="vaadin:table"
                type="report_runReport"/> (2)
</actions>| 1 | Action with the report_runListEntityReport type shows available reports that have an external parameter of the Entity or the List of entities type and where the parameter entity type matches the entity displayed by the dataGrid. If an entity is selected in the dataGrid, it is automatically set as the parameter value. |
| 2 | Action with the report_runReport type shows all reports available to the user in this view. |
<actions>
    <!-- ... -->
    <action id="runSingleEntityReportAction" text="Reports for entity"
            type="report_runSingleEntityReport"/> (1)
</actions>
<layout>
    <hbox id="detailActions">
        <button id="saveAndCloseButton" action="saveAction"/>
        <button id="closeButton" action="closeAction"/>
        <button action="runSingleEntityReportAction"/> (1)
        <button id="printClientProfileButton" text="Print client profile"
                icon="vaadin:file-text"/> (2)
    </hbox>
</layout>| 1 | Action with the report_runSingleEntityReport type shows available reports that have an external parameter of the Entity or the List of entities type and where the parameter entity type matches the entity displayed in this detail view. |
| 2 | The button executes the Client Profile report using the custom handler in ClientDetailView shown below. |
public class ClientDetailView extends StandardDetailView<Client> {

    @Autowired
    private UiReportRunner uiReportRunner; (1)

    @Subscribe(id = "printClientProfileButton", subject = "clickListener")
    public void onPrintClientProfileButtonClick(final ClickEvent<JmixButton> event) {
        uiReportRunner.byReportCode("client-profile")
                .addParam("client", getEditedEntity())
                .withTemplateCode("HTML → HTML")
                .withParametersDialogShowMode(ParametersDialogShowMode.NO)
                .runAndShow();
    }
}| 1 | The UiReportRunner bean provides fluent API to execute reports in UI. |
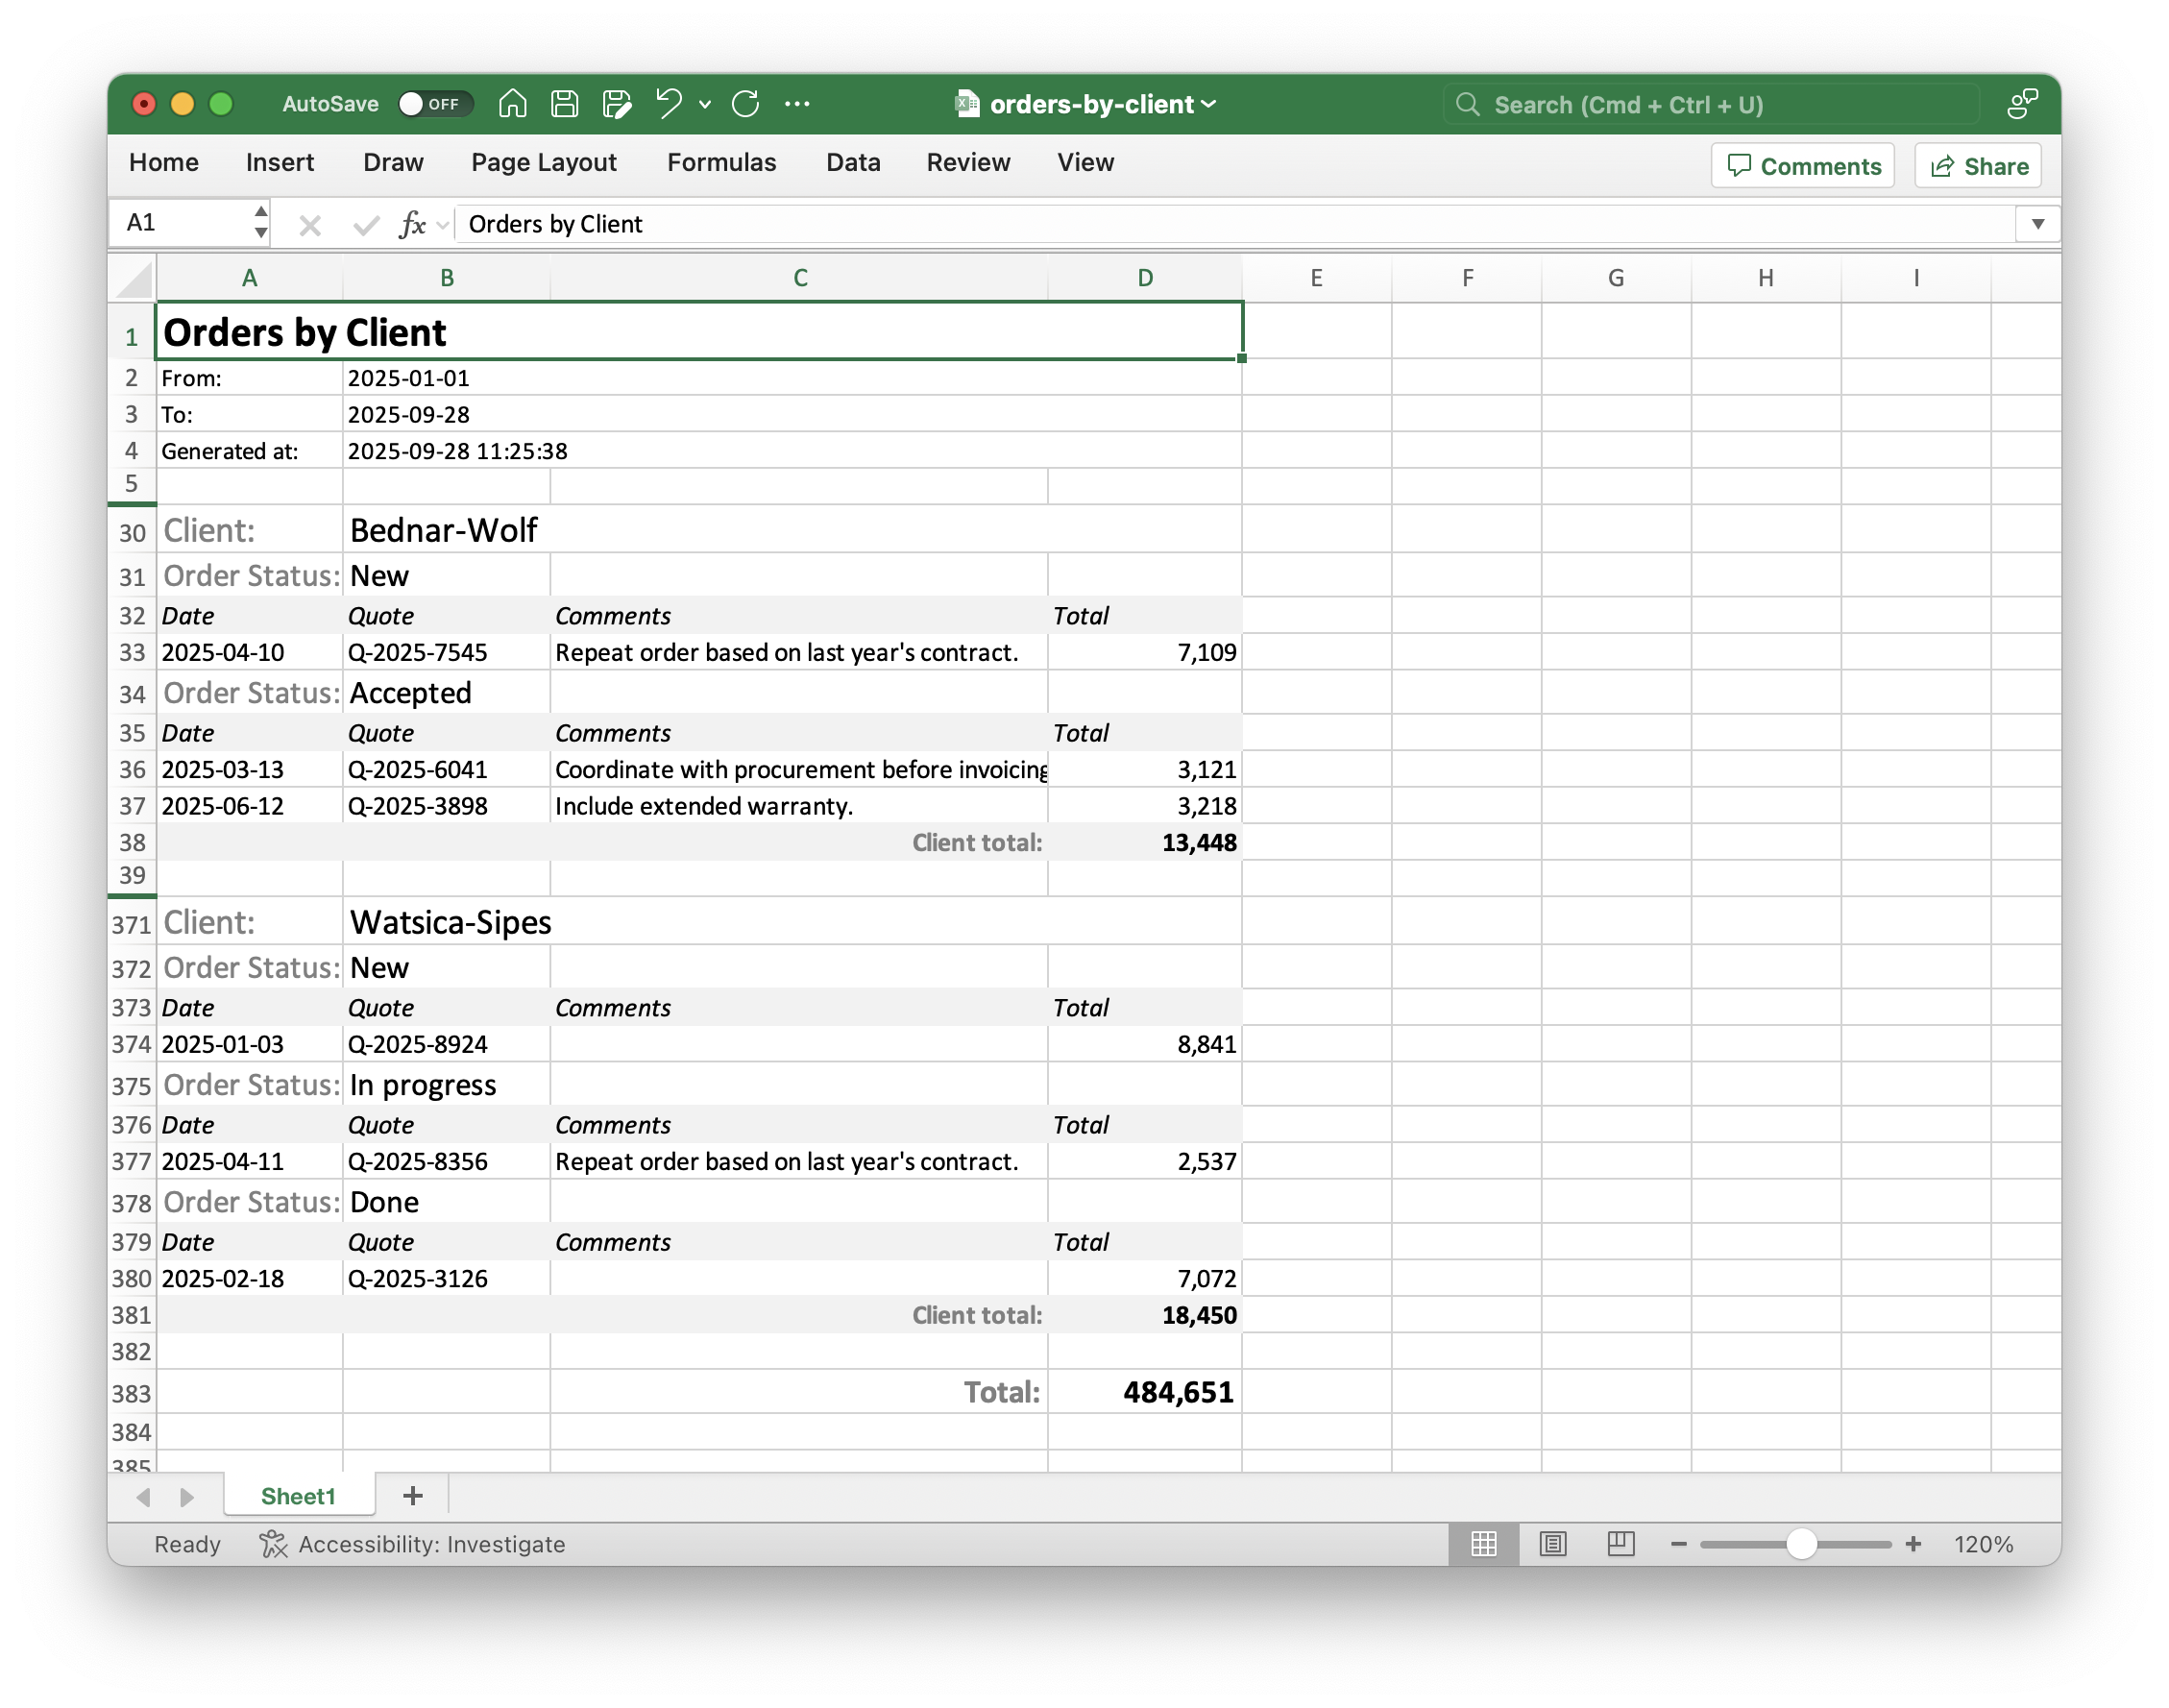
Orders by Client Report
This is a multi-level tabular report with subtotals. It shows all orders, grouped by client and status.
The report is available for admin and for alice who has the Manager role.
Log in as alice with password 1 and open the Reports → Run report view. Select the Orders by Client report and click Run.
In the Input parameters dialog, select the From and To dates to take into account only orders within a specific range. Both dates are optional, so if you leave them blank, all orders will be included in the report.
This report is developed for a single XLSX template, so the dialog does not allow you to select a template.
The resulting report looks as follows (most of the rows are hidden manually to show the totals):
The report can also be generated by a user with Manager role from the Clients and Orders list views using the Reports button.
Report Structure
The Orders by Client report has the following band structure:
Root
  ├── Header
  ├── Client
  │     ├── OrderStatus
  │     │     └── Order
  │     └── ClientTotal
  └── GrandTotal
The Header band is printed once to display the report parameters and timestamp.
The Client band is repeated for every client who has orders within the specified date range.
The OrderStatus band iterates over statuses of the found orders.
The Order band displays the orders with the current status.
The ClientTotal band is printed for each client.
The GrandTotal band is printed once in the report footer.
XLSX Template
XLSX templates are used in all tabular reports of this guide: Orders by Client Report, Orders by Status Report and Revenue by Month Report.
Report bands correspond to named ranges in the XLSX template. The following picture shows the named range of the Order band:
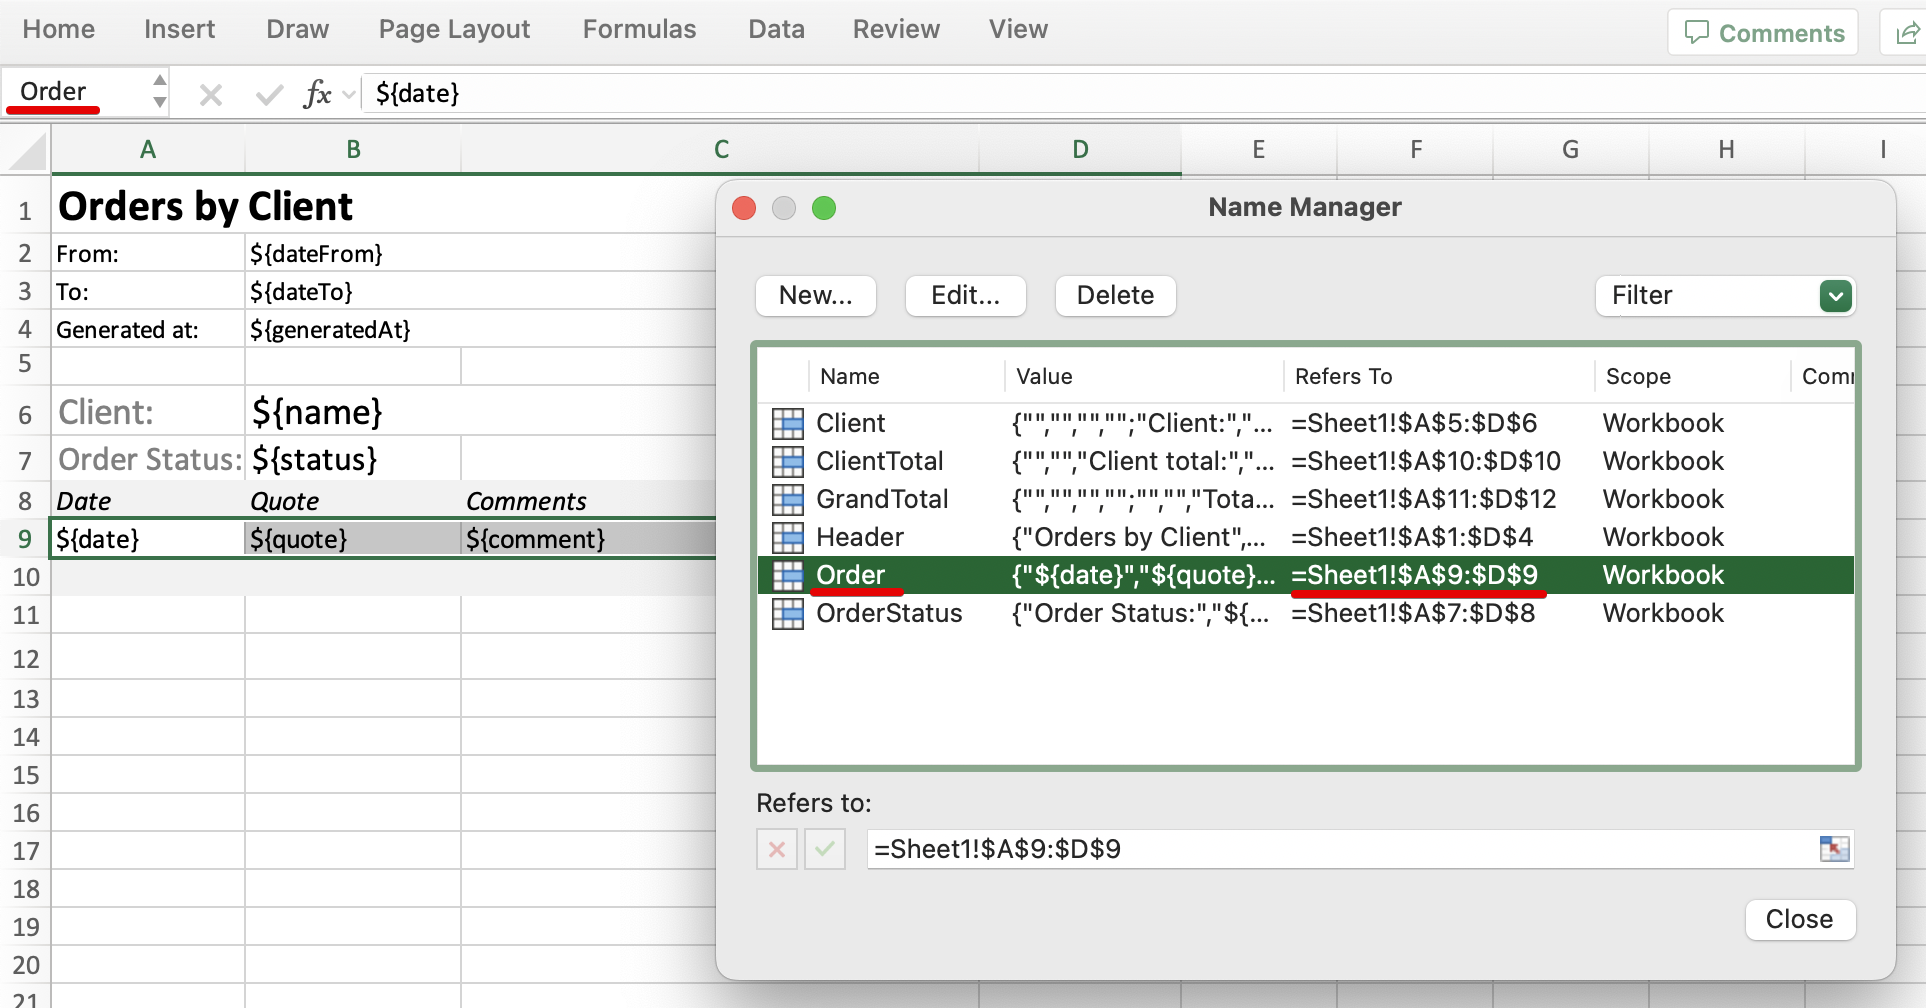
Bands are populated with data using the ${field_name} placeholders.
Design-Time Definition
The Orders by Client report structure is defined by the com.company.crm.report.OrdersByClientReport class.
Below we outline only elements that are substantially different from the Client Profile report definition.
public class OrdersByClientReport {
    @Autowired
    private DataManager dataManager;

    private final ThreadLocal<BigDecimal> runningClientTotal =
            ThreadLocal.withInitial(() -> BigDecimal.ZERO); (1)
    private final ThreadLocal<BigDecimal> runningGrandTotal =
            ThreadLocal.withInitial(() -> BigDecimal.ZERO); (1)

    @DataSetDelegate(name = "client")
    public ReportDataLoader clientDataLoader() {
        return (reportQuery, parentBand, params) -> {

            // Initialize thread locals on report start
            runningClientTotal.set(BigDecimal.ZERO);
            runningGrandTotal.set(BigDecimal.ZERO);

            List<Client> clients = dataManager.load(Client.class) (2)
                    .query("""
                            select c from Client c
                            where exists (
                                            select 1 from Order_ o where o.client.id = c.id and
                                                (:dateFrom is null or o.date >= :dateFrom) and
                                                (:dateTo is null or o.date <= :dateTo)
                                         )
                            order by c.name""")
                    .parameter("dateFrom", params.get("dateFrom"))
                    .parameter("dateTo", params.get("dateTo"))
                    .list();
            return clients.stream()
                    .map(client -> Map.of("id", client.getId(), "name", (Object) client.getName()))
                    .toList();
        };
    }
    @DataSetDelegate(name = "order")
    public ReportDataLoader orderDataLoader() {
        return (reportQuery, parentBand, params) -> {
            Object clientId = parentBand.getParentBand().getData().get("id");  (3)
            Object statusId = parentBand.getData().get("statusId");
            List<Order> orderList = dataManager.load(Order.class)
                    .query("""
                            select o from Order_ o
                            where o.client.id = :clientId and o.status = :status and
                                (:dateFrom is null or o.date >= :dateFrom) and
                                (:dateTo is null or o.date <= :dateTo)
                            order by o.date""")
                    .parameter("clientId", clientId)
                    .parameter("status", statusId)
                    .parameter("dateFrom", params.get("dateFrom"))
                    .parameter("dateTo", params.get("dateTo"))
                    .list();
            return orderList.stream()
                    .map(order -> {
                        runningClientTotal.set(
                                runningClientTotal.get().add(order.getTotal())
                        ); (4)
                        Map<String, Object> map = new HashMap<>();
                        map.put("order", order);
                        map.put("date", order.getDate().format(DateTimeFormatter.ofPattern("yyyy-MM-dd")));
                        map.put("quote", order.getQuote());
                        map.put("comment", order.getComment());
                        map.put("total", order.getTotal());
                        return map;
                    })
                    .toList();
        };
    }

    @DataSetDelegate(name = "clientTotal")
    public ReportDataLoader clientTotalDataLoader() {
        return (reportQuery, parentBand, params) -> {
            Map<String, Object> map = new HashMap<>();
            map.put("clientTotal", runningClientTotal.get()); (5)

            runningGrandTotal.set(
                    runningGrandTotal.get().add(runningClientTotal.get())
            ); (6)
            runningClientTotal.set(BigDecimal.ZERO);

            return List.of(map);
        };
    }

    @DataSetDelegate(name = "grandTotal")
    public ReportDataLoader grandTotalDataLoader() {
        return (reportQuery, parentBand, params) -> {
            Map<String, Object> map = new HashMap<>();
            map.put("grandTotal", runningGrandTotal.get()); (7)

            // Clean up thread locals on report finish
            runningClientTotal.remove();
            runningGrandTotal.remove();

            return List.of(map);
        };
    }
}| 1 | Thread-local variables are used to store intermediate values during the report execution. |
| 2 | DataManager is used to load data. |
| 3 | parentBand argument is used to get fields of the upper-level bands and use them as parameters for this band’s dataset query. |
| 4 | runningClientTotal is increased by the amount of the order printed in the current band iteration. |
| 5 | Accumulated runningClientTotal is used to print the client total field. |
| 6 | runningGrandTotal is increased by the current client total value; runningClientTotal is set to zero for the next client. |
| 7 | Accumulated runningGrandTotal is printed in the end and thread-local variables are cleared. |
Runtime Definition
The runtime variant of the report is called Orders by Client (runtime) and can be opened from the Reports → Reports view.
Instead of accumulating subtotals and totals in thread-local variables, the runtime report uses separate JPQL queries to calculate them.
The ClientTotal band dataset query:
select sum(o.total) as "clientTotal"
from Order_ o
where o.client.id = ${Client.id} and
    (${dateFrom} is null or o.date >= ${dateFrom}) and
    (${dateTo} is null or o.date <= ${dateTo})
The GrandTotal band dataset query:
select sum(o.total) as "grandTotal"
from Order_ o
where (${dateFrom} is null or o.date >= ${dateFrom}) and
    (${dateTo} is null or o.date <= ${dateTo})
The JPQL syntax of report queries is slightly different from the standard JPQL:
-
asoperator is used to provide field names. For example:select sum(o.total) as "clientTotal". -
Parameters are provided using
${param_name}placeholders. For example:o.date >= ${dateFrom}.
Orders by Status Report
This is a tabular report with a chart. It shows a high-level sales pipeline: count and sum of orders per status in a period.
The report is similar to Orders by Client in the following:
-
available to the
Managerrole; -
accepts an optional range of dates;
-
has a single XLSX template;
-
can be generated from the Clients and Orders list views.
Log in as alice with password 1 and open the Reports → Run report view. Select the Orders by Status report and click Run.
The resulting report looks as follows:
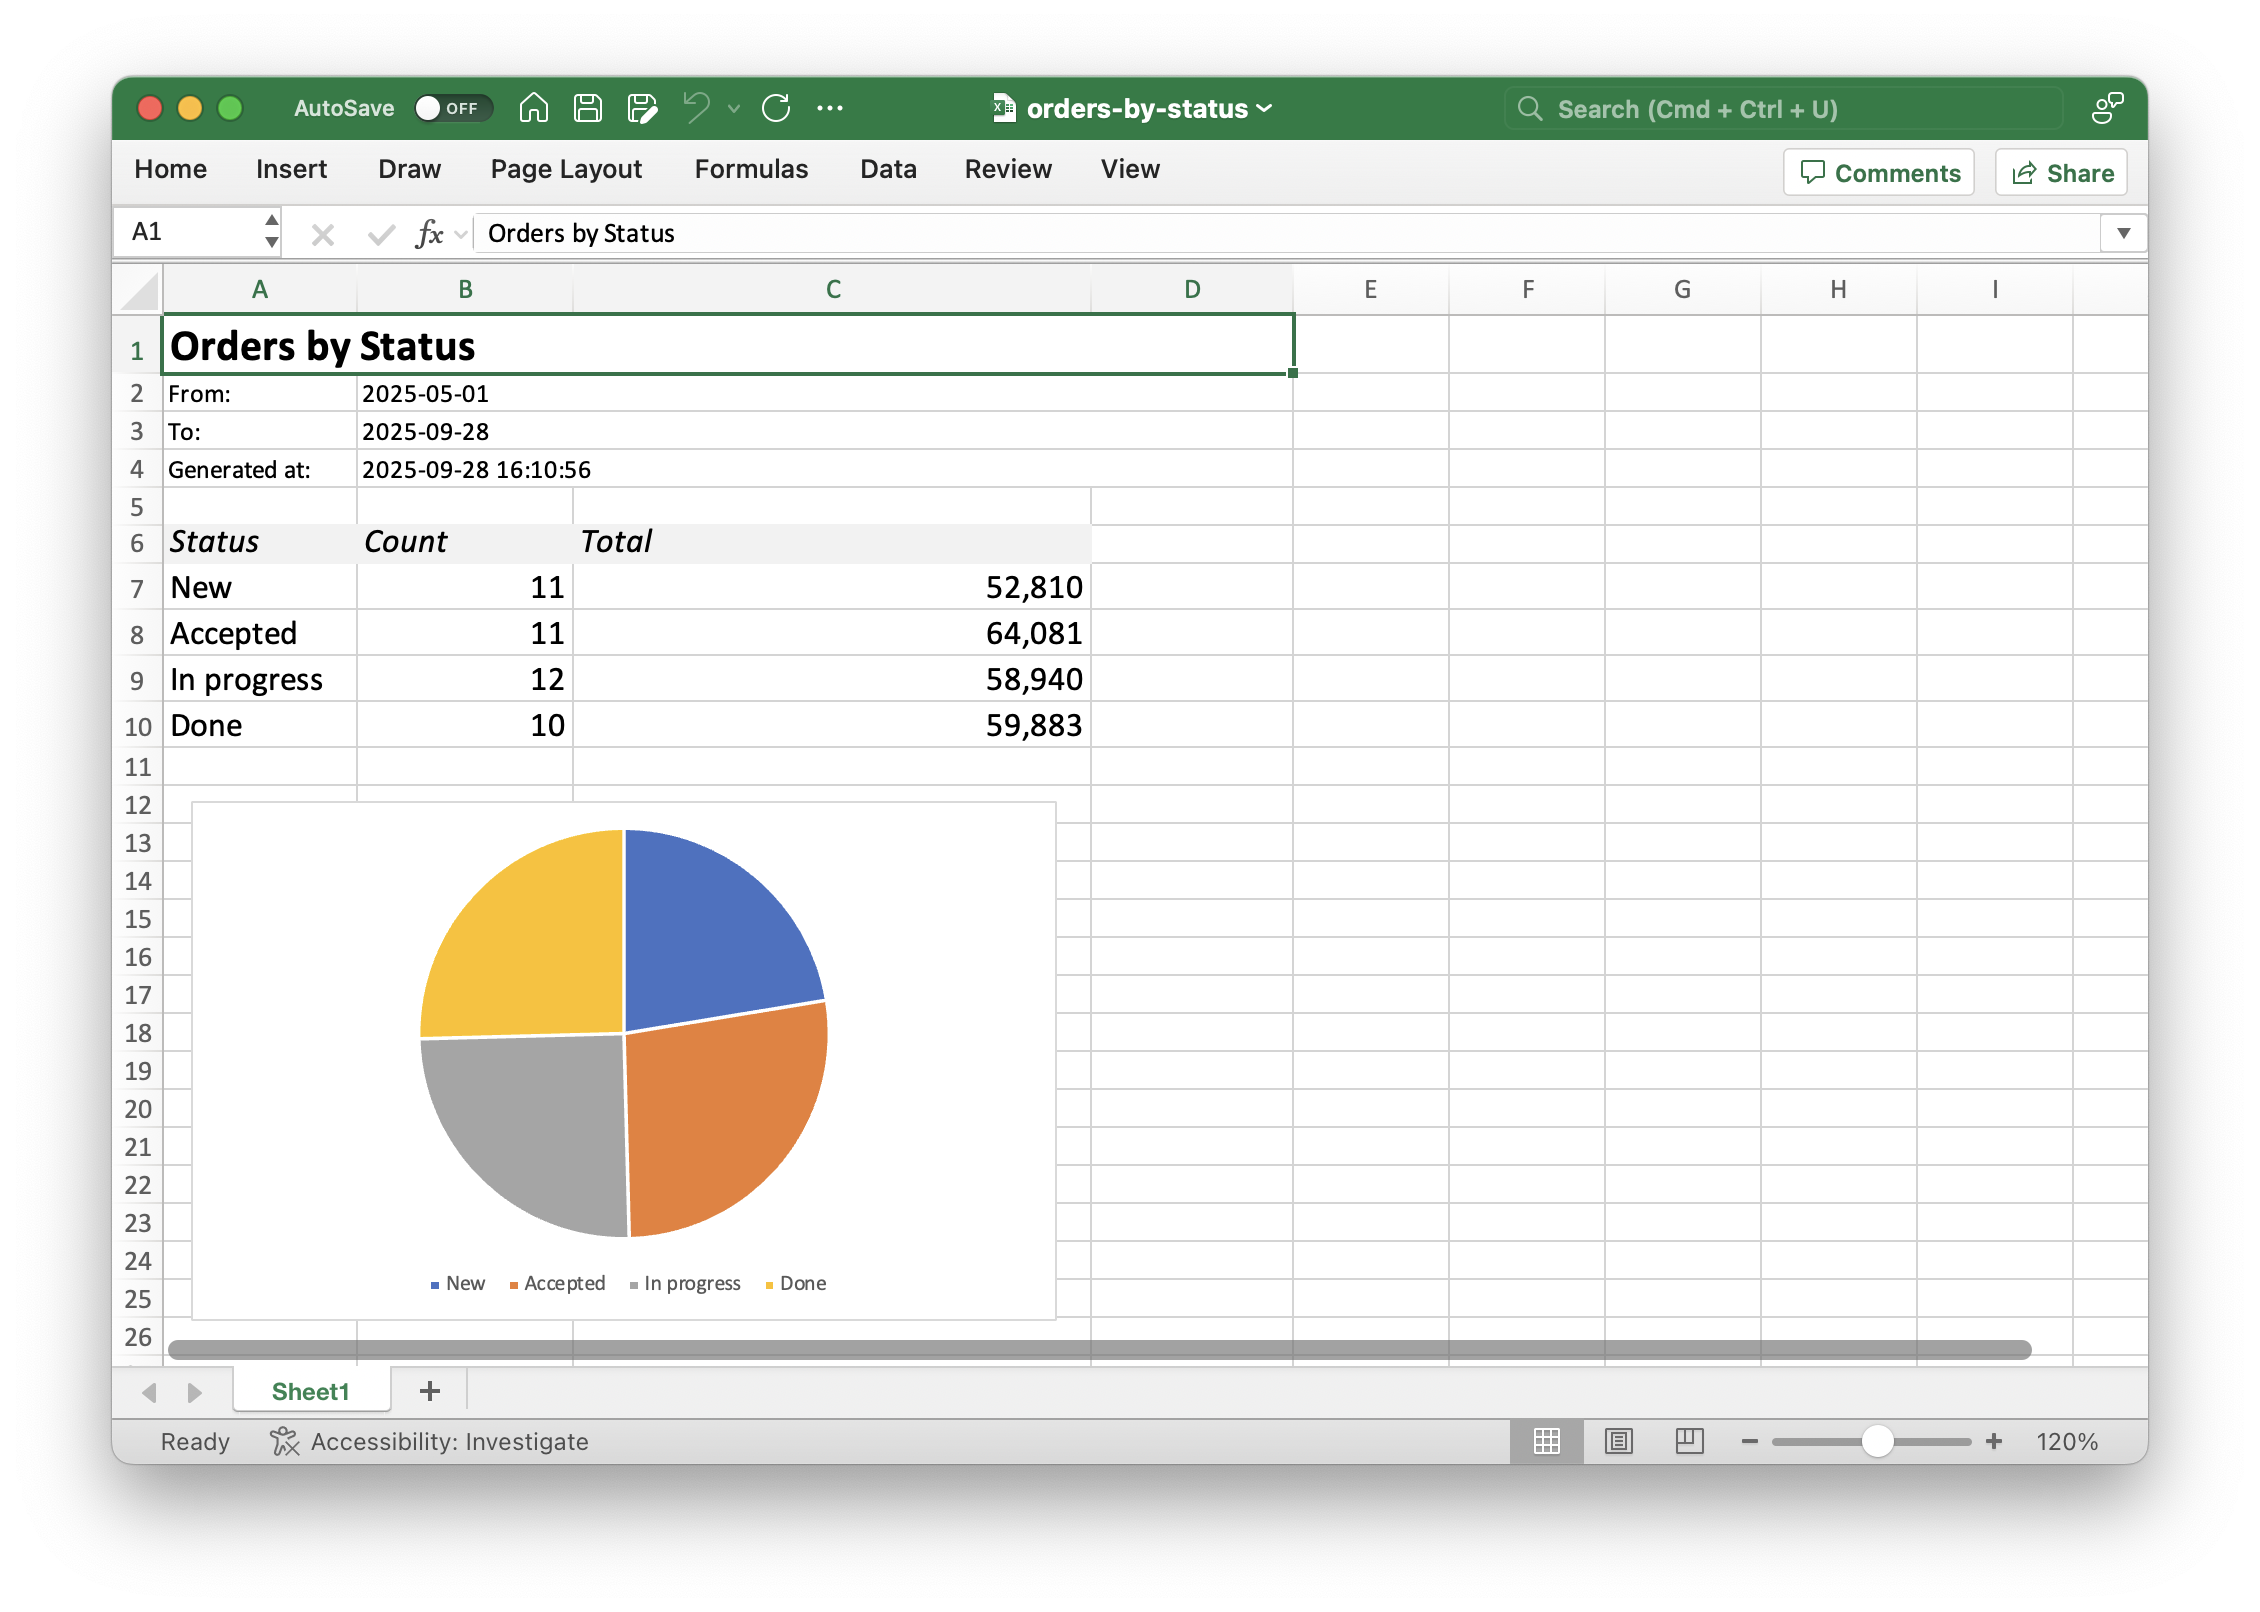
Report Structure
The Orders by Status report has the following band structure:
Root
  ├── Header
  ├── OrderStatus
  └── Chart
The Header band is printed once to display the report parameters and timestamp.
The OrderStatus band is repeated for every status of orders within the specified date range.
The Chart band is printed once to display the chart.
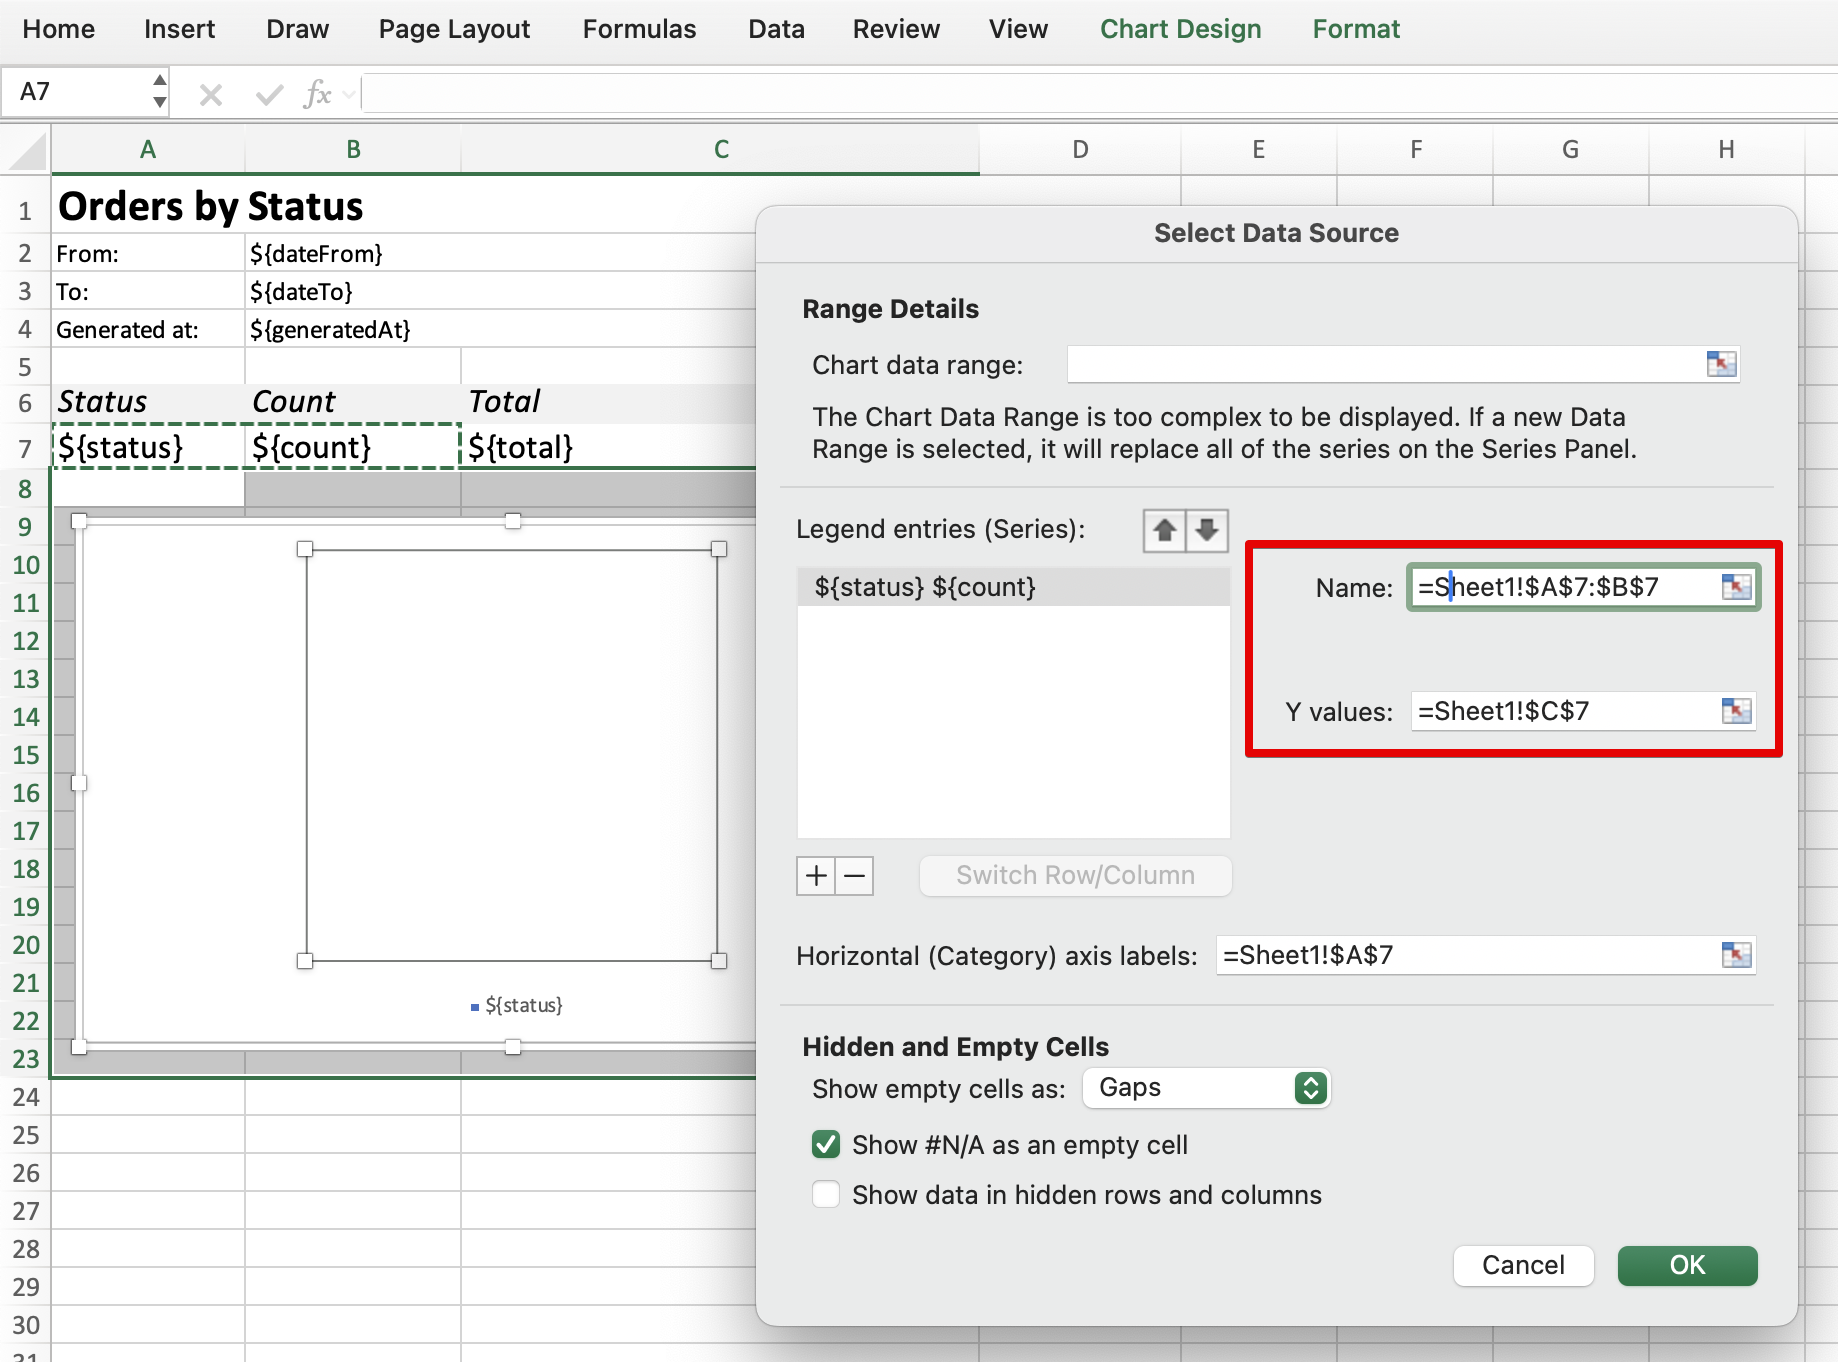
XLSX Template with Diagram
The XLSX template can contain diagrams. They are defined in a separate band:
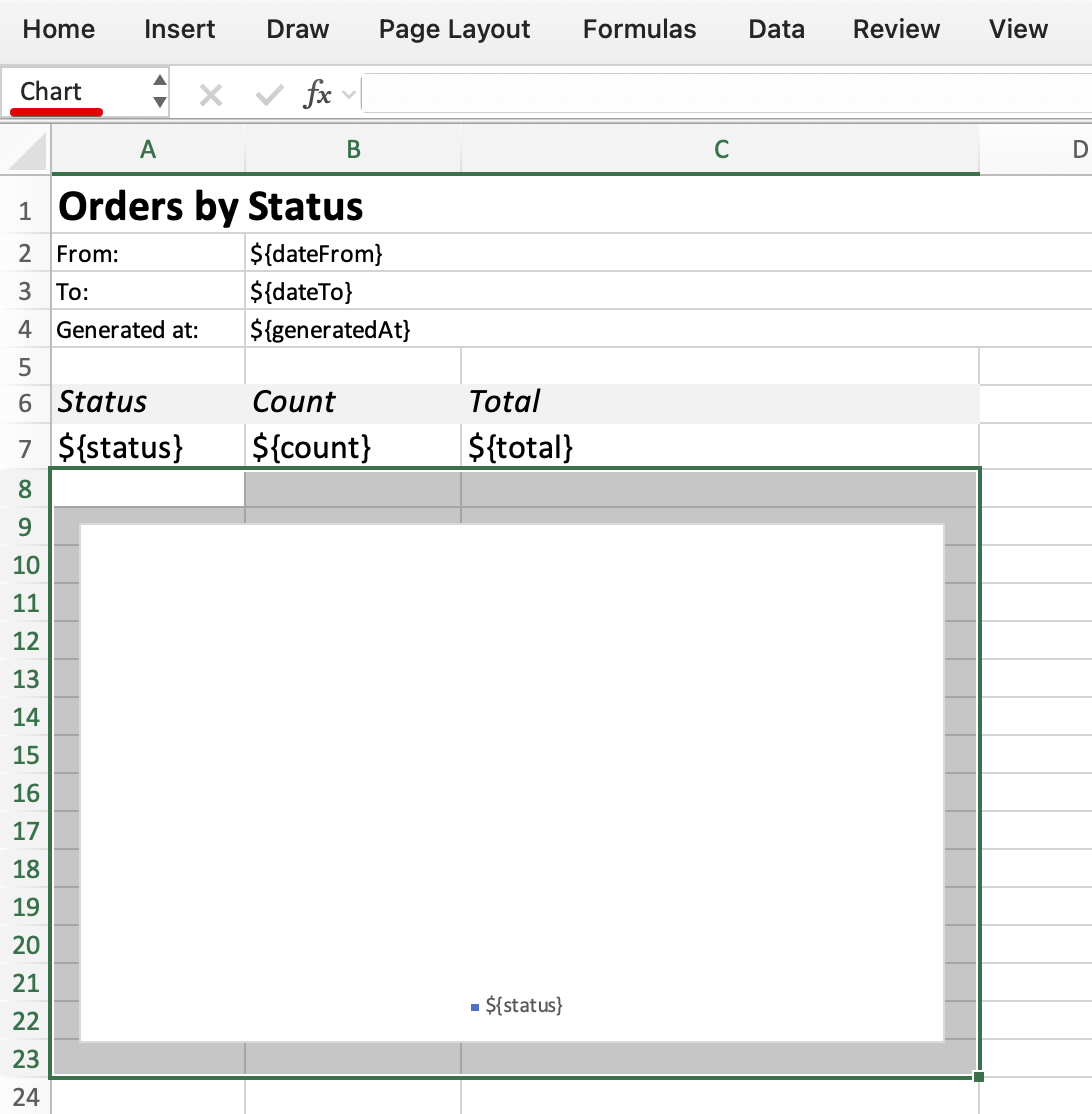
The data source for the chart is the range of cells corresponding to a tabular band:
Design-Time Definition
The Orders by Status report structure is defined by the OrdersByStatusReport class.
The Chart band has no datasets, but it is still printed once:
@BandDef(
        name = "Chart",
        parent = "Root"
)
public class OrdersByStatusReport {
}
This behavior is defined by the jmix.reports.put-empty-row-if-no-data-selected application property.
The OrderStatus band has a dataset that delegates to a ReportDataLoader:
@BandDef(
        name = "OrderStatus",
        parent = "Root",
        dataSets = @DataSetDef(name = "orderStatus", type = DataSetType.DELEGATE)
)
public class OrdersByStatusReport {

    @Autowired
    private DataManager dataManager;

    @DataSetDelegate(name = "orderStatus")
    public ReportDataLoader orderStatusDataLoader() {
        return (reportQuery, parentBand, params) -> {
            List<KeyValueEntity> keyValueEntities = dataManager.loadValues("""
                            select o.status, count(o), sum(o.total) from Order_ o
                            where (:dateFrom is null or o.date >= :dateFrom) and
                                (:dateTo is null or o.date <= :dateTo)
                            group by o.status order by o.status""")
                    .properties("statusId", "count", "total")
                    .parameter("dateFrom", params.get("dateFrom"))
                    .parameter("dateTo", params.get("dateTo"))
                    .list();
            return keyValueEntities.stream()
                    .map(kve -> {
                        Map<String, Object> map = new HashMap<>();
                        map.put("status", OrderStatus.fromId(kve.getValue("statusId")));
                        map.put("count", kve.getValue("count"));
                        map.put("total", kve.getValue("total"));
                        return map;
                    })
                    .toList();
        };
    }
}
Runtime Definition
The runtime variant of the report is called Orders by Status (runtime) and can be opened from the Reports → Reports view.
It uses a JPQL query for calculating aggregated values in the OrderStatus band:
select o.status as "status",
    count(o) as "count", sum(o.total) as "total"
from Order_ o
where (${dateFrom} is null or o.date >= ${dateFrom}) and
    (${dateTo} is null or o.date <= ${dateTo})
group by o.status
order by o.status
Revenue by Month Report
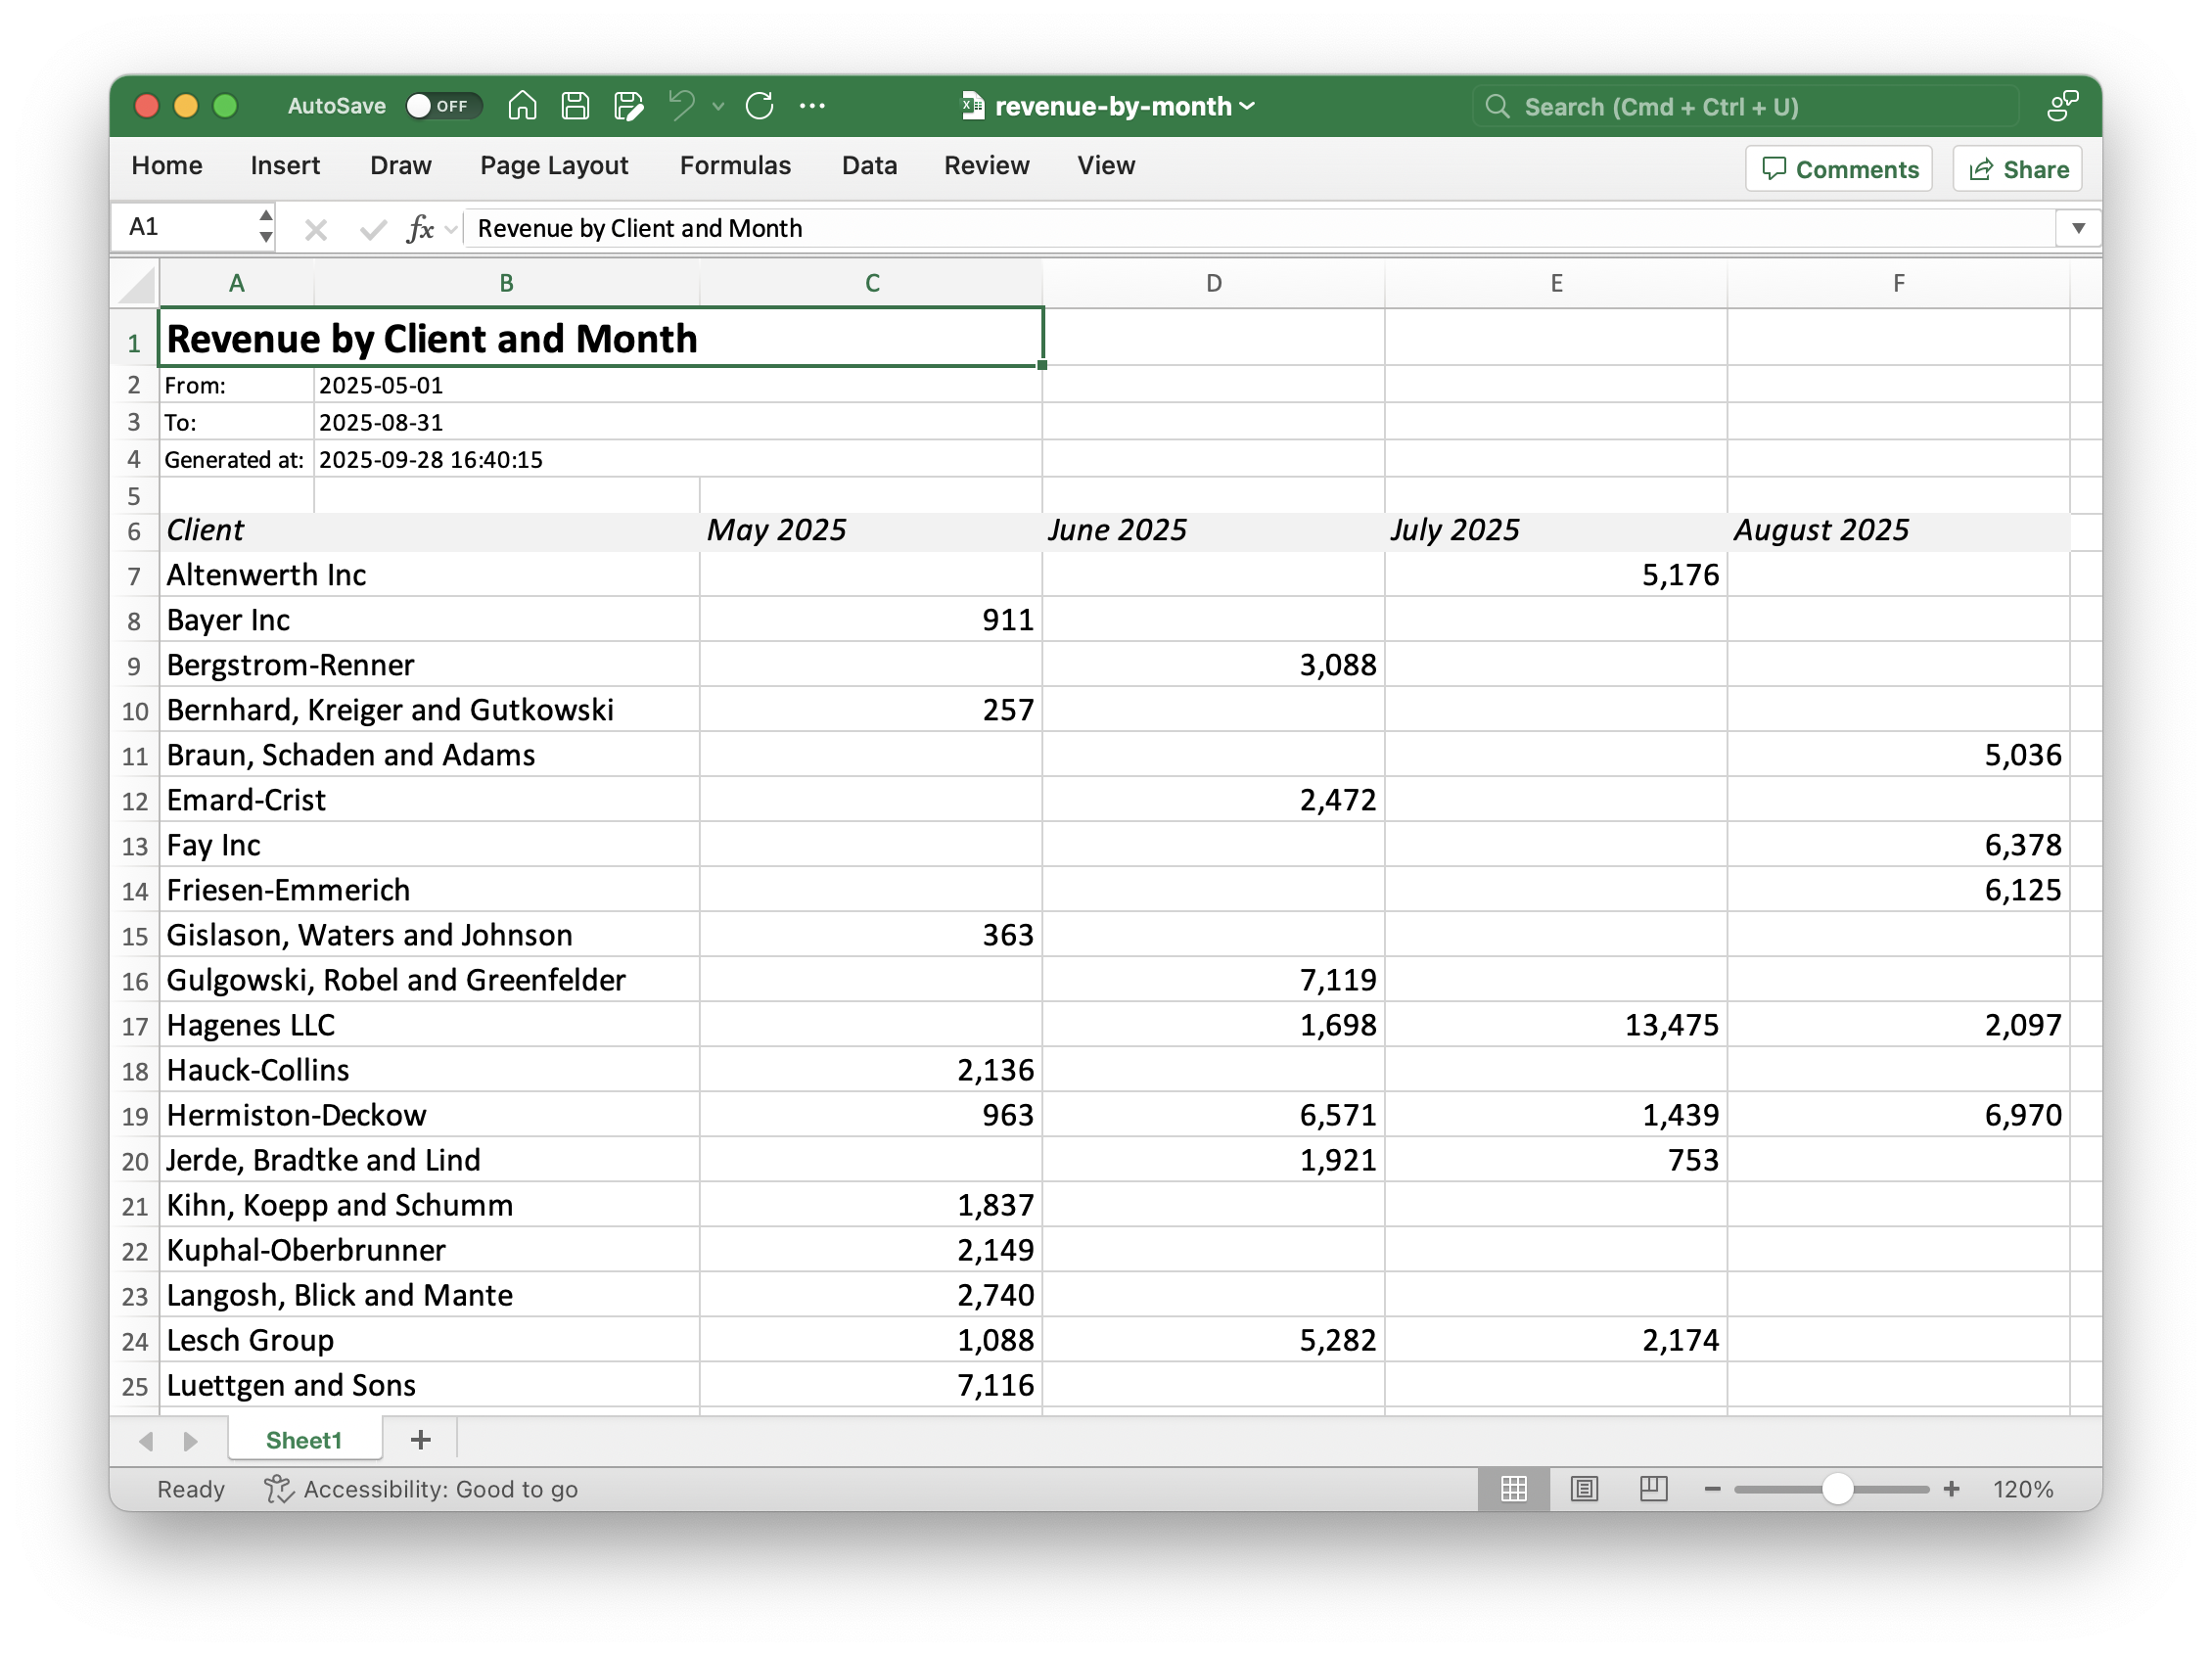
This is a cross-tab report that shows monthly total payments by client.
Cross-tab means that the number of columns in the report is dynamic, just like the rows, and each intersection, or cell, shows the result of aggregation based on the row and column.
Log in as alice with password 1 and open the Reports → Run report view. Select the Revenue by Month report and click Run.
In the Input parameters dialog, the From and To dates are required. Moreover, the user must select the start a month in From and the end of a month in To. Also, the application checks that the From date is before the To date. These constraints help to avoid uncertainty when interpreting the report data, because the report is calculated for entire months.
The resulting report looks as follows:
The report can also be generated from the Clients and Payments list views using the Reports button.
Report Structure
The Revenue by Month report has the following band structure:
Root
  ├── Header
  └── Revenue
The Header band is printed once to display the report parameters and timestamp.
The Revenue band is a cross-tab band that has a complex internal structure of datasets, corresponding to rows, columns, and intersection cells.
XLSX Cross-Tab Template
The datasets of the cross-tab band have names with predefined prefixes. They correspond to the following named cell ranges:
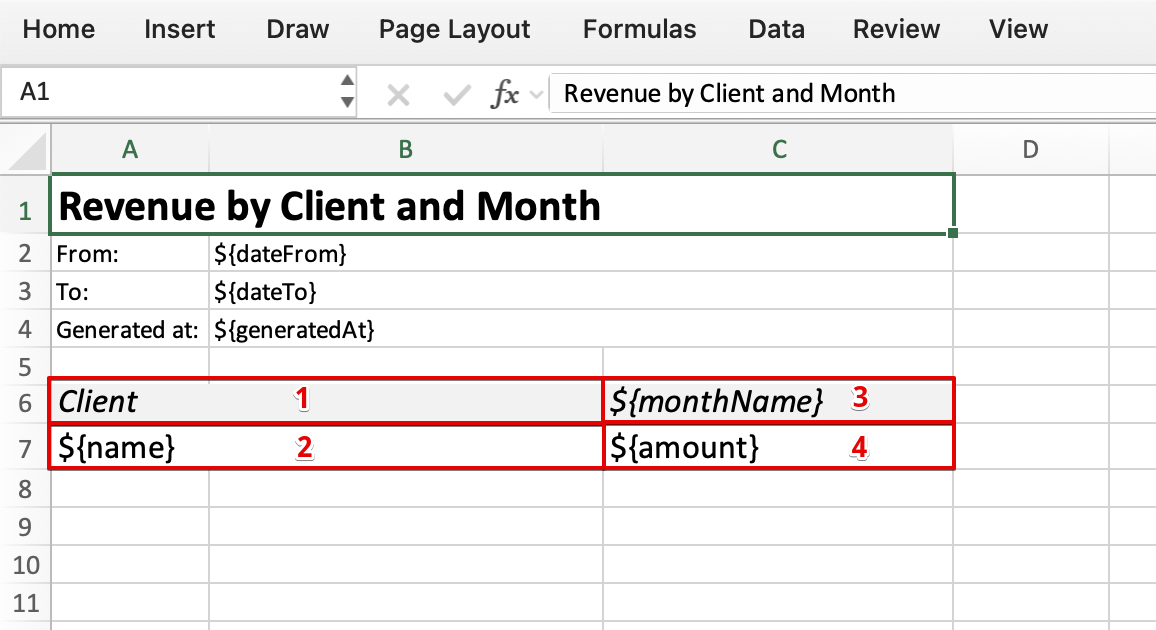
Assuming that the cross-tab band name is Revenue, the named ranges needed to output the band are:
-
Revenue_header -
Revenue_master_data -
Revenue_dynamic_header -
Revenue
Design-Time Definition
The Revenue by Month report structure is defined by the RevenueByMonthReport class.
Below, we will consider elements that distinguish this report from the others.
@InputParameterDef(
        alias = "dateFrom",
        name = "From",
        type = ParameterType.DATE,
        required = true (1)
)

@InputParameterDef(
        alias = "dateTo",
        name = "To",
        type = ParameterType.DATE,
        required = true (1)
)
public class RevenueByMonthReport {

    @InputParameterDelegate(alias = "dateFrom") (2)
    public ParameterValidator<Date> dateFromValidator() {
        return value -> {
            if (!Objects.equals(value, ReportUtils.getFirstDayOfMonth(value))) {
                throw new ReportParametersValidationException("'From' date must be the first day of month");
            }
        };
    }

    @InputParameterDelegate(alias = "dateTo") (2)
    public ParameterValidator<Date> dateToValidator() {
        return value -> {
            if (!Objects.equals(value, ReportUtils.getLastDayOfMonth(value))) {
                throw new ReportParametersValidationException("'To' date must be the last day of month");
            }
        };
    }

    @ReportDelegate (3)
    public ParametersCrossValidator parametersCrossValidator() {
        return params -> {
            Date dateFrom = getParam(params, "dateFrom");
            Date dateTo = getParam(params, "dateTo");
            if (dateFrom.after(dateTo)) {
                throw new ReportParametersValidationException("'From' date must be before 'To' date");
            }
        };
    }
}| 1 | Both input parameters are required. Users cannot run the report without entering parameter values. |
| 2 | Input parameters are validated using ParameterValidator objects returned by @InputParameterDelegate methods. Entered dates must be the beginning and the end of months. |
| 3 | ParametersCrossValidator returned from the @ReportDelegate method performs additional validation of all entered parameters: it ensures the "From" date is before the "To" date. |
The Revenue cross-tab band and its datasets are defined as follows:
@BandDef(
        name = "Revenue",
        parent = "Root",
        orientation = Orientation.CROSS, (1)
        dataSets = {
                @DataSetDef(name = "Revenue_dynamic_header", (2)
                        type = DataSetType.DELEGATE),
                @DataSetDef(name = "Revenue_master_data", (3)
                        type = DataSetType.DELEGATE),
                @DataSetDef(name = "Revenue", (4)
                        type = DataSetType.DELEGATE)
        }
)
public class RevenueByMonthReport {

    @DataSetDelegate(name = "Revenue_dynamic_header") (2)
    public ReportDataLoader revenueDynamicHeaderDataLoader() {
        return (reportQuery, parentBand, params) -> {
            Date dateFrom = getParam(params, "dateFrom");
            Date dateTo = getParam(params, "dateTo");

            YearMonth start = YearMonth.from(ReportUtils.dateToLocalDate(dateFrom));
            YearMonth end = YearMonth.from(ReportUtils.dateToLocalDate(dateTo));

            List<Map<String, Object>> result = new ArrayList<>();
            YearMonth current = start;
            while (!current.isAfter(end)) {
                Map<String, Object> map = new HashMap<>();
                map.put("monthId", current.getYear() + "-" + current.getMonthValue());
                map.put("monthName", current.getMonth().getDisplayName(TextStyle.FULL, Locale.ENGLISH) + " " + current.getYear());
                map.put("year", current.getYear());
                map.put("month", current.getMonthValue());
                result.add(map);
                current = current.plusMonths(1);
            }
            return result;
        };
    }

    @DataSetDelegate(name = "Revenue_master_data") (3)
    public ReportDataLoader revenueMasterDataDataLoader() {
        return (reportQuery, parentBand, params) -> {
            List<Client> clients = dataManager.load(Client.class)
                    .query("""
                            select c from Client c
                            where exists (
                                    select 1 from Payment p where p.invoice.client.id = c.id and
                                        p.date >= :dateFrom and p.date <= :dateTo
                                    )
                            order by c.name""")
                    .parameter("dateFrom", params.get("dateFrom"))
                    .parameter("dateTo", params.get("dateTo"))
                    .list();
            return clients.stream()
                    .map(client -> Map.of("clientId", client.getId(), "name", (Object) client.getName()))
                    .toList();
        };
    }

     @DataSetDelegate(name = "Revenue") (4)
     public ReportDataLoader revenueDataLoader() {
        return (reportQuery, parentBand, params) -> {
            List<Map<String, Object>> headerList = getParam(params, "Revenue_dynamic_header");

            List<Map<String, Object>> masterDataList = getParam(params, "Revenue_master_data");
            List<Object> clientIds = masterDataList.stream()
                    .map(m -> m.get("clientId"))
                    .toList();

            List<Map<String, Object>> result = new ArrayList<>();
            for (Map<String, Object> headerData : headerList) {
                dataManager.loadValues("""
                            select p.invoice.client.id, sum(p.amount) from Payment p
                            where extract(month from p.date) = :month and
                                extract(year from p.date) = :year and
                                p.invoice.client.id in :clientIds
                            group by p.invoice.client.id
                            """)
                        .properties("clientId", "amount")
                        .parameter("month", headerData.get("month"))
                        .parameter("year", headerData.get("year"))
                        .parameter("clientIds", clientIds)
                        .list()
                        .forEach(kv -> {
                            Map<String, Object> map = new HashMap<>();
                            map.put("Revenue_dynamic_header@monthId", (5)
                                    headerData.get("monthId"));
                            map.put("Revenue_master_data@clientId", (5)
                                    kv.getValue("clientId"));
                            map.put("amount", kv.getValue("amount"));
                            result.add(map);
                        });
            }
            return result;
        };
    }
}| 1 | Annotation attribute orientation = Orientation.CROSS specifies the cross-tab band. |
| 2 | Dataset with the <band_name>_dynamic_header predefined name provides data for column headers. |
| 3 | Dataset with the <band_name>_master_data predefined name provides data for row headers. |
| 4 | Dataset with the <band_name> predefined name provides data for intersection cells. |
| 5 | The cells dataset returns also identifiers of rows and columns as <band_name>_master_data@<id_field_name> and <band_name>_dynamic_header@<id_field_name> fields. These identifiers enable the reporting engine to correspond the cell with the respective row and column. |
Runtime Definition
The runtime variant of the report is called Revenue by Month (runtime) and can be opened from the Reports → Reports view.
It uses JPQL and Groovy datasets shown below.
The Revenue_dynamic_header dataset’s Groovy script for columns:
import com.company.crm.report.ReportUtils
import java.time.YearMonth
import java.time.format.TextStyle

def dateFrom = params["dateFrom"]
def dateTo = params["dateTo"]

def start = YearMonth.from(ReportUtils.dateToLocalDate(dateFrom));
def end = YearMonth.from(ReportUtils.dateToLocalDate(dateTo));

def result = []
def current = start
while (!current.isAfter(end)) {
    result.add([
        'monthId': current.getYear() + "-" + current.getMonthValue(),
        'monthName': current.getMonth().getDisplayName(TextStyle.FULL, Locale.ENGLISH) + " " + current.getYear(),
        'year': current.getYear(),
        'month': current.getMonthValue()
    ])
    current = current.plusMonths(1)
}
return result
The Revenue_master_data dataset’s JPQL query for rows:
select c.id as "clientId", c.name as "name"
from Client c
where exists (
        select 1 from Payment p where p.invoice.client.id = c.id and
            p.date >= ${dateFrom} and p.date <= ${dateTo}
        )
order by c.name
The Revenue dataset’s Groovy script for intersection cells:
def headerList = params["Revenue_dynamic_header"]

def masterDataList = params["Revenue_master_data"]
def clientIds = masterDataList.collect { it['clientId'] }

def result = []
headerList.each { headerData ->
    dataManager.loadValues('''
                select p.invoice.client.id, sum(p.amount) from Payment p
                where extract(month from p.date) = :month and
                    extract(year from p.date) = :year and
                    p.invoice.client.id in :clientIds
                group by p.invoice.client.id
                ''')
            .properties("clientId", "amount")
            .parameter("month", headerData["month"])
            .parameter("year", headerData["year"])
            .parameter("clientIds", clientIds)
            .list()
            .each { kv ->
                result.add([
                    "Revenue_dynamic_header@monthId": headerData["monthId"],
                    "Revenue_master_data@clientId": kv.getValue("clientId"),
                    "amount": kv.getValue("amount")
                ])
            }
}
return result
Importing Runtime Reports
In this project, runtime report definitions are manually exported to ZIP files from the Reports view and stored in the application resources. They are loaded into the database at the start of the application by the following bean:
@Component
public class RuntimeReportsImporter {

    private static final Logger log = LoggerFactory.getLogger(RuntimeReportsImporter.class);

    @Autowired
    private Resources resources;

    @Autowired
    protected ReportImportExport reportImportExport; (1)

    private static final String[] archives = new String[] { "client-profile.zip", "orders-by-client.zip",
            "orders-by-status.zip", "revenue-by-month.zip" };

    @EventListener(ApplicationReadyEvent.class) (2)
    @Authenticated (3)
    public void importReports(ApplicationReadyEvent event) {
        log.info("Starting runtime report import");
        for (String archive : archives) {
            try (InputStream is = resources.getResourceAsStream("/com/company/crm/runtime-reports/" + archive)) {
                if (is != null) {
                    reportImportExport.importReports(IOUtils.toByteArray(is));
                } else {
                    log.warn("Report file not found: {}", archive);
                }
            } catch (IOException e) {
                log.error("Failed to import report: {}", archive, e);
            }
        }
        log.info("Runtime report import completed");
    }
}| 1 | ReportImportExport bean allows you to load runtime report definitions to the database from ZIP archives. |
| 2 | The import procedure is invoked on application start. |
| 3 | It requires the system authentication. |
Project Configuration
To convert resulting documents from office formats (DOCX, XLSX) to PDF, the application uses the locally installed LibreOffice. This is defined by the following properties:
jmix.reports.use-office-for-document-conversion=true
jmix.reports.office-path=/Applications/LibreOffice.app/Contents/MacOS
Summary
This guide demonstrates the following features of the Jmix Reports add-on using examples from a sample CRM application:
-
Band-based report structures, including master-detail and cross-tab bands.
-
Multiple template types: HTML with Freemarker directives, DOCX with placeholders, XLSX with named ranges and diagrams.
-
Output formats: PDF, DOCX, XLSX, HTML.
-
Design-time report definitions using annotations such as
@ReportDef,@TemplateDef,@InputParameterDef,@BandDef, and@DataSetDef. -
Runtime report definitions stored in the database, editable via the UI, with JPQL queries and Groovy scripts for data loading.
-
Input parameters, including entity types, date ranges, and validations using delegate methods.
-
Data loading via delegate methods, thread-local variables for totals, and aggregated JPQL queries.
-
Report execution actions integrated into entity list and detail views.
-
Role-based permissions for report access.
-
Importing runtime reports from ZIP files on application startup.
-
Configuration for converting office formats to PDF using LibreOffice.
