GanttChart
The GanttChart component allows you to create Gantt charts.
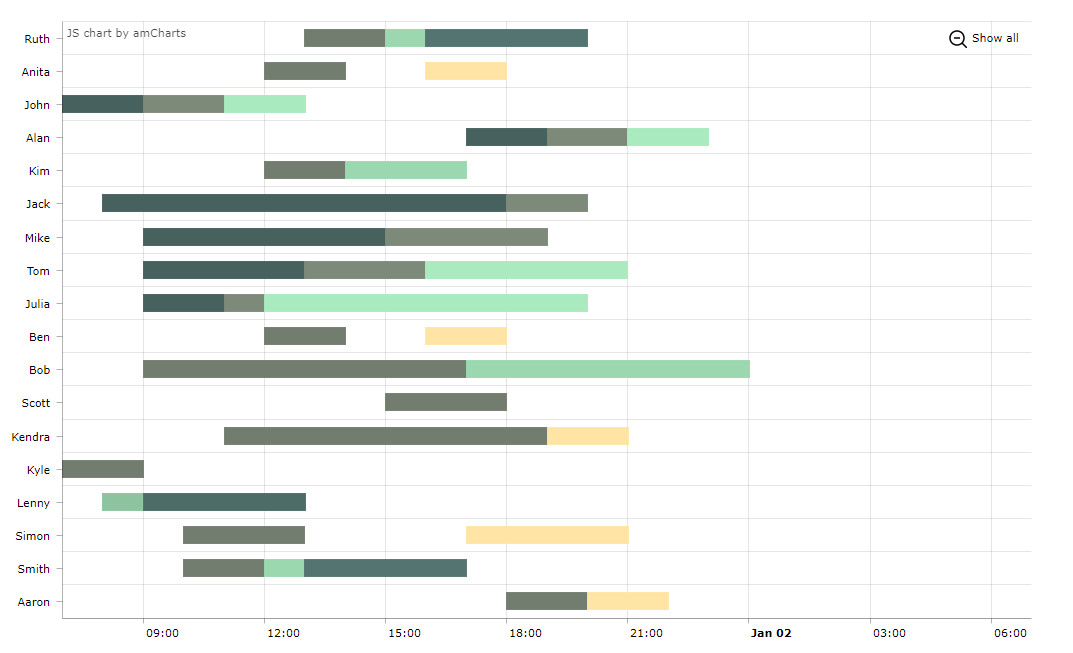
Component’s XML name: chart:ganttChart.
Elements
-
categoryAxis– an element that describes the category axis. -
graph– an element that contains a collection ofchart:graphelements; the graph is described by thechart:graphelement.-
the
typeattribute defines the type of the graph and can be: line, column, step line, smoothed line, OHLC, and candlestick. -
the
valueFieldattribute defines a key from the list of key-value pairs of data provider.
-
-
valueAxis– a value axis of the chart. If the chart data is date- or time-based, you can set the value axis type todate.
Attributes
-
segmentsField– a segments field of the chart. -
additionalSegmentFields– a list of additional segment fields that correspond to the entity attributes to be fetched from the data provider, similarly to the additionalFields attribute. -
endField/endDateField– an end value or the end date of the chart. -
startField/startDateField– a start value or the start date of the chart. -
startDate– a chart start date if the value axis type is adate. -
categoryField– a category field of the chart.
Data Binding
You can assign a CollectionContainer to the chart. In the example below the start and end attributes of an entity are set for the attributes startDateField and endDateField.
<chart:ganttChart id="ganttChart"
additionalSegmentFields="task"
balloonDateFormat="JJ:NN"
brightnessStep="10"
categoryField="category"
colorField="color"
columnWidth="0.5"
dataContainer="taskSpansDc"
durationField="duration"
height="100%"
marginRight="70"
period="HOURS"
rotate="true"
segmentsField="segments"
startDate="2022-01-01"
startField="start"
theme="LIGHT"
width="100%">
<chart:graph balloonText="<strong>[[task]]</strong>: [[open]] [[value]]"
fillAlphas="1"/>
<chart:valueAxis maximum="31"
minimum="7"
type="DATE"/>
<chart:chartCursor cursorAlpha="0"
cursorColor="#55bb76"
fullWidth="true"
valueLineAlpha="0.5"
valueBalloonsEnabled="false"
valueLineBalloonEnabled="true"
valueLineEnabled="true"
valueZoomable="true"
zoomable="false"/>
</chart:ganttChart>Events and Handlers
|
To generate a handler stub in Jmix Studio, select the component in the screen descriptor XML or in the Component Hierarchy panel and use the Handlers tab of the Component Inspector panel. Alternatively, you can use the Generate Handler button in the top panel of the screen controller. |
For more details, see AmCharts documentation.
