AngularGaugeChart
The AngularGaugeChart component allows you to create gauge charts.
Component’s XML name: chart:gaugeChart
Elements
-
arrows- includes the nestedarrowelements for the chart arrow axes.<chart:arrows> <chart:arrow value="60"/> </chart:arrows> -
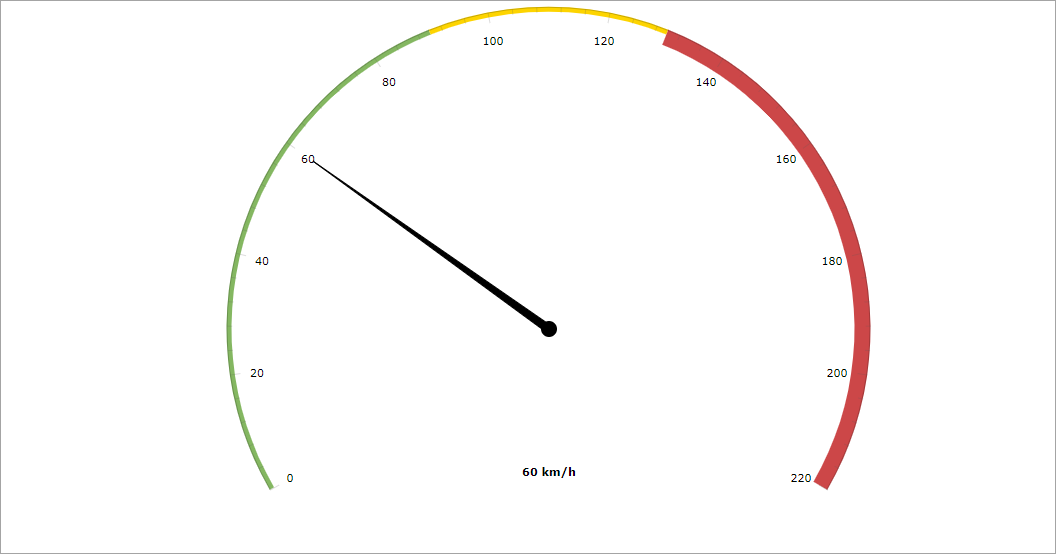
axes- includes the nestedaxiselements for the chart axes.<chart:axes> <chart:axis axisAlpha="0.2" axisThickness="1" bottomText="60 km/h" bottomTextYOffset="-20" endValue="220" tickAlpha="0.2" valueInterval="20"> </chart:axis> </chart:axes>The
bandelement enables you to split an axis into several bands (as in the picture above):<chart:axes> <chart:axis axisAlpha="0.2" axisThickness="1" bottomText="60 km/h" bottomTextYOffset="-20" endValue="220" tickAlpha="0.2" valueInterval="20"> <chart:bands> <chart:band color="#84b761" endValue="90" startValue="0"/> <chart:band color="#fdd400" endValue="130" startValue="90"/> <chart:band color="#cc4748" endValue="220" innerRadius="95%" startValue="130"/> </chart:bands> </chart:axis> </chart:axes>The
endValueandstartValueattributes are used to set the range of values on the chart, thevalueIntervalattribute defines the gauge scale marks.
Events and Handlers
|
To generate a handler stub in Jmix Studio, select the component in the screen descriptor XML or in the Jmix UI hierarchy panel and use the Handlers tab of the Jmix UI inspector panel. Alternatively, you can use the Generate Handler button in the top panel of the screen controller. |
For more details, see AmCharts documentation.
