Getting Started with Reports
This section contains instructions about using reports wizard to create and run reports. For an easy start, the reports add-on comes with the reports wizard, which is a visual tool for quick report creation, including both data structure and template design.
Project Setup
- Installing add-ons
-
First, create a new Jmix application and then follow the instruction to install the reports add-on and charts add-on.
- Creating entities and screens
-
As an example, we will create a sample Library application with several simple entities.
-
Create
Authorentity containing the following fields:-
firstNamewithStringtype. -
lastNamewithStringtype.
-
-
Create
LiteratureType,Publisher,LibraryDepartment, andTownentities, each contains only the name field:-
namewithStringtype.
-
-
Create
Bookentity containing the following fields:-
namewithStringtype. -
summarywithStringtype and unlimited length. -
literatureTypeassociated toLiteratureTypeentity with a many-to-one relationship. -
authorsassociated toAuthorentity with a many-to-many relationship.
-
-
Create
BookPublicationentity containing the following fields:-
yearwithIntegertype. -
bookassociated toBookentity with a many-to-one relationship. -
publisherassociated toPublisherentity with a many-to-one relationship. -
townassociated toTownentity with a many-to-one relationship.
-
-
Create
BookInstanceentity containing the following fields:-
isReferencewithBooleantype. -
inventoryNumberwithLongtype. -
bookCountwithIntegertype. -
bookPublicationassociated toBookPublicationentity with a many-to-one relationship. -
libraryDepartmentassociated toLibraryDepartmententity with a many-to-one relationship.
-
-
For all the entities created above, create browser and editor screens for each of them.
-
Start the application then add some data for each of the entities. We will use these data for the next steps.
To run the wizard, click Create → Using wizard in the Reports screen.
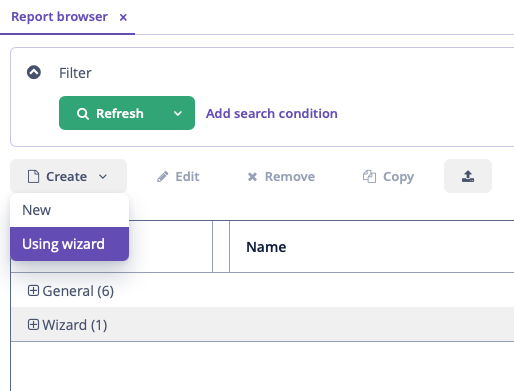
Three types of reports can be created using the wizard:
-
Report for a single entity.
-
Report for a list of given entities.
-
Report for a list of entities filtered by query.
Report design is a three steps process:
-
Creating a data structure of a report.
-
Editing of report regions.
-
Saving the report.
The created report can be modified in the usual manner using the report editor and run through the generic report browser or using special actions (ListPrintFormAction, EditorPrintFormAction, etc.).
Report for a Single Entity
Let us assume that we want to get information about the particular publication of a book, for example, an instance of BookPublication entity.
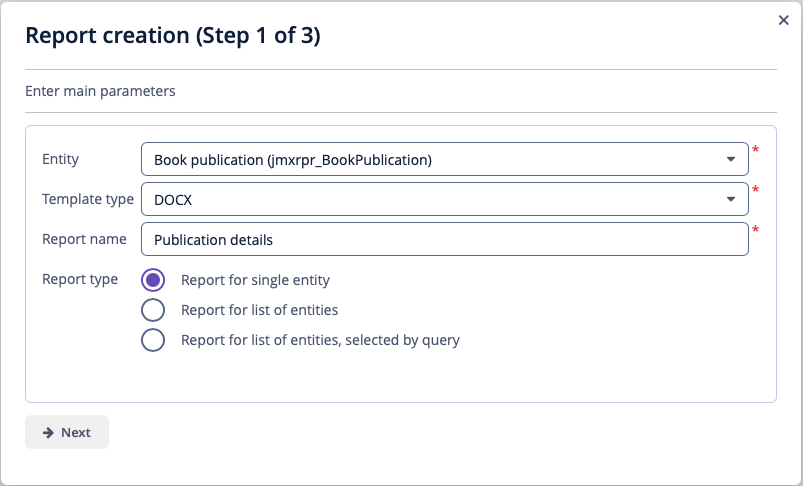
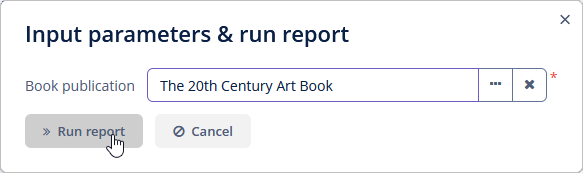
First, run the reports wizard and specify the report details:
Next, specify the report type: Report for single entity.
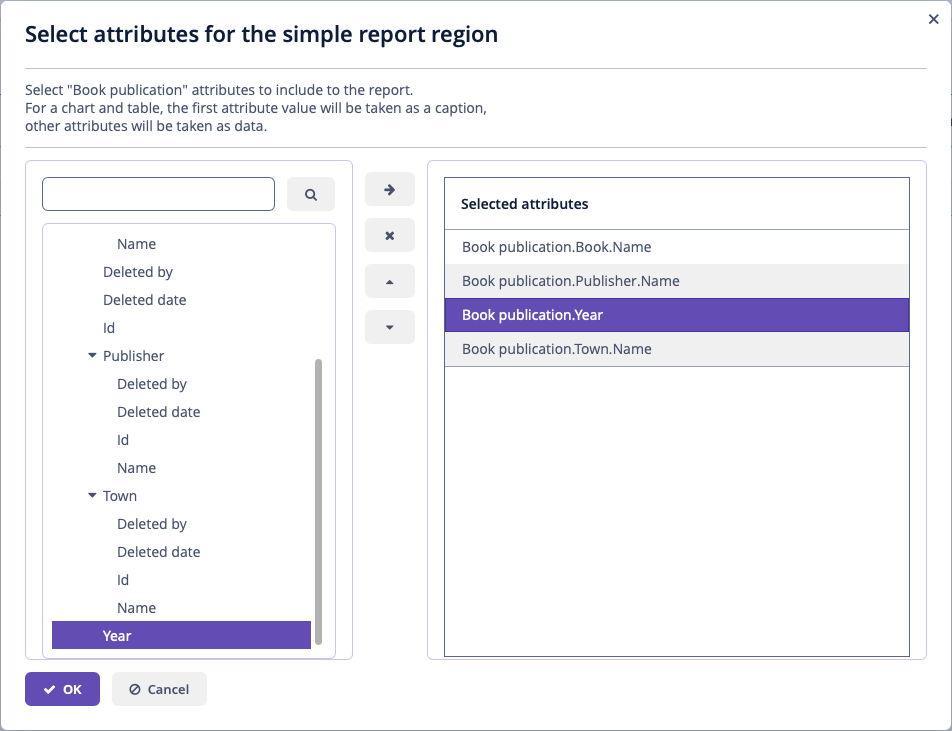
Then click the Next button; the Select attributes for the simple report region window appears. Specify the attributes of the BookPublication entity and linked entities that should be reflected in the report (Publication.Book.Name, Publication.Publisher.Name, Publication.Year and Publication.Town.Name). In order to do this, select them in the left column and move them to the right clicking ![]() or by double-click.
or by double-click.
The order of the attributes in the report will correspond to the order specified in the right-hand side list. To change the display order, move the attributes up and down by clicking  /
/ .
.
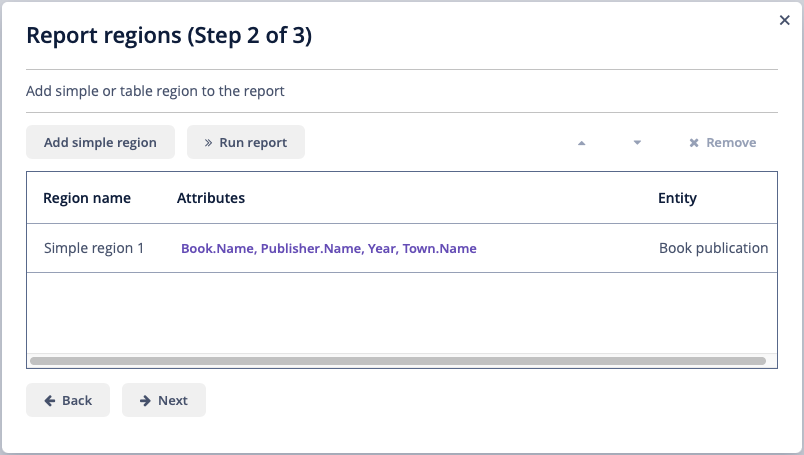
Click ОК to move to the second stage – report regions editing.
The appeared screen contains a list of named regions – bands that display related data. The wizard enables adding several plain-text regions to the template in order to display different data sets.
A set of entity attributes loaded to a particular region can be modified by clicking the link represented as the list of the selected attributes. You can also add a new region by clicking Add simple region.
If the entity contains collection attributes, the Add tabulated region button will appear. It enables adding a region for tabular data display.
In both cases, the selection dialog will appear with a list of attributes of the BookPublication entity, allowing you to add or remove attributes from the set.
At this stage, we already can run the report and see how the report looks. Click the Run button, pick the instance of BookPublication and see the result.
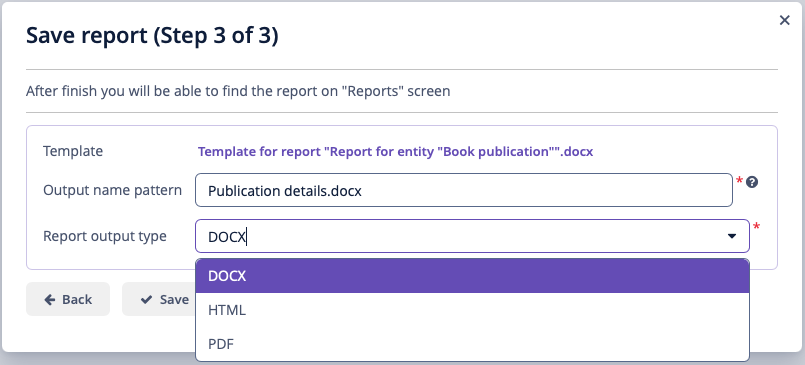
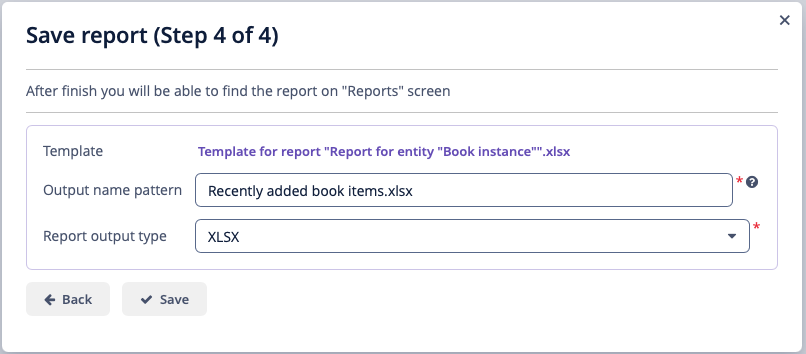
When all report regions are configured you can move on to the third stage: saving the report. At this point, you can view the complete report template, or change the name and format of the output file to one of the available types.
After clicking the Save button, the standard report editor comes up. Now you can fine-tune the report in the usual manner. Once editing is complete, click Save and close in the report editor.
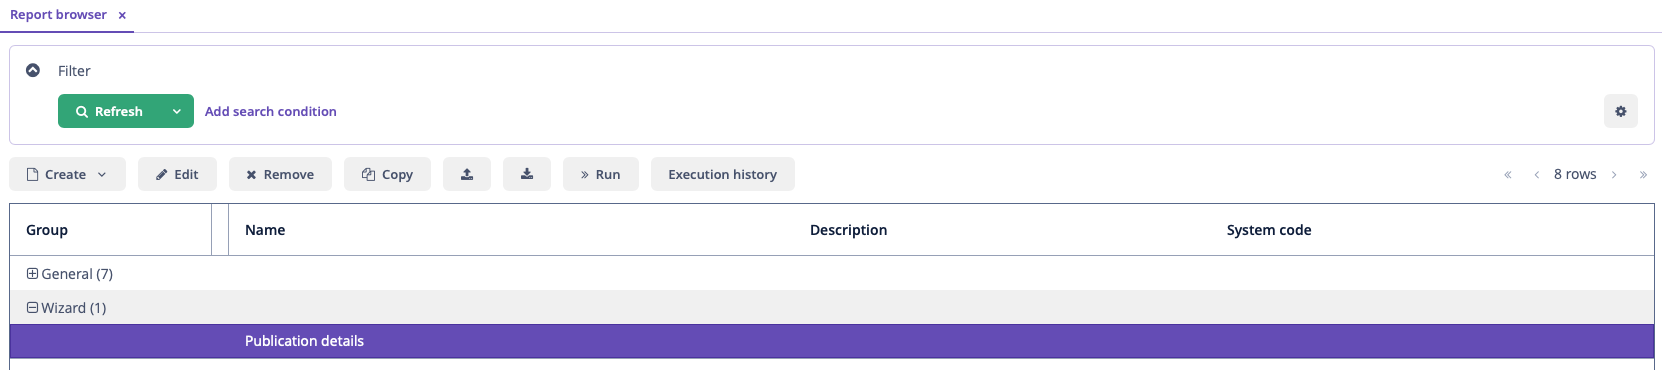
The report is now added to the General reports group in the reports browser, where you can run it from by clicking the Run button.
Additionally, we can enable the report run on the publications browser. In order to do this, we will declare a standard ListPrintFormAction in the book-publication-browse.xml screen descriptor:
<actions>
    <action id="list" type="listPrintForm" caption="msg://printDetails"/> (1)
</actions>
<buttonsPanel id="buttonsPanel" alwaysVisible="true">
    <button id="list" action="bookPublicationsTable.list"/> (2)
</buttonsPanel>| 1 | The type attribute defines a specific listPrintForm action type. |
| 2 | Add a button with run report action. |
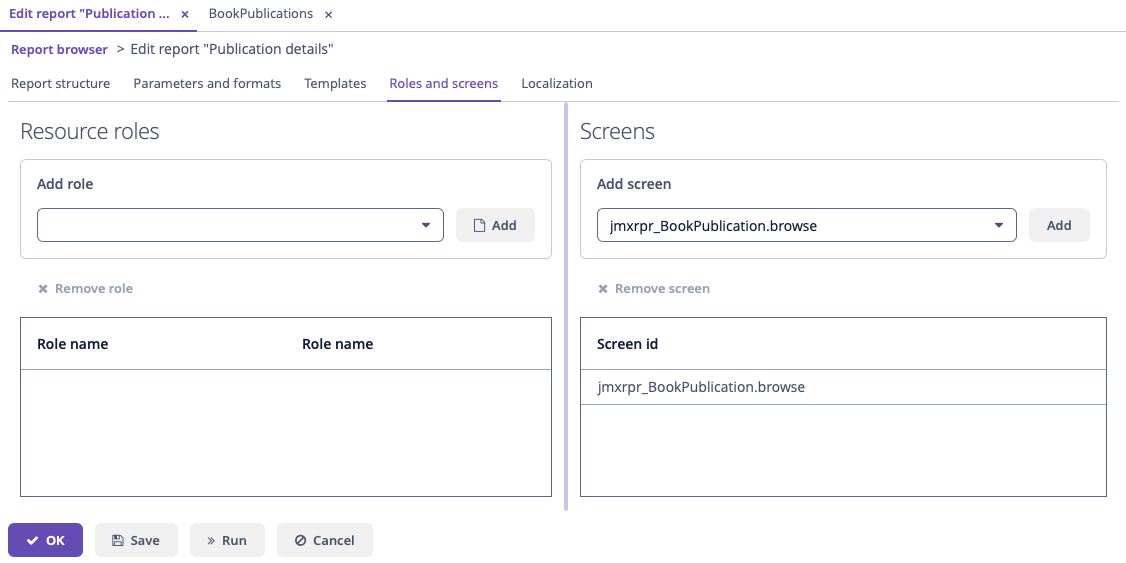
Then we should link our report with the BookPublication browser. Open the report editor, switch to the Roles and Screens tab and add the BookPublication.browse screen from the dropdown list to the table below:
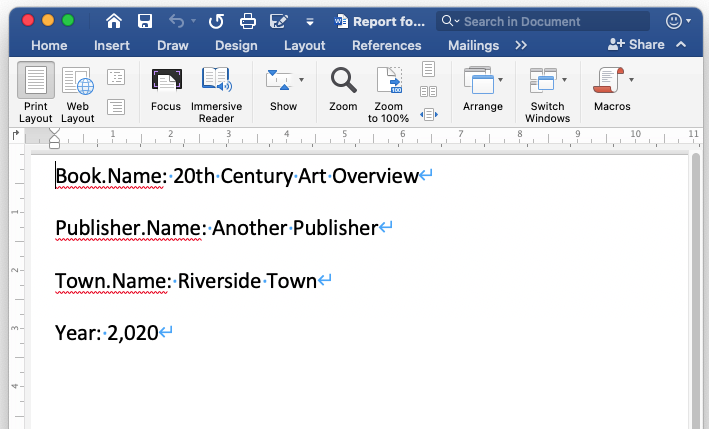
Now you can run the report for any publication by selecting it in the table and simply clicking the Print details button.
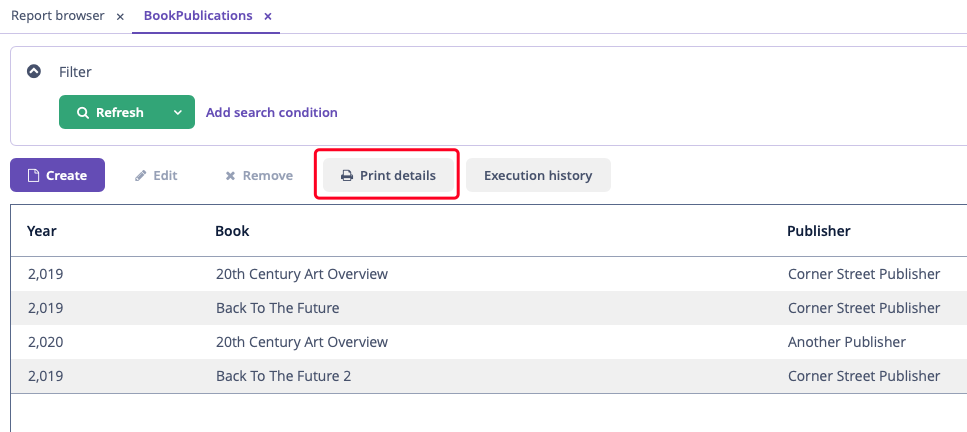
The output is as follows:
Report for a List of Entities
The reports wizard allows you to create two types of reports for a list of entity instances:
-
Report for manually selected instances of a particular entity
-
Report for entity instances filtered by a certain request.
Let us have a look at the first report type. For instance, we want to obtain a list of all book instances in the library (BookInstance entity) with titles and library departments they belong to.
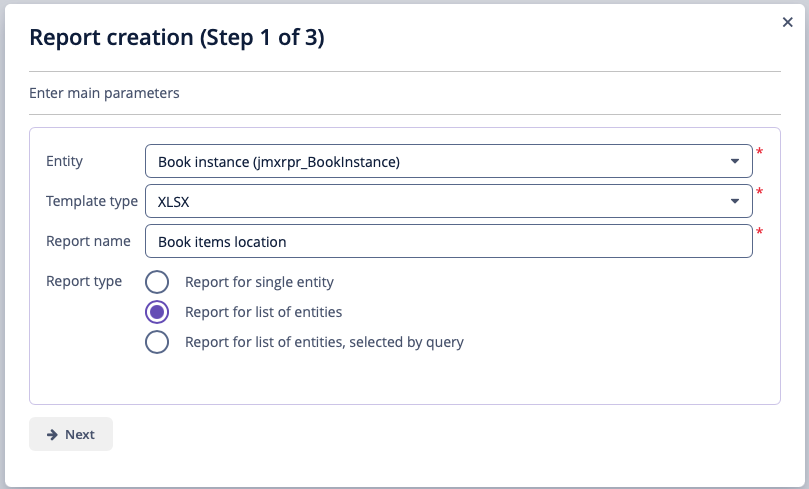
Click Create → Using wizard in the Reports screen. Then, we specify the report details:
-
Entity – report entity –
BookInstance. -
Template type – output format – XSLX.
-
Report name – report name –
Book items location.
After that, select the type of the report (Report for list of entities) and click Next.
As per the task, we select BookItem.Publication.Book.Name and BookItem.LibraryDepartment.Name in the attributes selection window.
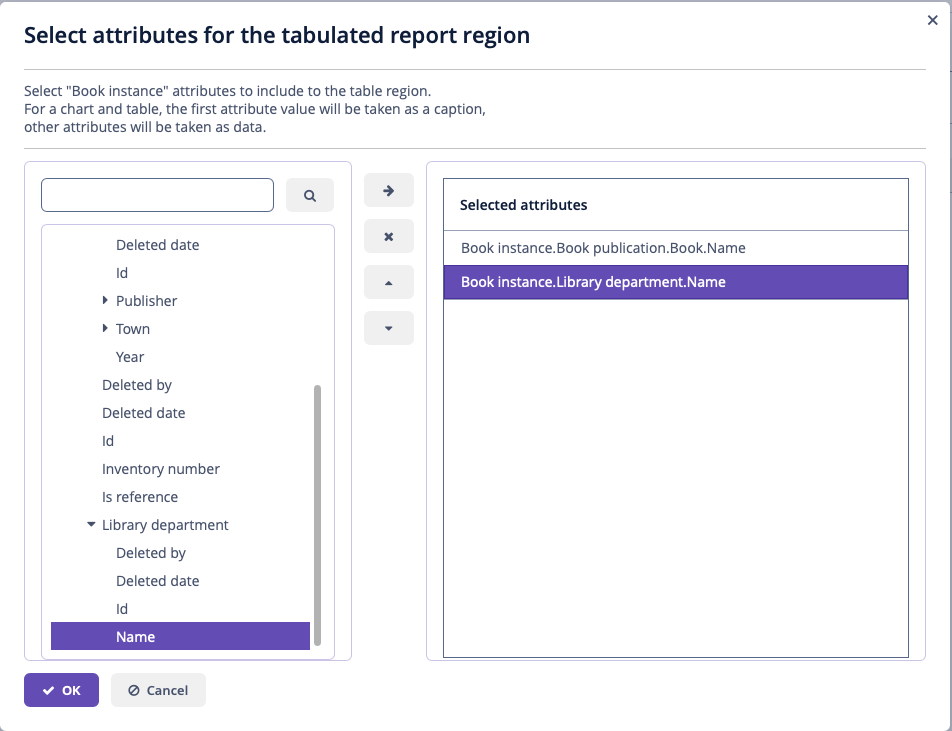
Click ОК and move to the second stage of report regions editing.
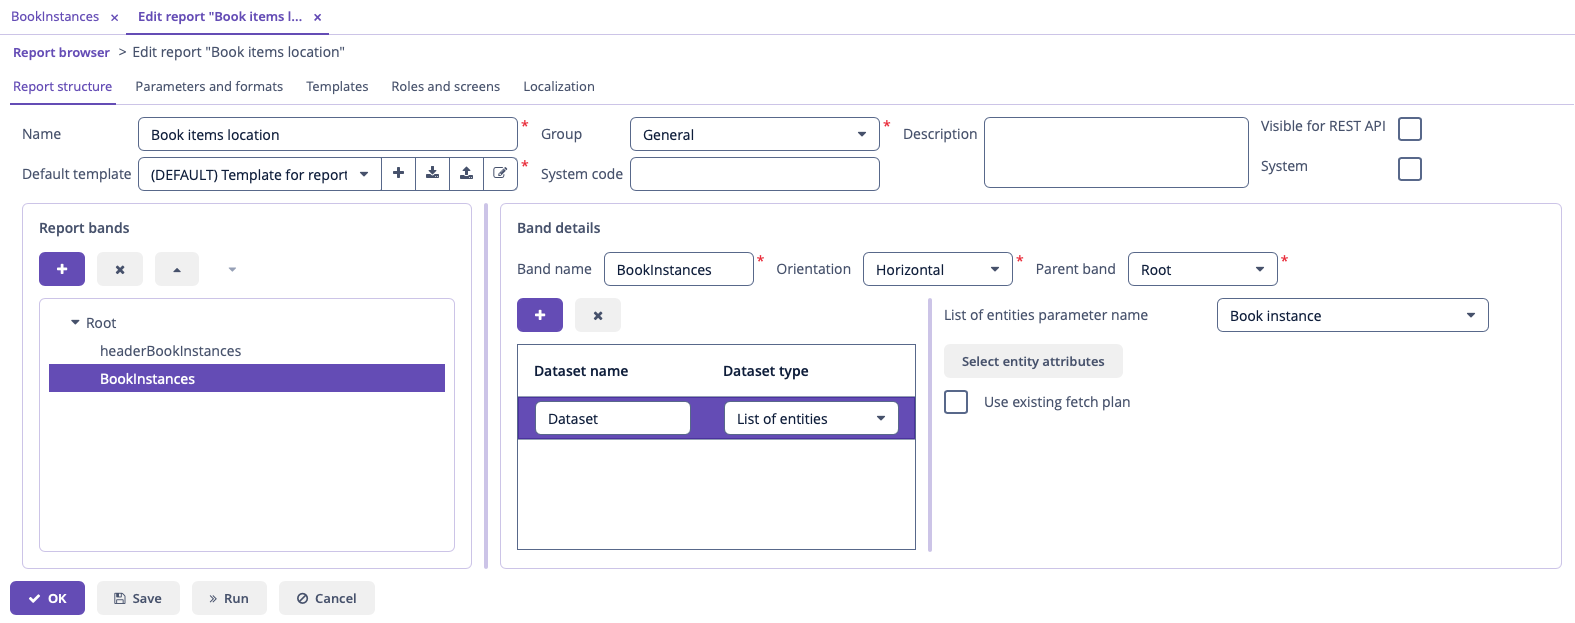
The report template for a list of entities restricted to have only one region that displays data in tabular form. Adding new regions is not allowed, but you can edit an existing set of data by clicking on the link with the list of attributes, or remove an existing region and recreate it.
In this case, we do not need to make any changes. Click Next → Save to save the report. The report looks as follows in the report editor:
Once the report is saved, you can run it through the generic report browser.
In addition, we can add a button to run the report from the book items browser, which can be opened by clicking the Show items button in the publications browser. In order to do this, we will set the multiselect attribute for the book instances table to true to be able to specify a set of records for the report and then declare a standard ListPrintFormAction:
<table id="bookInstancesTable"
       width="100%"
       dataContainer="bookInstancesDc"
       multiselect="true"> (1)
    <actions>
        <action id="list" type="listPrintForm" caption="msg://printList"/> (2)
    </actions>
    <buttonsPanel id="buttonsPanel"
                  alwaysVisible="true">
        <button id="listBtn" action="bookInstancesTable.list"/> (3)
</buttonsPanel>| 1 | Use multiselect mode. |
| 2 | The type attribute defines a specific listPrintForm action type. |
| 3 | Add a button with run report action. |
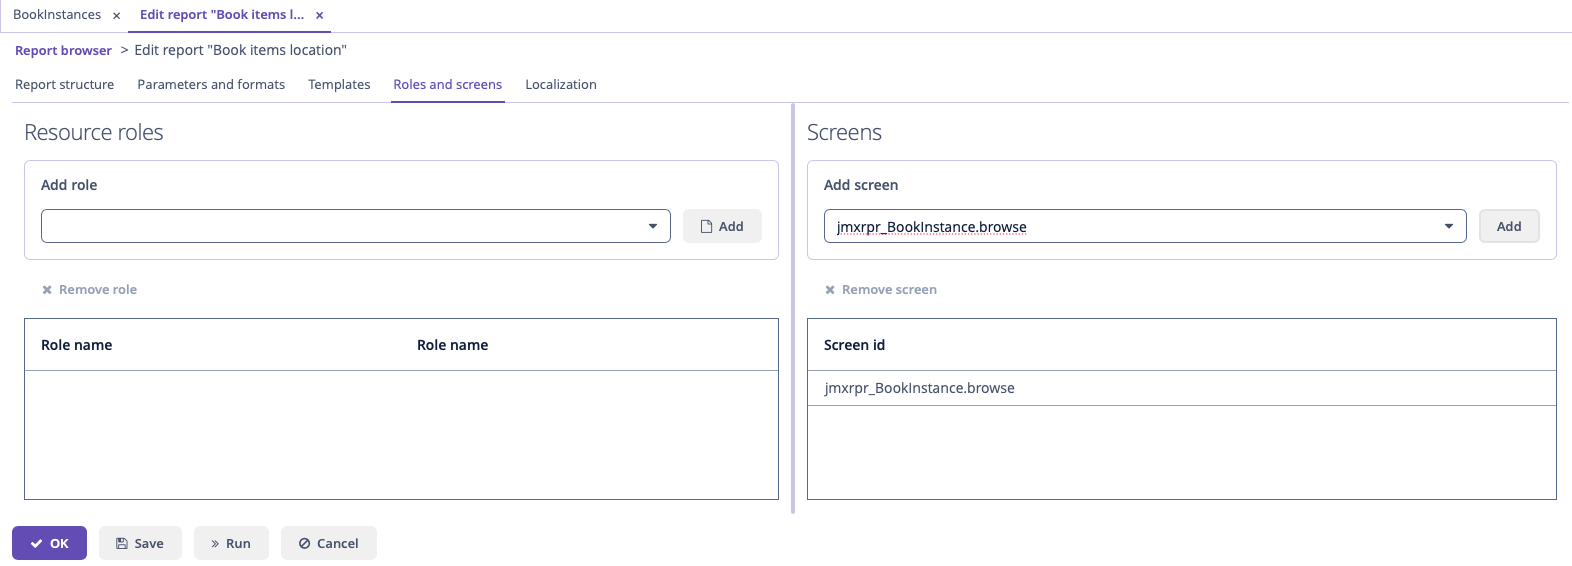
Then we should link the Book items location report with the book items browser. Open the report editor, switch to the Roles and Screens tab and add the library$BookInstance.browse screen from the screens dropdown to the table below:
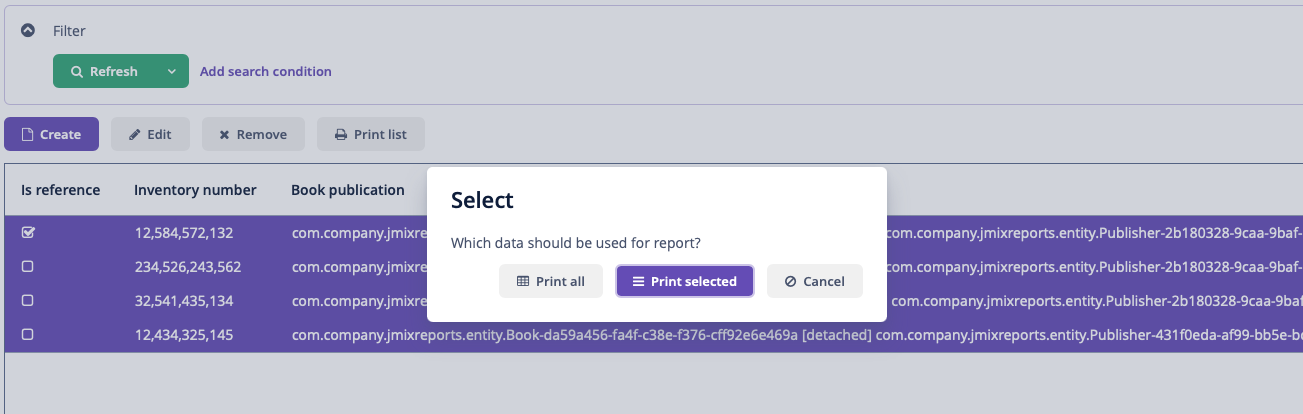
Now the report can be run from the book items browser. In the BookInstances browser screen select items for the report in the table and click the Print list button. Print selected option exports the selected items, Print all option prints all instances selected by the current filter.
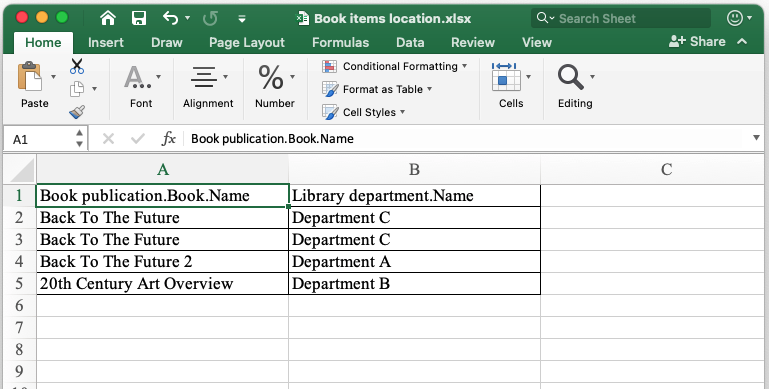
The output is as follows:
Report for a List of Entities Filtered by Query
Now let’s have a look at the last report type suggested by the wizard: the report for a list of entities filtered by a query. To demonstrate this use case, we will complicate the previous example. As before, the report will contain a list of books (with their titles and department names), but only added after a certain date.
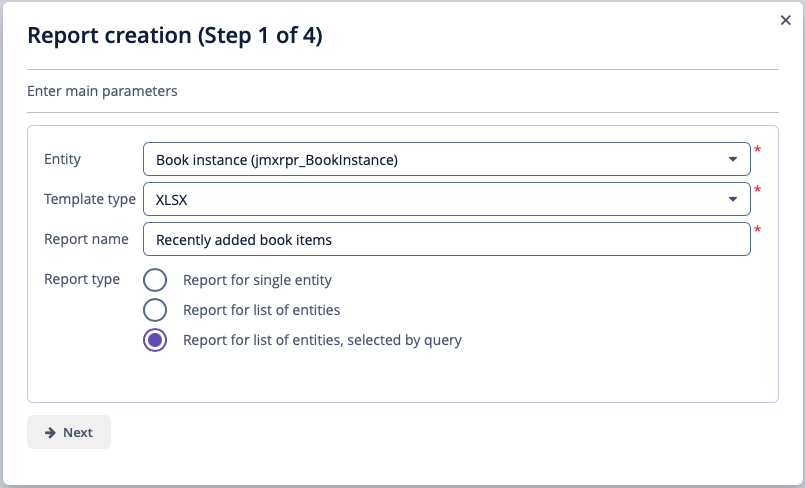
Click Create → Using wizard in the Reports screen. Like in the previous case:
-
Entity – report entity –
BookInstance. -
Template type – output file format – XSLX.
-
Report name –
Recently added book items.
Then select the Report for list of entities, selected by query report type.
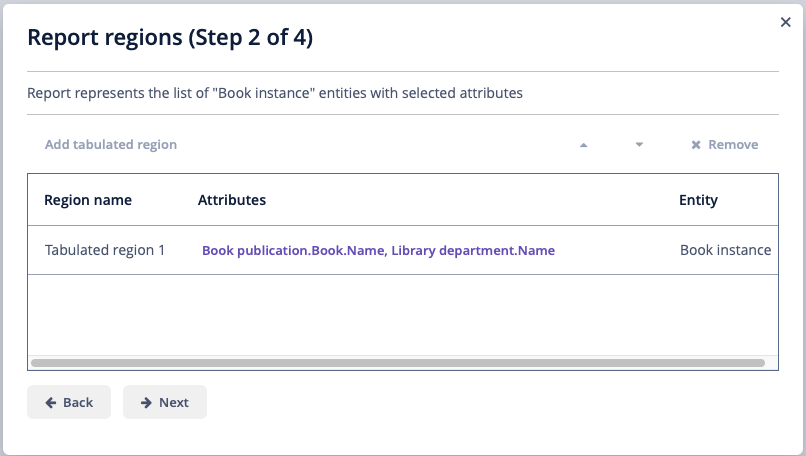
Click Next and move to BookInstance attributes selection. We move BookItem.Publication.Book.Name and BookItem.LibraryDepartment.Name attributes to the right. Click OK to move on to accomplish the first stage.
The report template for a list of entities restricted to have only one region that displays data in tabular form. Adding new regions is not allowed, but you can edit an existing set of data by clicking on the link with the list of attributes, or remove an existing region and recreate it.
In this case, we do not need to make any changes. Click Next.
Now JPQL Query window will show. In the Query field, it displays the auto-generated JPQL based on the entity and the attributes we selected in step 1.
To add a query condition, you can directly add it in the Query field or by clicking the Create button. For example, we added a condition where e.createdDate >= :createDt in the Query field, then click the Generate button to generate parameters.
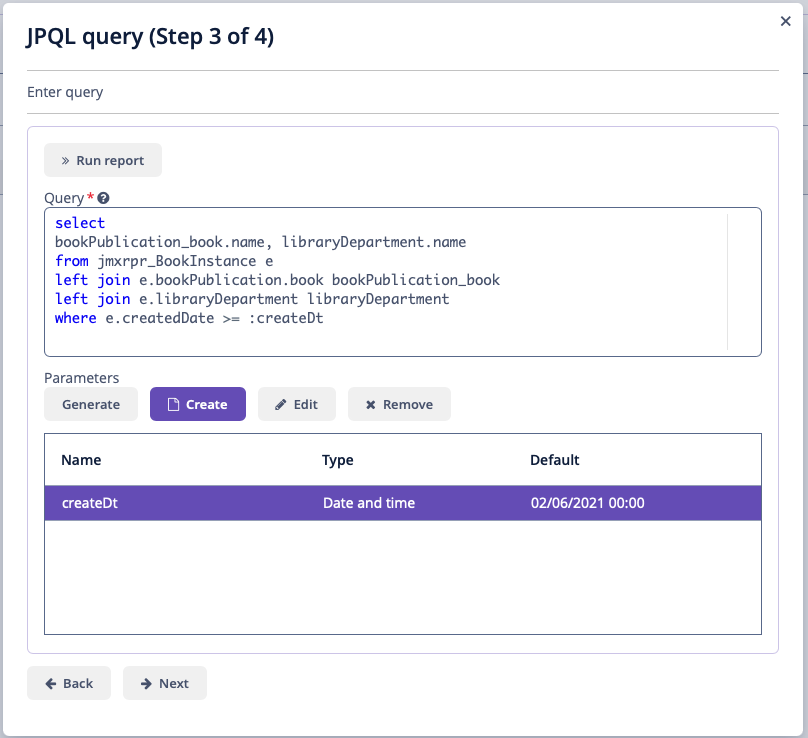
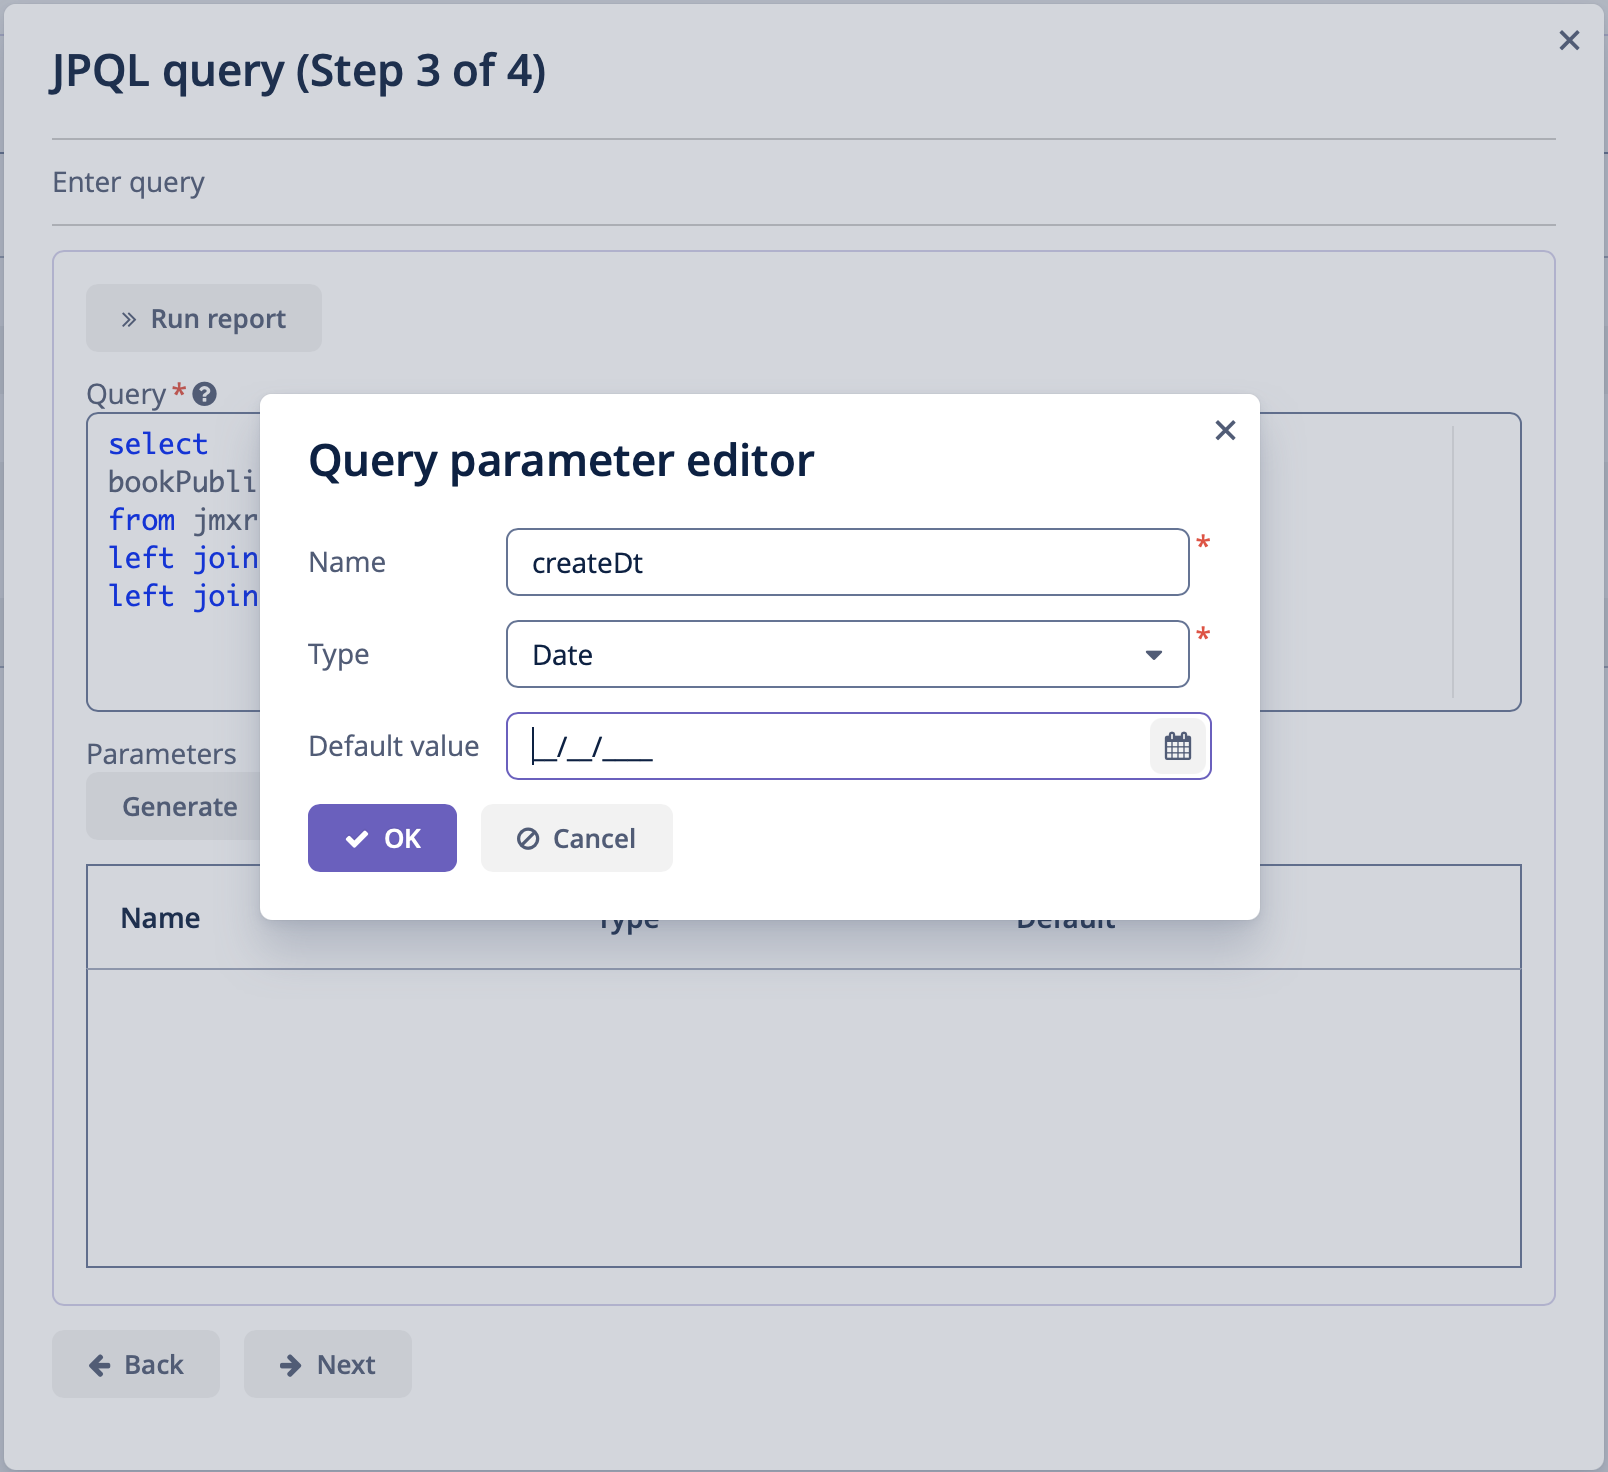
Alternatively, you can click the Create button to add the parameter, then modify the JPQL query to use the parameter:
After setting JPQL query and parameters, click Next. Then in below Save report window, click Save.
The editor enables making the report structure more sophisticated by adding new bands and data sets, as well as configuring the report template design, localization, access rights.
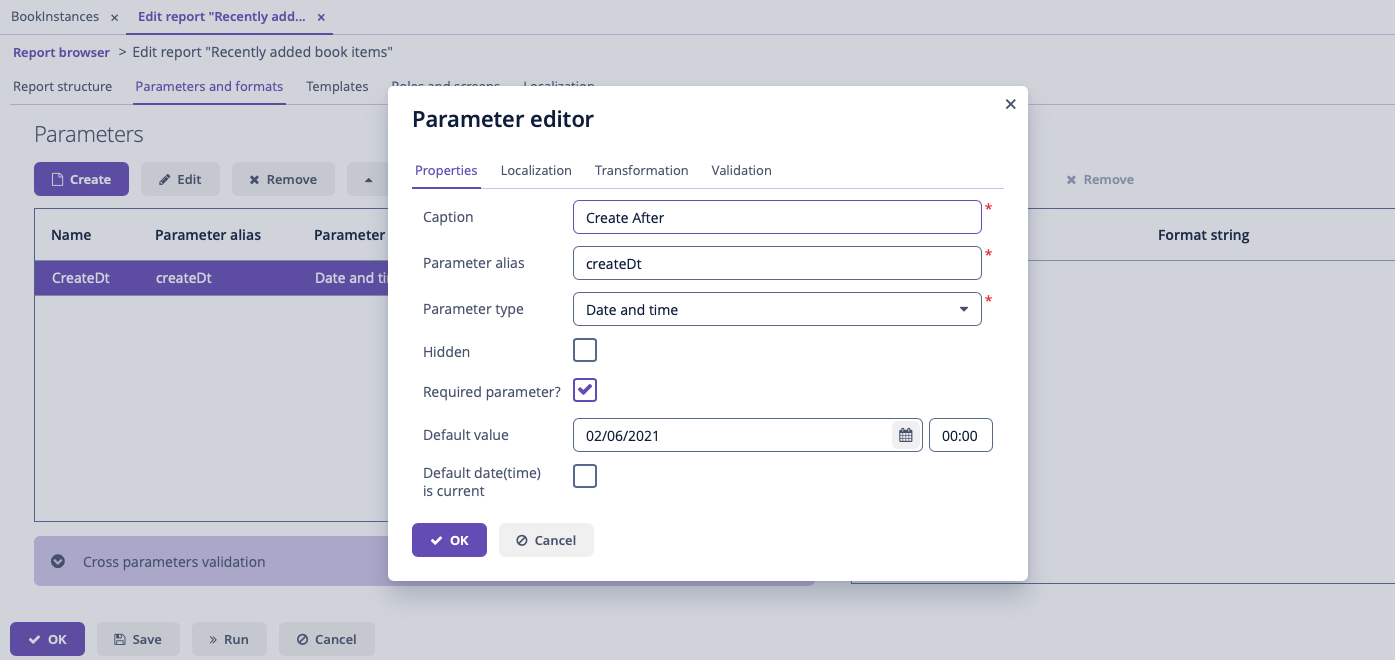
For instance, we can switch to Parameters and Formats tab and modify the query parameter in the Parameters list: Create After instead of the standard CreateDt. Save the changes and close the report editor.
After all steps, let us add the Run report button that runs the report right from the library departments browser.
In order to do this, we need to define a new RunReportAction standard action and a button for it in the library-department-browse.xml screen descriptor:
<actions>
    <action id="run" type="runReport"/> (1)
</actions>
<buttonsPanel id="buttonsPanel"
              alwaysVisible="true">
    <button id="runReportBtn"
            action="libraryDepartmentsTable.run"
            caption="Run Report"/> (2)
</buttonsPanel>| 1 | The type attribute defines a specific runReport action type. |
| 2 | Add a button with run report action. |
For each report, add LibraryDepartment.browse to the screens list on the Roles and Screens tab of the report editor, as we did in the previous examples.
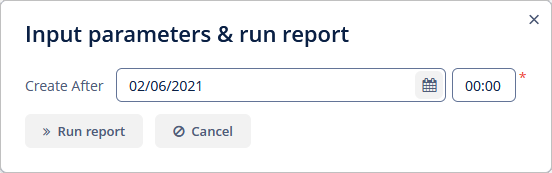
The Run report button will appear in the library departments browser, displaying the list of all reports available in the system in one click. In order to run the report, select Recently added book items in the list, specify the date and click Run report.
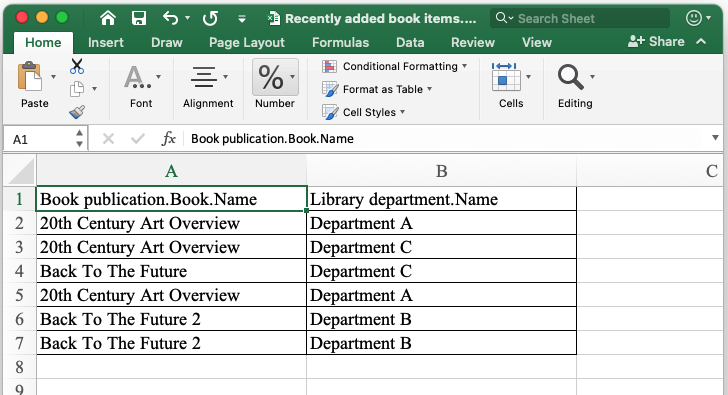
The output is as follows:
Report with Chart Output
Using the report wizard, you can create reports with chart output in the same way as any other report types. The only difference is that you will need to configure the chart template after finishing the report in the wizard.
-
Start creating a report as described in the previous chapters, but we select Chart as template type.
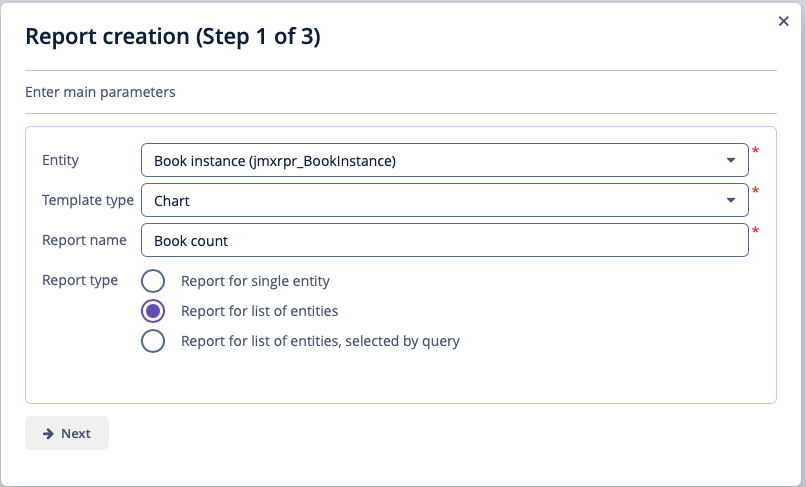 Figure 26. Chart Template in Wizard – Step 1
 -
For the chart report, select countable entity attributes – they will be later used for the value axis.
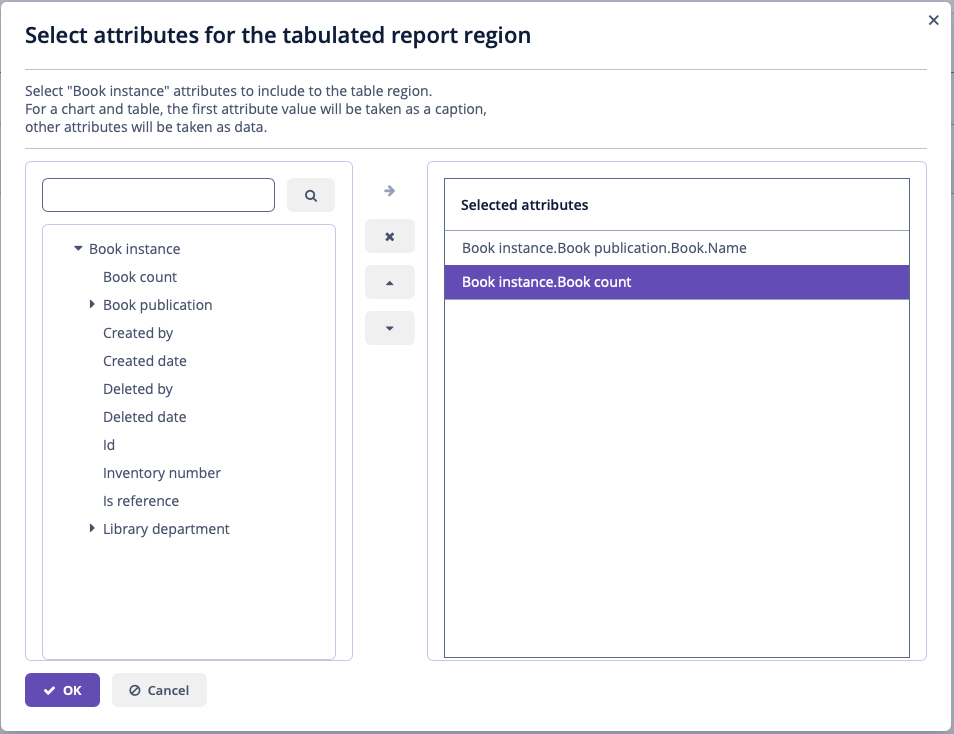 Figure 27. Chart Template in Wizard – Select Attributes
 -
Complete the next step of the report creation.
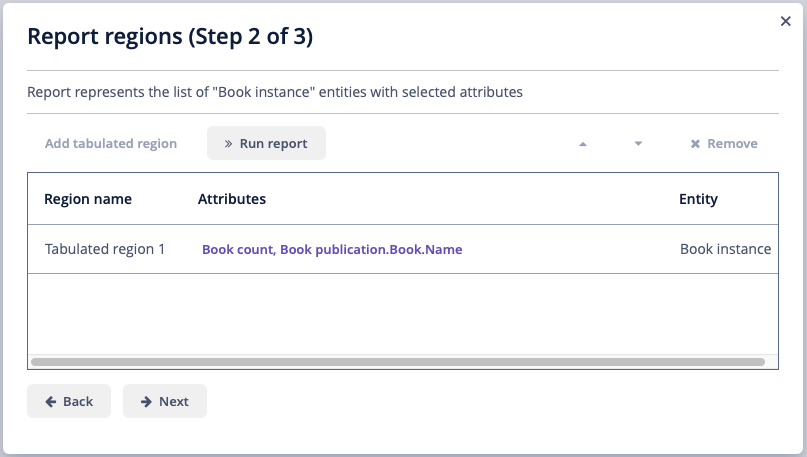 Figure 28. Chart Template in Wizard – Step 2
 -
At the last step, select the chart type – either Pie or Serial – and save the report.
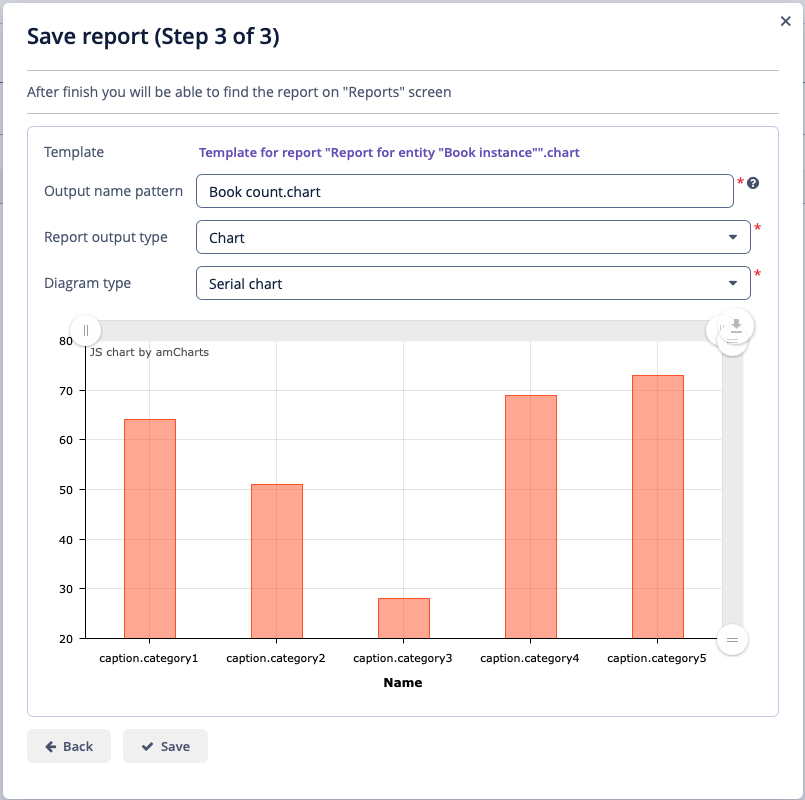 Figure 29. Chart Template in Wizard – Step 3
 -
Finally, configure the chart axis on the Templates tab of the report editor.
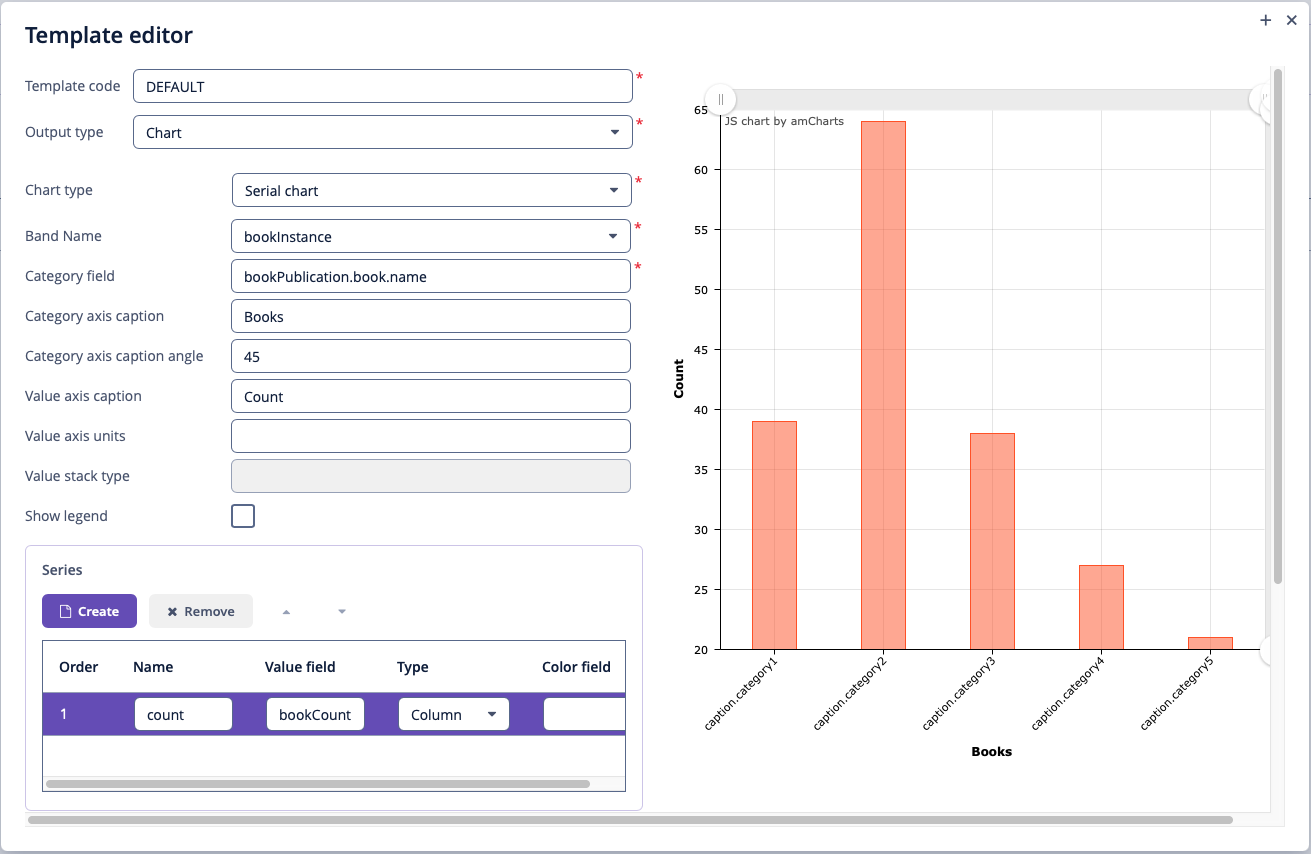 Figure 30. Chart Template Configuration
Then, you can run the report in the generic report browser. For more information about chart templates, please refer to template documentation.
