High-Density Data Visualization
High-density data is a type of dataset that has a large number of data points within a specific spatial or temporal region.
Large and dense datasets can be difficult to visualize effectively. There are several methods that can be used to visualize high-density data in a more meaningful manner. The following sections will discuss these methods.
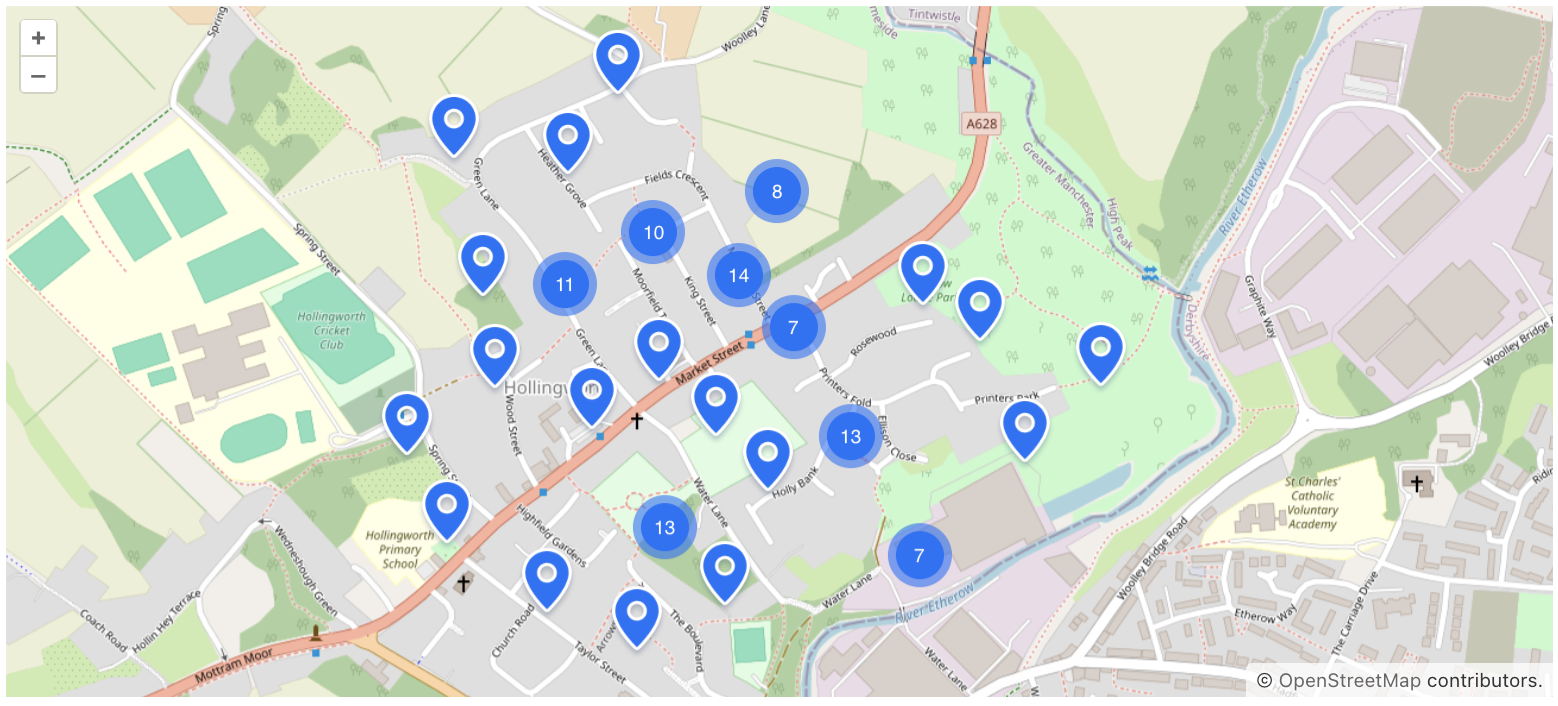
Clustering
Clustering is a method of grouping features in a layer based on their proximity to each other. Typically, the size of each cluster is proportional to the number of features contained within it. This can be useful for showing areas where many points are located close together.
Clustering is configured on the cluster source associated with the vector layer. The cluster source should either incorporate a nested DataVectorSource or a VectorSource.
For example, to cluster features from a data container in XML, follow these steps:
-
Include a vector layer in the geoMap component.
-
Add
ClusterSourceto this layer. -
Set up
DataVectorSourcefor the cluster in the following manner:<maps:geoMap id="geoMap" width="100%" height="100%"> <maps:layers> <maps:tile> <maps:osmSource/> </maps:tile> <maps:vector id="vectorLayer"> <maps:cluster> <maps:dataVectorSource dataContainer="locationsDc" property="building"/> </maps:cluster> </maps:vector> </maps:layers> </maps:geoMap>
Below, we will outline the key aspects of clustering.
ClusterSource
ClusterSource is a source that enables feature clustering on the map. It requires an additional source to supply features, which can be either:
-
DataVectorSource -
VectorSource
To cluster features without data binding use VectorSource:
<maps:geoMap id="map"
             width="100%"
             height="100%">
    <maps:layers>
        <maps:tile>
            <maps:osmSource/>
        </maps:tile>
        <maps:vector id="vector">
            <maps:cluster>
                <maps:vectorSource/>
            </maps:cluster>
        </maps:vector>
    </maps:layers>
</maps:geoMap>
Cluster Attributes
Cluster has the following attributes:
-
attributionsrepresents text for credits. -
disableAtZoomestablishes a zoom level at which clustering becomes disabled. -
distanceindicates the distance in pixels at which features get clustered together. -
minDistancedenotes the minimum pixel distance between clusters. (For more details, refer to OSM documentation). -
showSinglePointAsClusterdisplays a single point as a cluster of size 1. -
weightProperty- if provided, each point in the layer will have an integer weight value based on theweightproperty of the geo-object. This value aids in calculating the combined cluster value (by default, the point count is utilized). -
wrapXdetermines whether the world should be horizontally wrapped.
Weight Property
By default, the cluster computes the count of points within it, which is then displayed on the cluster marker. weightProperty allows us to indicate the property that the cluster should utilize for calculation.
For instance, the project includes a JPA entity:
@JmixEntity
@Table(name = "LOCATION")
@Entity
public class Location {

    @Column(name = "BUILDING")
    private Point building; (1)

    @Column(name = "WEIGHT")
    private Integer weight; (2)

    // getters and setters
}| 1 | The building attribute contains coordinates locating the building on the map. |
| 2 | The weight attribute holds a numerical value that provides information about a building. |
In the XML descriptor, we set up the configuration for the cluster:
<data>
    <collection id="locationsDc" class="com.company.mapssample.entity.Location">
        <loader id="locationsDl" readOnly="true">
            <query>
                <![CDATA[select e from Location e]]>
            </query>
        </loader>
        <fetchPlan extends="_base"/>
    </collection>
</data>
<facets>
    <dataLoadCoordinator auto="true"/>
</facets>
<layout>
    <maps:geoMap id="locationsMap"
                 width="100%"
                 height="100%">
        <maps:layers>
            <maps:tile>
                <maps:osmSource/>
            </maps:tile>
            <maps:vector id="vectorL">
                <maps:cluster weightProperty="weight">
                    <maps:dataVectorSource dataContainer="locationsDc"
                                           property="building"/>
                </maps:cluster>
            </maps:vector>
        </maps:layers>
    </maps:geoMap>
</layout>
Cluster Icon Styling
Cluster icons can be customized using the Java API. There are two methods for styling:
-
Introduce a new style that covers the default one.
@ViewComponent("locationMap.vectorLr.cluster")
public ClusterSource cluster;

@Subscribe
public void onInit(final InitEvent event) {
    cluster.addPointStyles(new Style()
            .withImage(new CircleStyle()
                    .withRadius(15)
                    .withFill(new Fill("#7F70D8"))));
}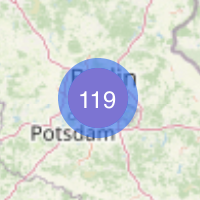
-
Removing the default style and adding a completely new one.
@ViewComponent("styledMap.vectLr.clusterS")
public ClusterSource clusterS;

@Subscribe
public void onInit(final InitEvent event) {
    clusterS.removeAllPointStyles();
    clusterS.addPointStyles(
            new Style()
                    .withImage(new CircleStyle()
                            .withRadius(20)
                            .withFill(new Fill("rgba(163, 104, 213, 0.6)"))),
            new Style()
                    .withImage(new CircleStyle()
                            .withRadius(15)
                            .withFill(new Fill("rgba(144, 64, 213, 1)"))));
}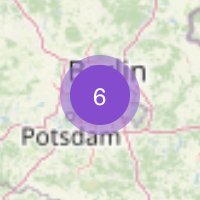
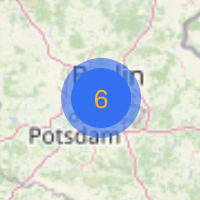
To change text style, use the setPointTextStyle() method:
@ViewComponent("textStyleMap.vctLayer.clusterSource")
public ClusterSource clusterSource;

@Subscribe
public void onInit(final InitEvent event) {
    clusterSource.setPointTextStyle(new Style()
            .withText(new TextStyle()
                    .withFont("13px sans-serif")
                    .withOffsetY(1)
                    .withFill(new Fill("#FAAF22"))));
}
Set Property for Feature
Features have the ability to define the properties that will be associated with these features.
If the cluster specifies the weight property, it will try to obtain it from the features' properties.
Let’s consider the following example:
<maps:geoMap id="featuresMap"
             height="100%"
             width="100%">
    <maps:layers>
        <maps:tile>
            <maps:osmSource/>
        </maps:tile>
        <maps:vector id="pointsLayer">
            <maps:cluster id="pointClusterSource"
                          weightProperty="weight" >
                <maps:vectorSource id="source"/>
            </maps:cluster>
        </maps:vector>
    </maps:layers>
</maps:geoMap>
@ViewComponent("featuresMap.pointsLayer.pointClusterSource.source")
public VectorSource source;
@Subscribe
public void onInit(final InitEvent event) {
source.addAllFeatures(generatePoints());
}
private List<Feature> generatePoints() {
List<Feature> features = new ArrayList<>(10000);
int e = 45;
for (int i = 0; i < 10000; i++) {
Point point = GeometryUtils.createPoint(2 * e * Math.random(),
2 * e * Math.random() - e);
features.add(
new PointFeature(point)
.withProperty("weight",
Double.valueOf(Math.random() * 10).intValue()));
}
return Collections.unmodifiableList(features);
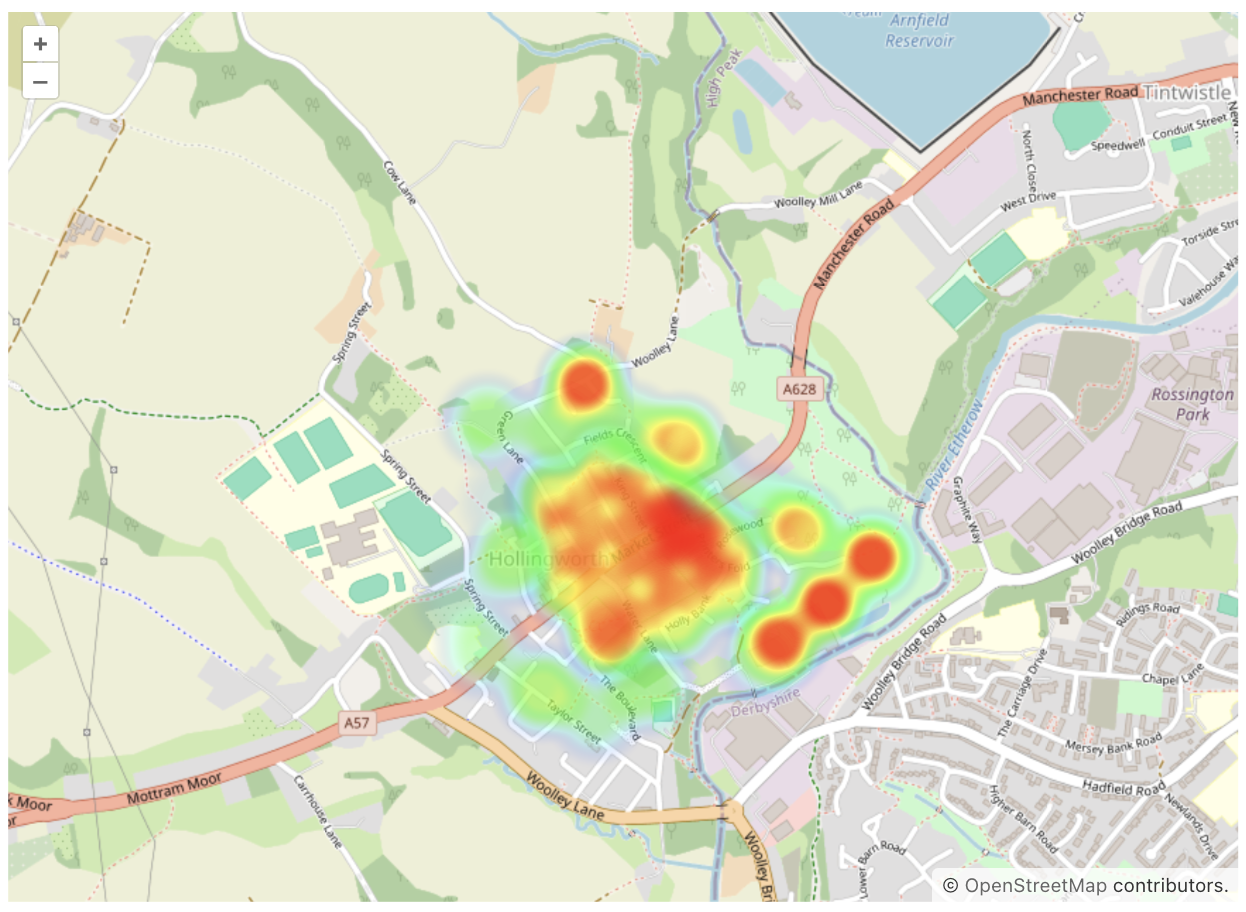
}Heatmap
A heatmap renders point features as a raster surface, highlighting areas with a higher concentration of points along a continuous color gradient.
Warmer colors (such as red or orange) indicate areas with higher values, while cooler colors (like blue or green) indicate lower values.
Heatmaps are configured on the HeatmapLayer. This layer displays data in the form of heat points. HeatmapLayer works with HeatmapDataVectorSource and VectorSource.
-
HeatmapDataVectorSourceis used to bind with data containers (entities or DTOs). Thepropertyattribute should refer to the property of the entity that has thePointtype. -
VectorSourceshould be used when there is no need to bind with the data containers.
For example, to add a heatmap linked to the data container, follow these steps:
-
Include a heatmap layer in the geoMap component: select the
geoMapelement in the Jmix UI hierarchy panel or in the view XML descriptor, then click the Add button in the inspector panel. From the drop-down list, choose Layers → HeatmapLayer.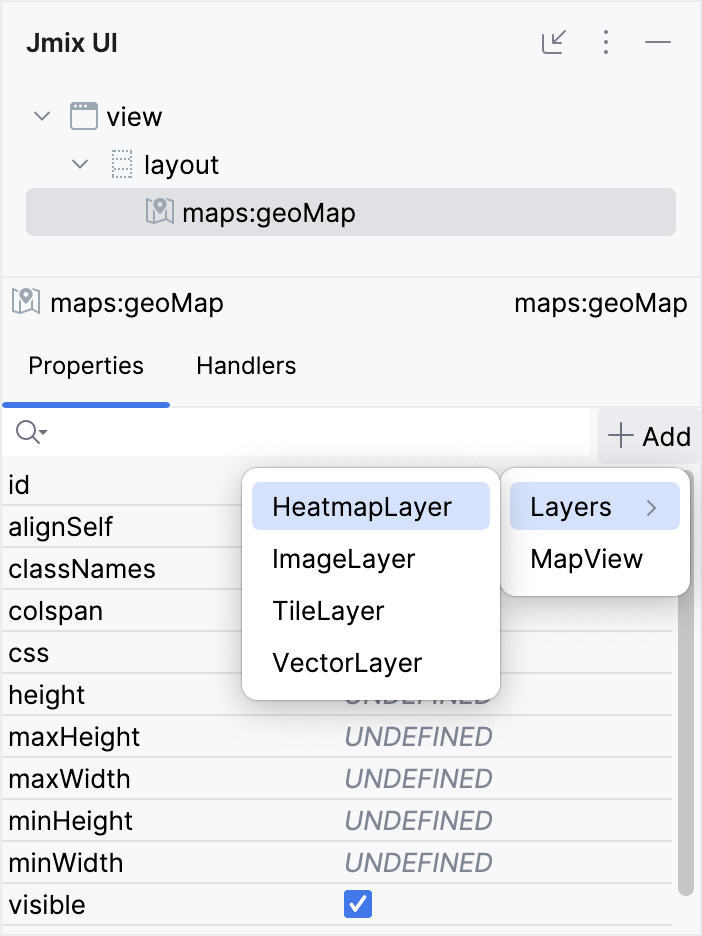
-
Add
HeatmapDataVectorSourceto this layer. Set up this source in the following manner:<data> <collection id="locationsDc" class="com.company.mapssample.entity.Location"> <loader id="locationsDl" readOnly="true"> <query> <![CDATA[select e from Location e]]> </query> </loader> <fetchPlan extends="_base"/> </collection> </data> <layout> <maps:geoMap id="defaultMap" width="100%" height="100%"> <maps:layers> <maps:tile> <maps:osmSource/> </maps:tile> <maps:heatmap blur="20" radius="15"> <maps:heatmapDataVectorSource dataContainer="locationsDc" property="building"/> (1) </maps:heatmap> </maps:layers> </maps:geoMap> </layout>1 Define a property from the Locationentity that has aPointtype.
Below, we will outline the key aspects of heatmaps.
Heatmap Attributes
Heatmap has the following attributes:
-
The weightProperty attribute specifies the entity property from which to retrieve the weight (intensity) or the property from
Feature.If the property is not specified, the maximum available weight value will be utilized. -
maxWeight- it indicates the maximum intensity value, ranging from0.0to1.0. -
blurspecifies the pixel size of the point blur effect. -
radiusspecifies the pixel size of the point radius. -
gradient- the color gradient of the point, which should consist of CSS colors separated by commas.
Additionally, include the base layer properties: className, maxZoom, minZoom, opacity, visible, zIndex
Take a look at the example:
<maps:heatmap weightProperty="intensity"
              maxWeight="0.5"
              blur="20"
              radius="20"
              gradient="#32CD32, #00FF00, #7CFC00, #7FFF00, #ADFF2F">
    <maps:heatmapDataVectorSource dataContainer="locationsDc"
                                  property="building"/>
</maps:heatmap>
Weight Property
weightProperty is a property that determines the intensity or weight of a point displayed on the heatmap. It should be specified either in a Feature or an entity. The values for this property should be within the range of 0.0 and 1.0 and should be of type Double.
If the weightProperty value is not explicitly defined, a default value of 1 is commonly used to represent the maximum intensity level for the heatmap points.
Examples
Heatmap without Data Binding
VectorSource is used when there is no need to bind with the data containers.
In the example below, a map is created and initially configured using XML.
<maps:geoMap id="map"
             width="100%"
             height="100%">
    <maps:layers>
        <maps:tile>
            <maps:osmSource/>
        </maps:tile>
        <maps:heatmap id="heatmap"
                      blur="10"
                      radius="15"
                      weightProperty="weight"> (1)
            <maps:vectorSource id="vectorSource"/> (2)
        </maps:heatmap>
    </maps:layers>
</maps:geoMap>| 1 | Set the property that will be associated with Feature. |
| 2 | Specify id for the vector source, which will enable you to inject it into the controller. |
After that, additional properties are set programmatically in Java controller:
@ViewComponent("map.heatmap.vectorSource") (1)
private VectorSource vectorSource;

@Subscribe
public void onInit(final InitEvent event) {
    PointFeature feature = new PointFeature(GeometryUtils.createPoint(10, 10));
    feature.withProperty("weight", 1); (2)

    vectorSource.addFeature(feature);
}| 1 | Inject vectorSource into the controller class. |
| 2 | Pass the weight value into the method, which we previously specified for the heatmap element in the XML descriptor. |
Heatmap Linked to Data
For instance, the project includes a JPA entity:
@JmixEntity
@Table(name = "LOCATION")
@Entity
public class Location {

    @Column(name = "BUILDING")
    private Point building; (1)

    @Column(name = "INTENSITY")
    private Double intensity; (2)

    // getters and setters
}| 1 | The building attribute contains coordinates locating the building on the map. |
| 2 | The intensity attribute holds a numerical value that provides some additional information. |
In the XML descriptor, we set up the configuration for a heatmap:
<data>
    <collection id="locationsDc"
                class="com.company.mapssample.entity.Location">
        <loader id="locationsDl" readOnly="true">
            <query>
                <![CDATA[select e from Location e]]>
            </query>
        </loader>
        <fetchPlan extends="_base"/>
    </collection>
</data>
<layout>
    <maps:geoMap id="geoMap"
                 width="100%"
                 height="100%">
        <maps:layers>
            <maps:tile>
                <maps:osmSource/>
            </maps:tile>
            <maps:heatmap blur="10"
                          radius="15"
                          weightProperty="intensity"> (1)
                <maps:heatmapDataVectorSource dataContainer="locationsDc"
                                              property="building"/>
            </maps:heatmap>
        </maps:layers>
    </maps:geoMap>
</layout>| 1 | Specify in the weightProperty attribute the value of the entity property that contains the intensity value of the point. |
Heatmap with WeightProvider
HeatmapDataVectorSource has a specific method in cases where an entity/DTO doesn’t have a weight property or needs to calculate it in some other way. In these cases, it is not necessary to specify weightProperty, as the provider will be used instead.
In the example below, a map is created and initially configured using XML.
<maps:geoMap id="locationMap"
             width="100%"
             height="100%">
    <maps:layers>
        <maps:tile>
            <maps:osmSource/>
        </maps:tile>
        <maps:heatmap id="heatmapLayer"
                      weightProperty="intensity"
                      blur="15"
                      radius="20">
            <maps:heatmapDataVectorSource
                    id="heatmapDataVectorSource"
                    dataContainer="locationsDc"
                    property="building"/>
        </maps:heatmap>
    </maps:layers>
</maps:geoMap>
Afterward, we will set up a weight provider for heatmapDataVectorSource in Java controller:
@ViewComponent("locationMap.heatmapLayer.heatmapDataVectorSource")
private HeatmapDataVectorSource<Location> heatmapDataVectorSource; (1)

@Subscribe
public void onInit(final InitEvent event) {
    heatmapDataVectorSource.setWeightProvider(location -> { (2)
        int weight = location.getWeight();
        if (weight > 50) {
            return 0.7;
        }
        return 0.3;
    });
}| 1 | Please note: heatmapDataVectorSource is parameterized. |
| 2 | The provider is called for each item and should return a calculated weight value. |
